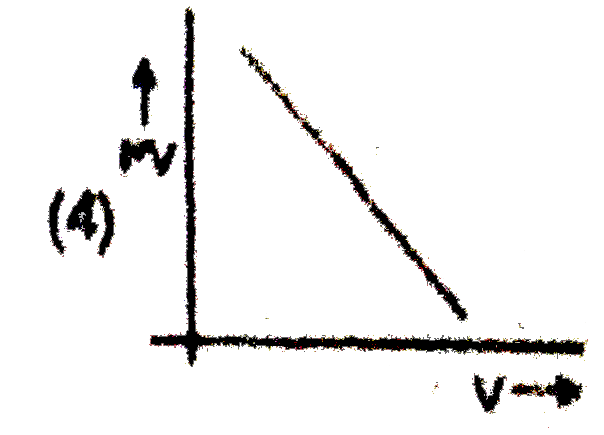
For an adiabatic process graph between PV & V for a sample of ideal gas will be
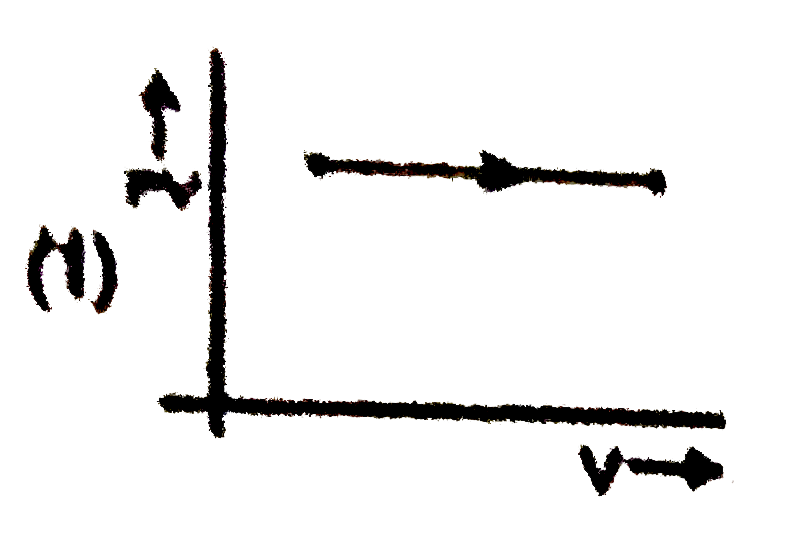
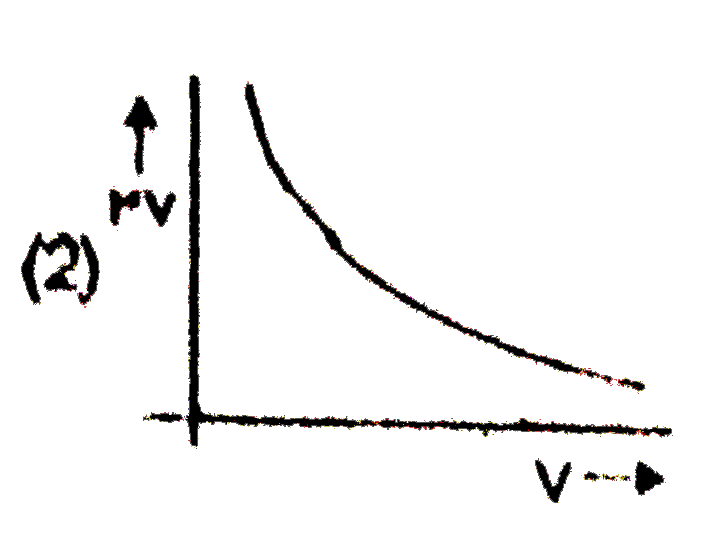
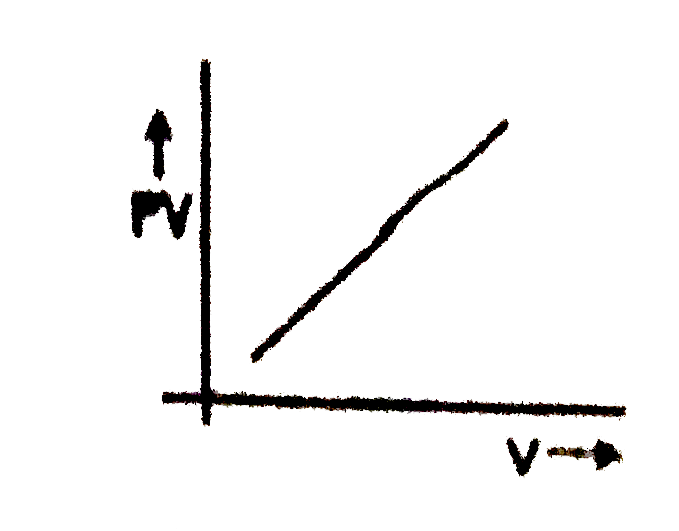
The correct Answer is:B
To solve the question regarding the graph between PV and V for an adiabatic process of an ideal gas, we can follow these steps:
1. Understand the Ideal Gas Law:
The ideal gas law is given by the equation PV=nRT, where P is pressure, V is volume, n is the number of moles, R is the ideal gas constant, and T is temperature.
2. Consider the Adiabatic Process:
In an adiabatic process, there is no heat exchange with the surroundings. For an ideal gas undergoing an adiabatic process, the relationship between temperature T and volume V is given by:
TVγ−1=constant
where γ (gamma) is the heat capacity ratio Cp/Cv.
3. Relate PV and T:
Since PV=nRT, we can express PV in terms of T:
PV=nR⋅T
Thus, the variation of PV with V will be the same as the variation of T with V.
4. Find the Relationship between T and V:
From the adiabatic condition TVγ−1=constant, we can express T as:
T=KV1−γ
where K is a constant.
5. Analyze the Exponent:
Since γ>1 for an ideal gas, 1−γ will be negative. This means that as V increases, T decreases, leading to an inverse relationship.
6. Graph Characteristics:
The graph of T versus V will be a decreasing curve. Since PV is proportional to T, the graph of PV versus V will also exhibit a similar decreasing trend.
7. Conclusion:
Therefore, the graph between PV and V for an adiabatic process of an ideal gas will be a curve that decreases as V increases.
The ideal gas law is given by the equation PV=nRT, where P is pressure, V is volume, n is the number of moles, R is the ideal gas constant, and T is temperature.
In an adiabatic process, there is no heat exchange with the surroundings. For an ideal gas undergoing an adiabatic process, the relationship between temperature T and volume V is given by:
TVγ−1=constant
where γ (gamma) is the heat capacity ratio Cp/Cv.
Since PV=nRT, we can express PV in terms of T:
PV=nR⋅T
Thus, the variation of PV with V will be the same as the variation of T with V.
From the adiabatic condition TVγ−1=constant, we can express T as:
T=KV1−γ
where K is a constant.
Since γ>1 for an ideal gas, 1−γ will be negative. This means that as V increases, T decreases, leading to an inverse relationship.
The graph of T versus V will be a decreasing curve. Since PV is proportional to T, the graph of PV versus V will also exhibit a similar decreasing trend.
Therefore, the graph between PV and V for an adiabatic process of an ideal gas will be a curve that decreases as V increases.
Topper's Solved these Questions
Similar Questions
Knowledge Check
- Question 1 - Select One
The graph of PV vs P for a gas is
AparabolicBhyperbolicCa straight line parallel to X-axisDa straight line passing through origin - Question 2 - Select One
Slope of PV and V for an isobaric process will be
A−1BzeroC+1Dn R T - Question 3 - Select One
Assertion : In an adiabatic process, change in internal energy of a gas is equal to work done on/by the gas in the process.
Reason : This is because temp.of gas remains constant in an adiabatic process.AIf both assetion and reason are true and reaasons is the correct expanation of assetionBIf both assetion and reason are tur but reason is not the correct explanation of assetionCIf assertion is true but reason is falseDIf both assertion and reason are false.
For adiabatic process of an ideal gas the value of dPP is equals to
View SolutionThe relation between U, p and V for an ideal gas in an adiabatic process is given by relation U=a+bpV. Find the value of adiabatic exponent (γ) of this gas.
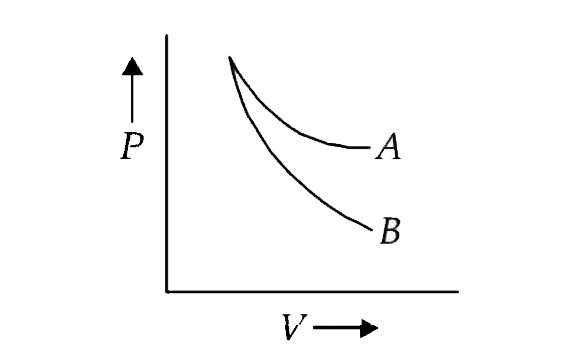
View SolutionThe curves A and B in the figure shown P-V graphs for an isothermal and an adiabatic process for an idea gas. The isothermal process is represented by the curve A.
 View Solution
The curves A and B in the figure shown P-V graphs for an isothermal and an adiabatic process for an idea gas. The isothermal process is represented by the curve A.
 View Solution
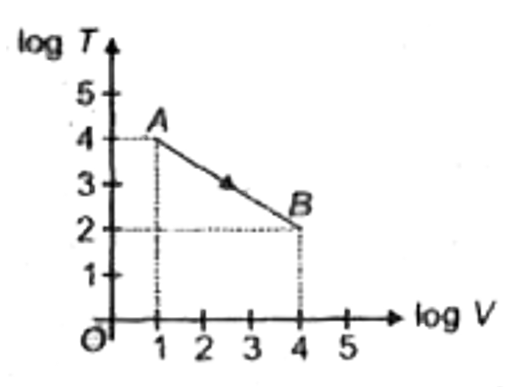
Figure shows , the adiabatic curve on log T and log V scale performed on ideal gas . The gas is
 View Solution


