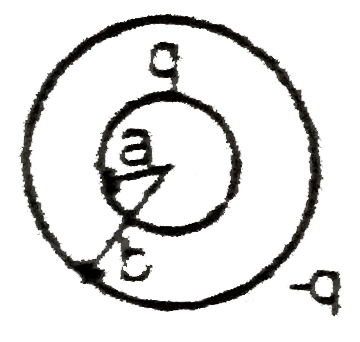
Figure shows two concentric shells of radii a and b uniformly distributed charges q and -q. Which of the following graphs gives correct variation of electric field intensity E with the distance r from the centre?
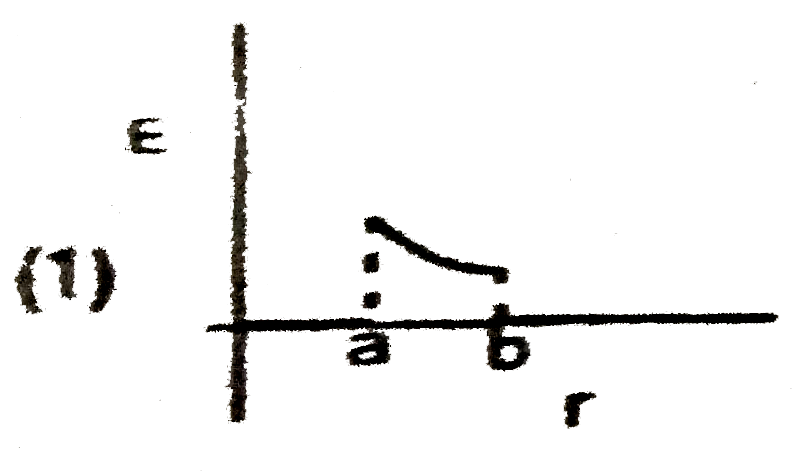
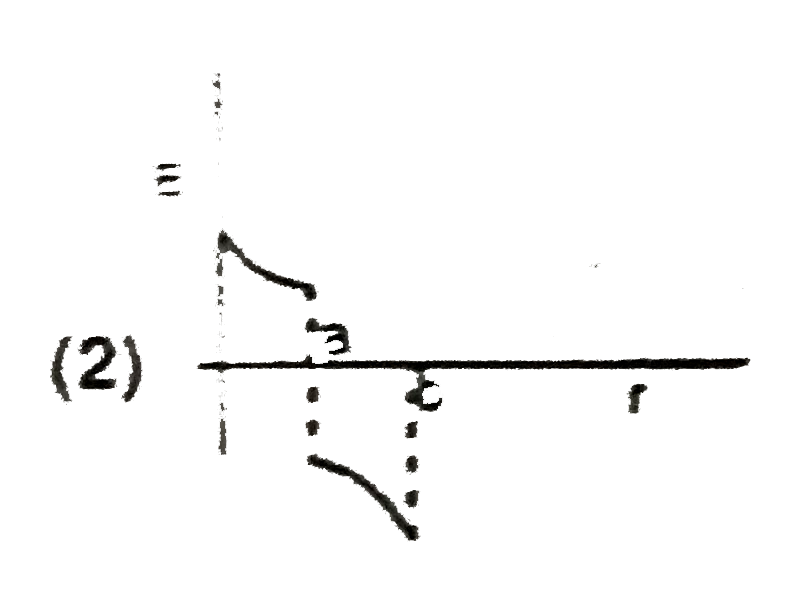
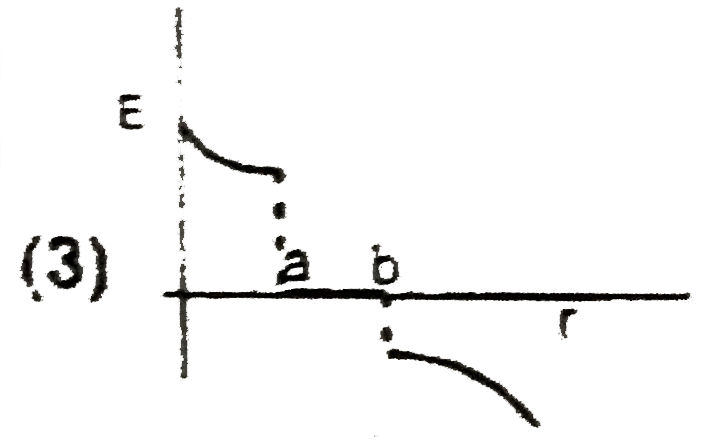
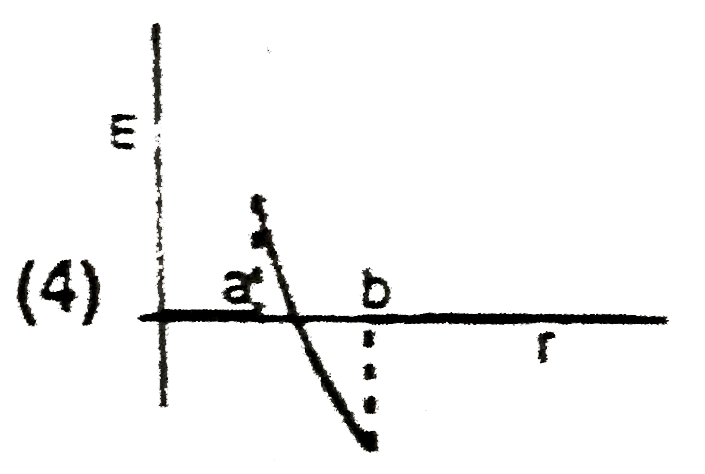
The correct Answer is:A
Step by step video & image solution for Figure shows two concentric shells of radii a and b uniformly distributed charges q and -q. Which of the following graphs gives correct variation of electric field intensity E with the distance r from the centre? by Physics experts to help you in doubts & scoring excellent marks in Class 11 exams.
Updated on:21/07/2023Topper's Solved these Questions
Similar Questions
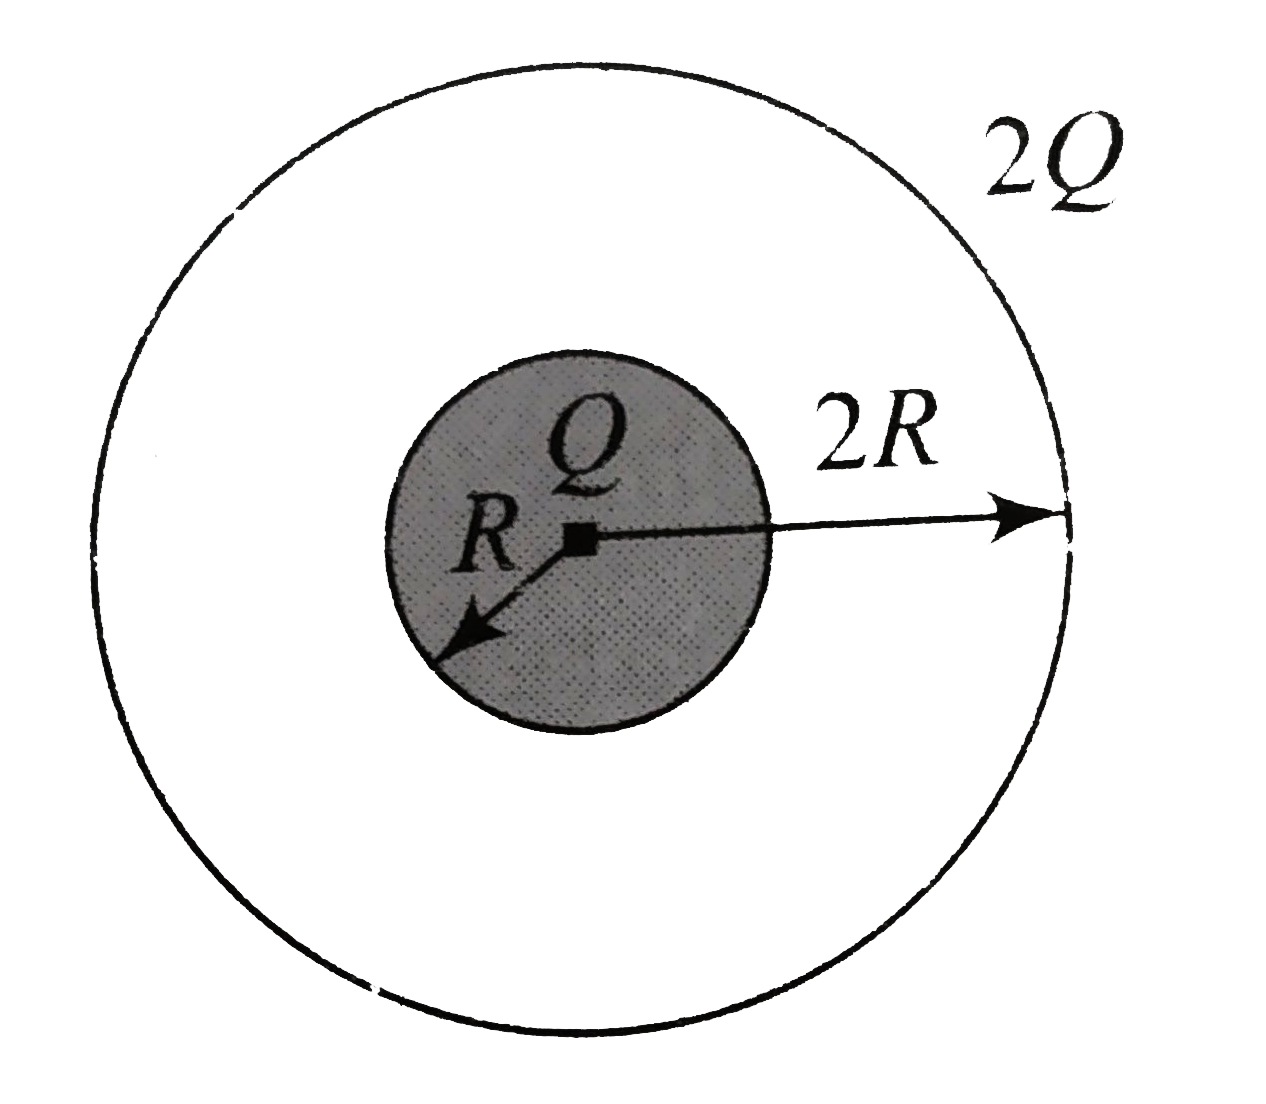
A charge Q is uniformly distributed in a dielectric sphere of radius R (having dielectric constant unity). This dielectric sphere is enclosed by a concentric spherical shell of radius 2R and having uniformly distributed charge 2Q. Which of the following graph correctly represents variation of electric field with distance r from the common centre?
View SolutionWhich one of the following graphs represents the variation of electric field with distance r from the centre of a charged spherical conductor of radius R?
View Solution
Knowledge Check
A spherical insulator of radius R is charged uniformly with a charge Q throughout its volume and contains a point charge Q16 located at its centre. Which of the following graphs best represents qualitatively, the variation of electric field intensity E with distance r from the centre?
A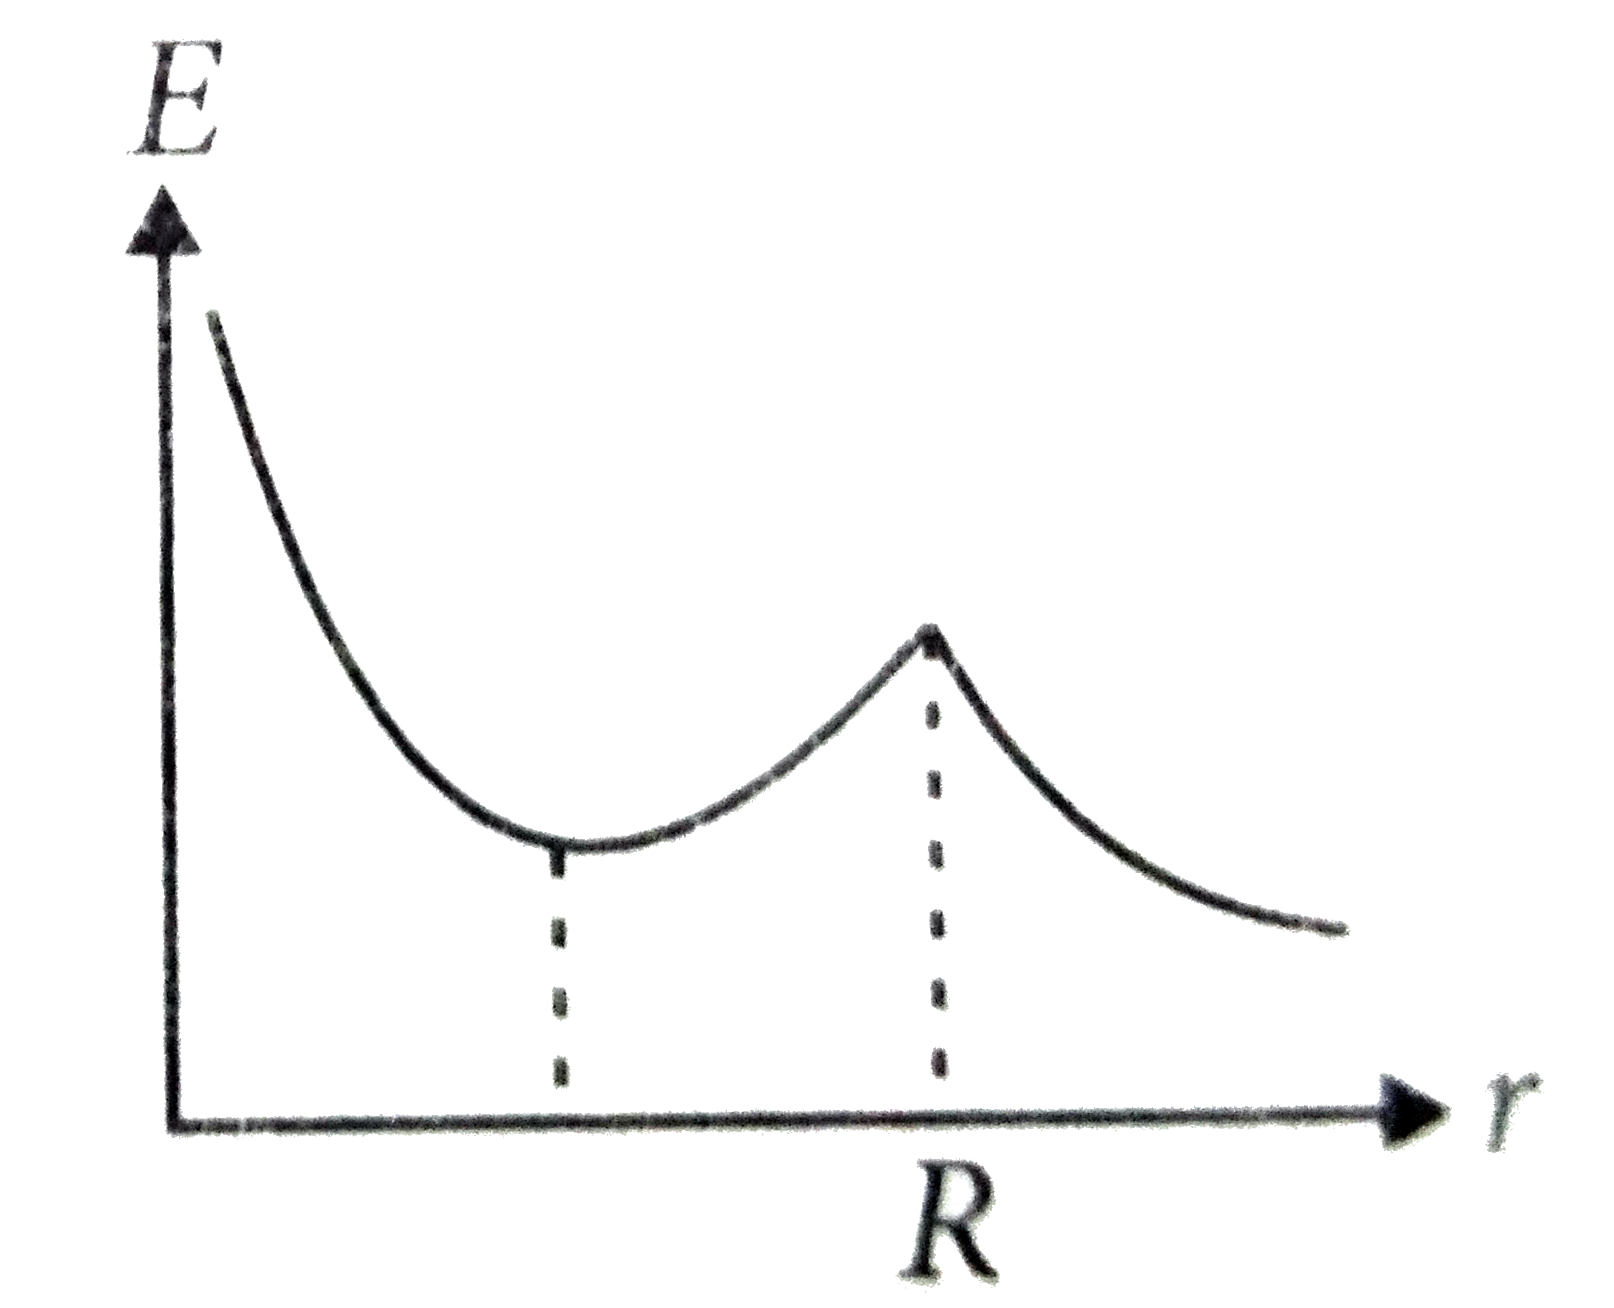 B
B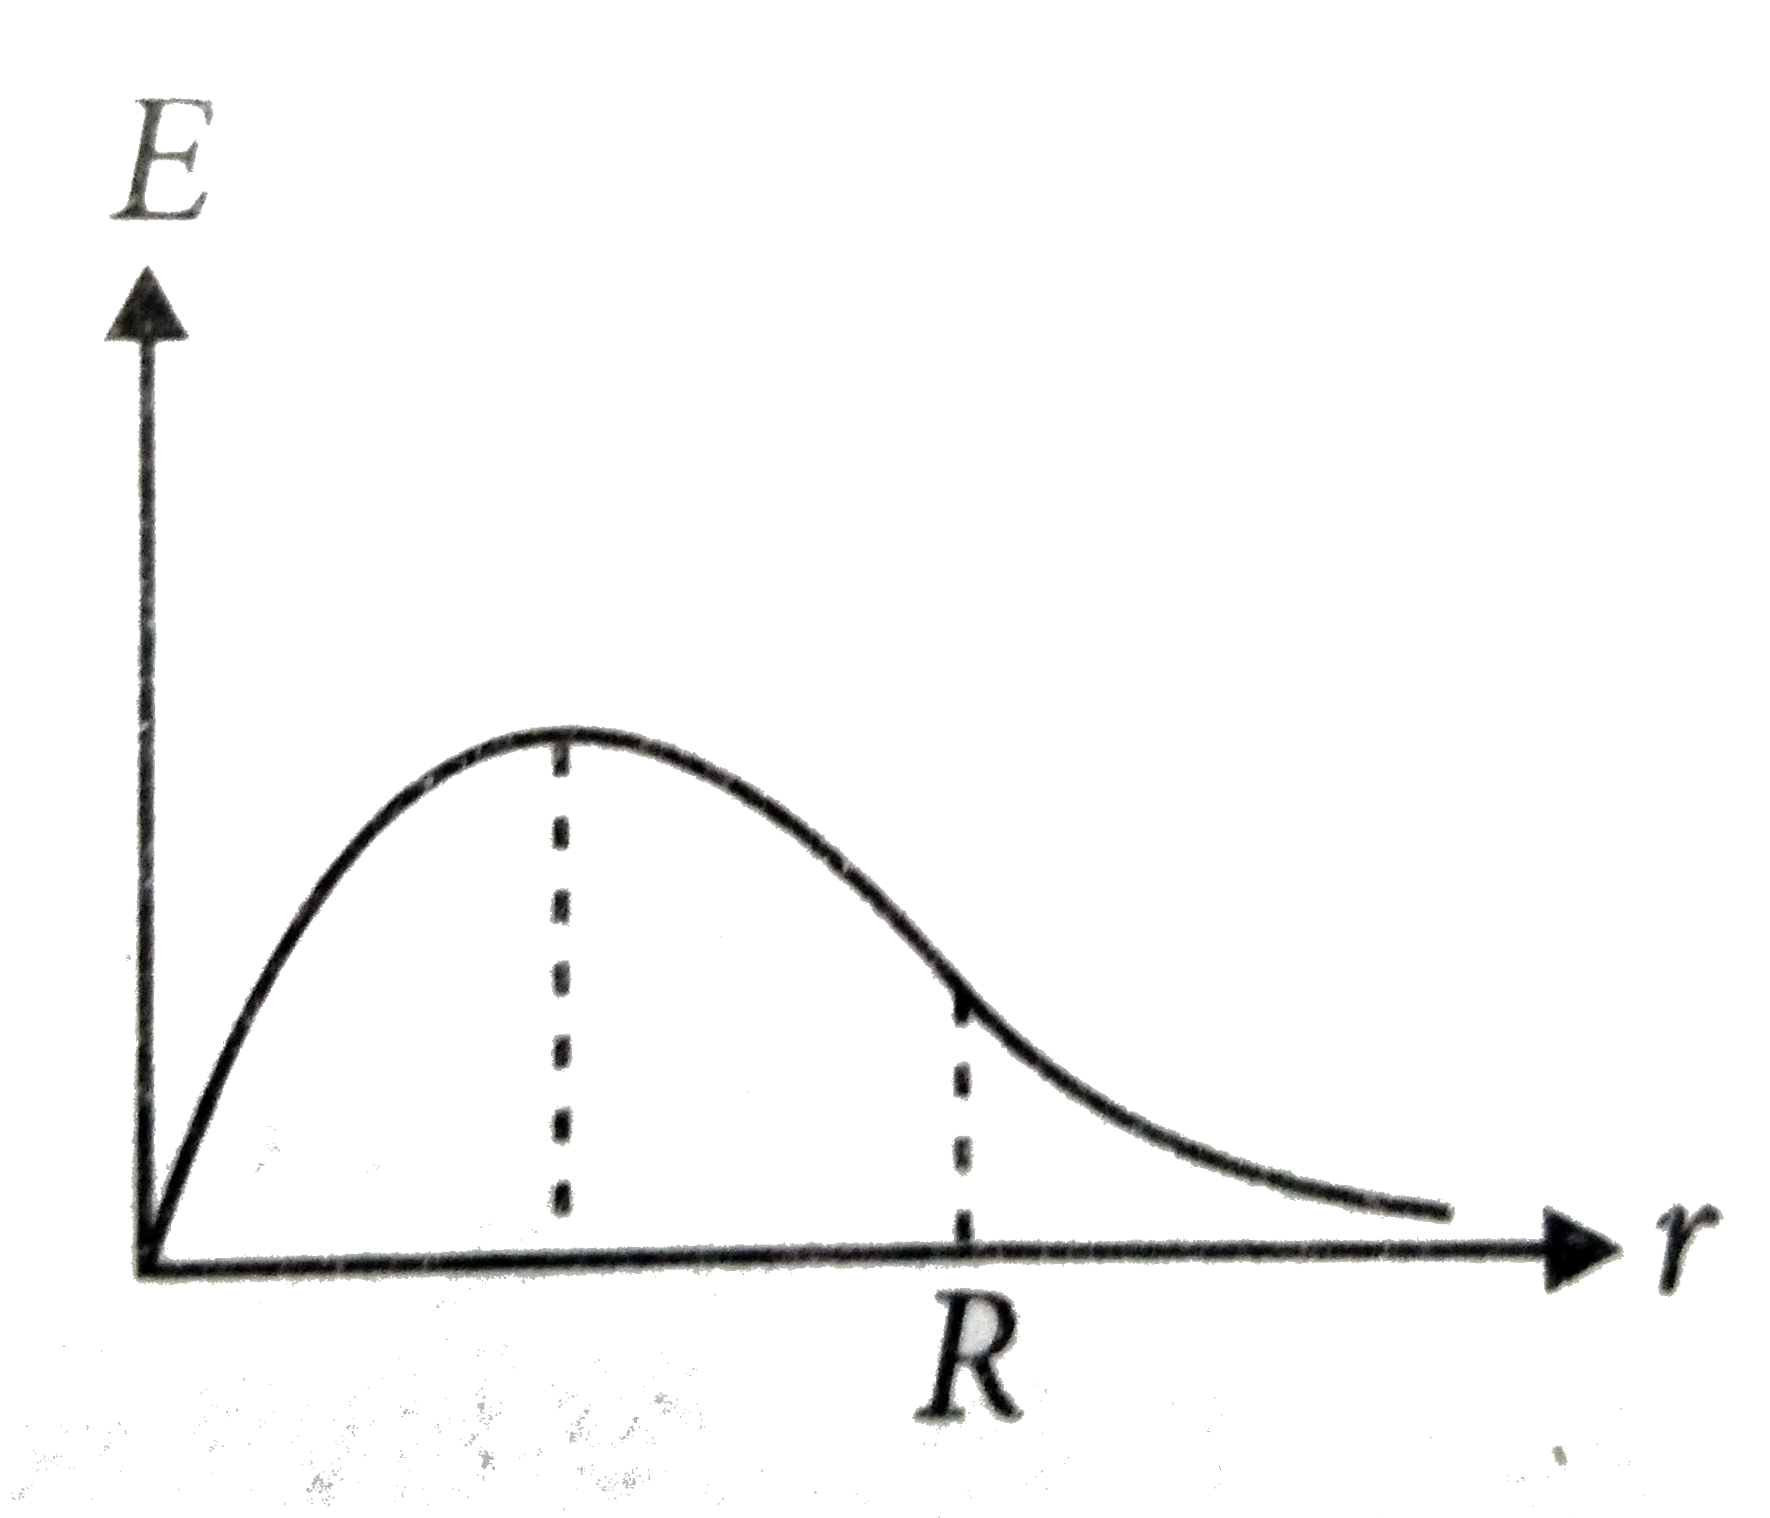 C
C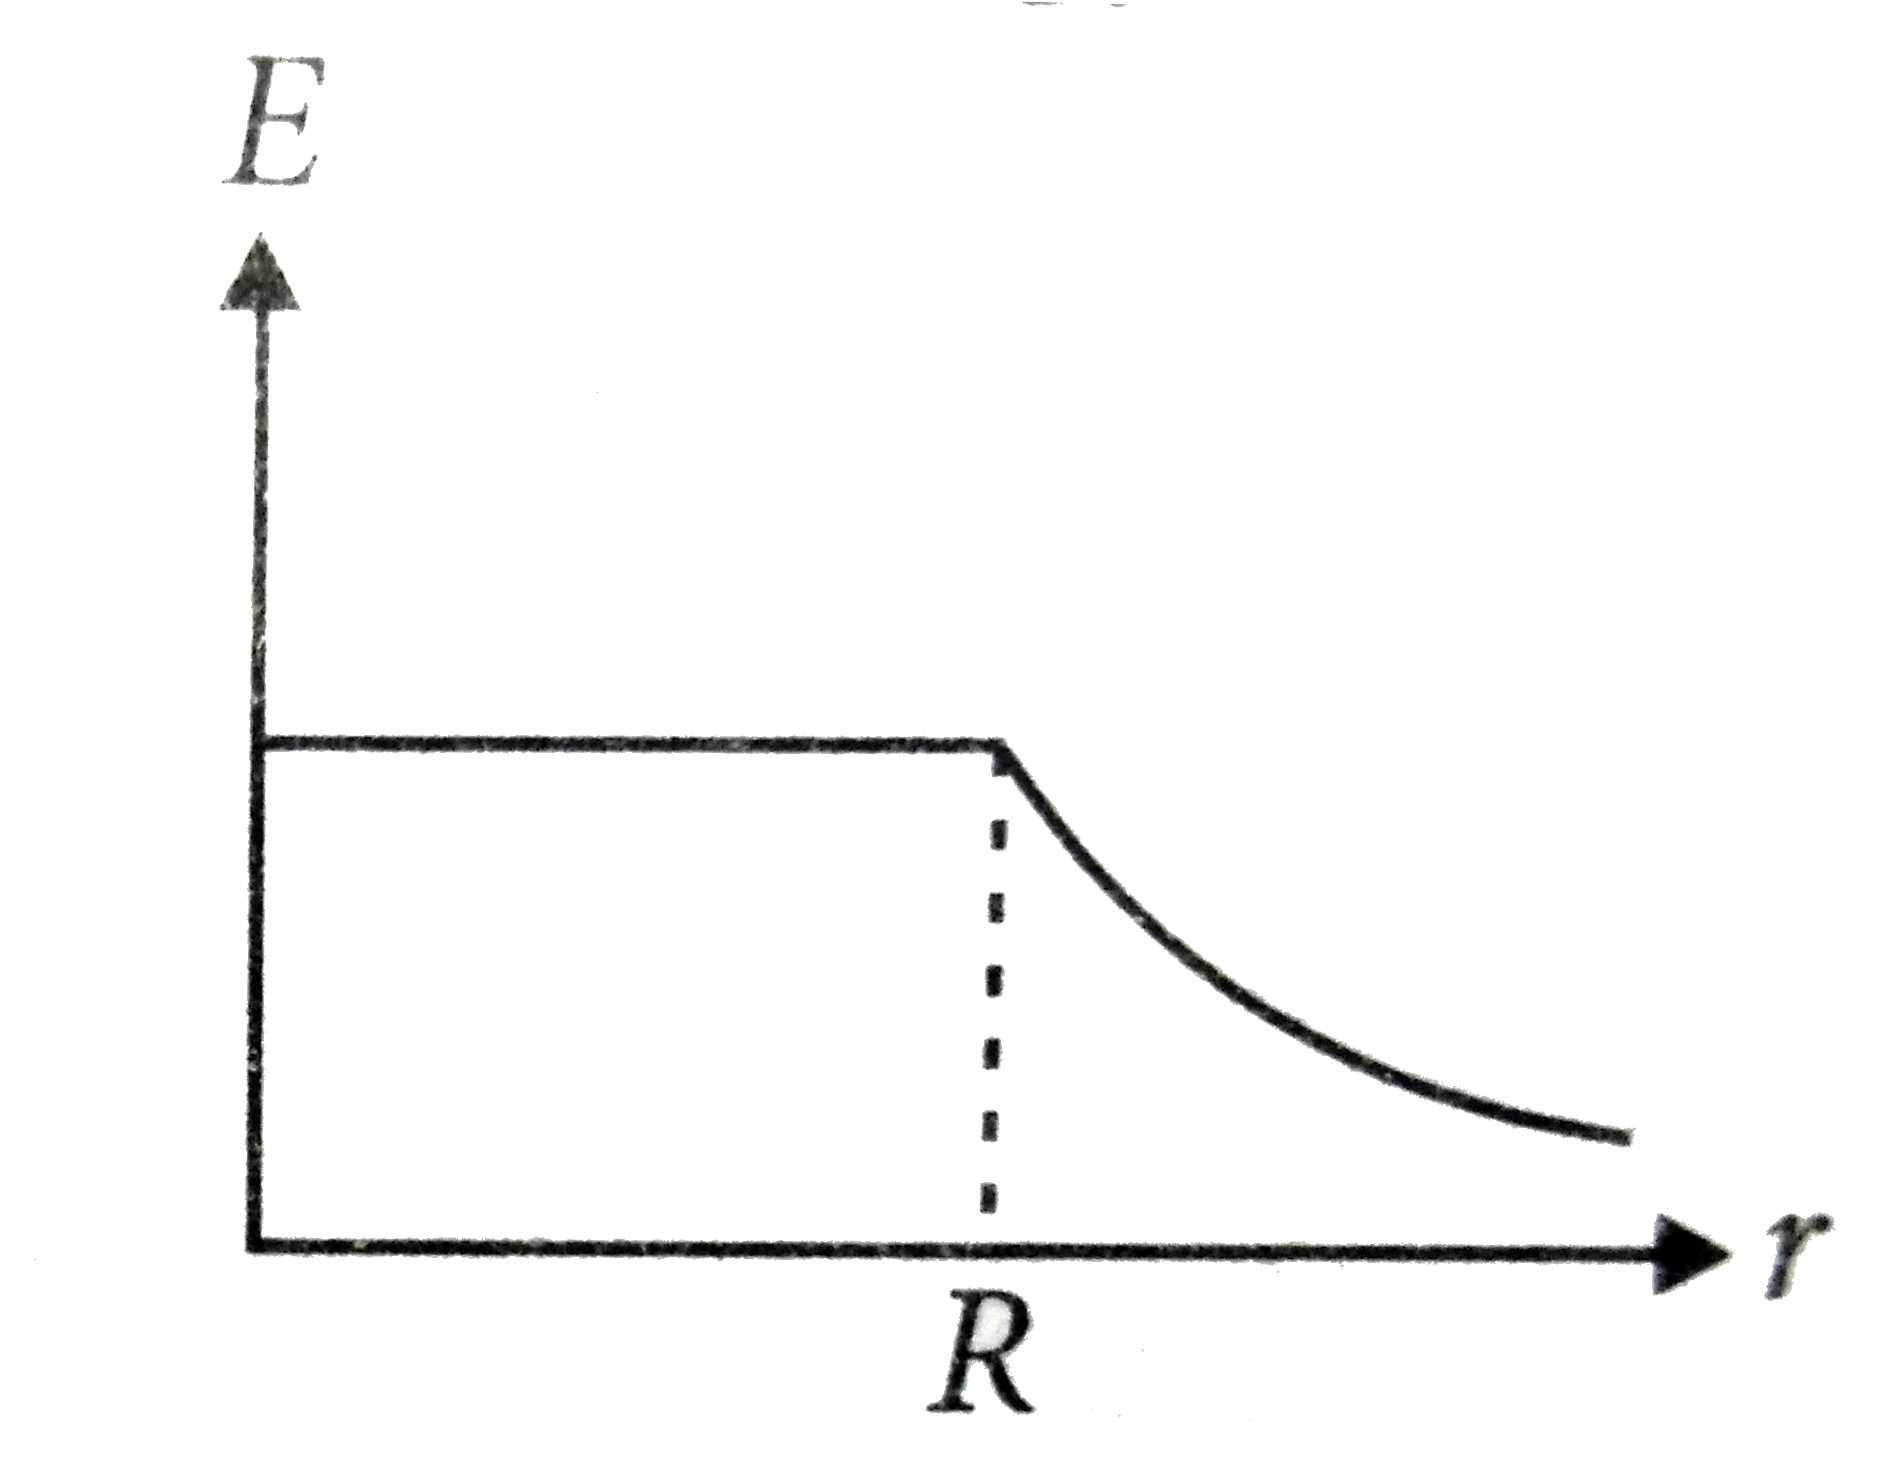 D
D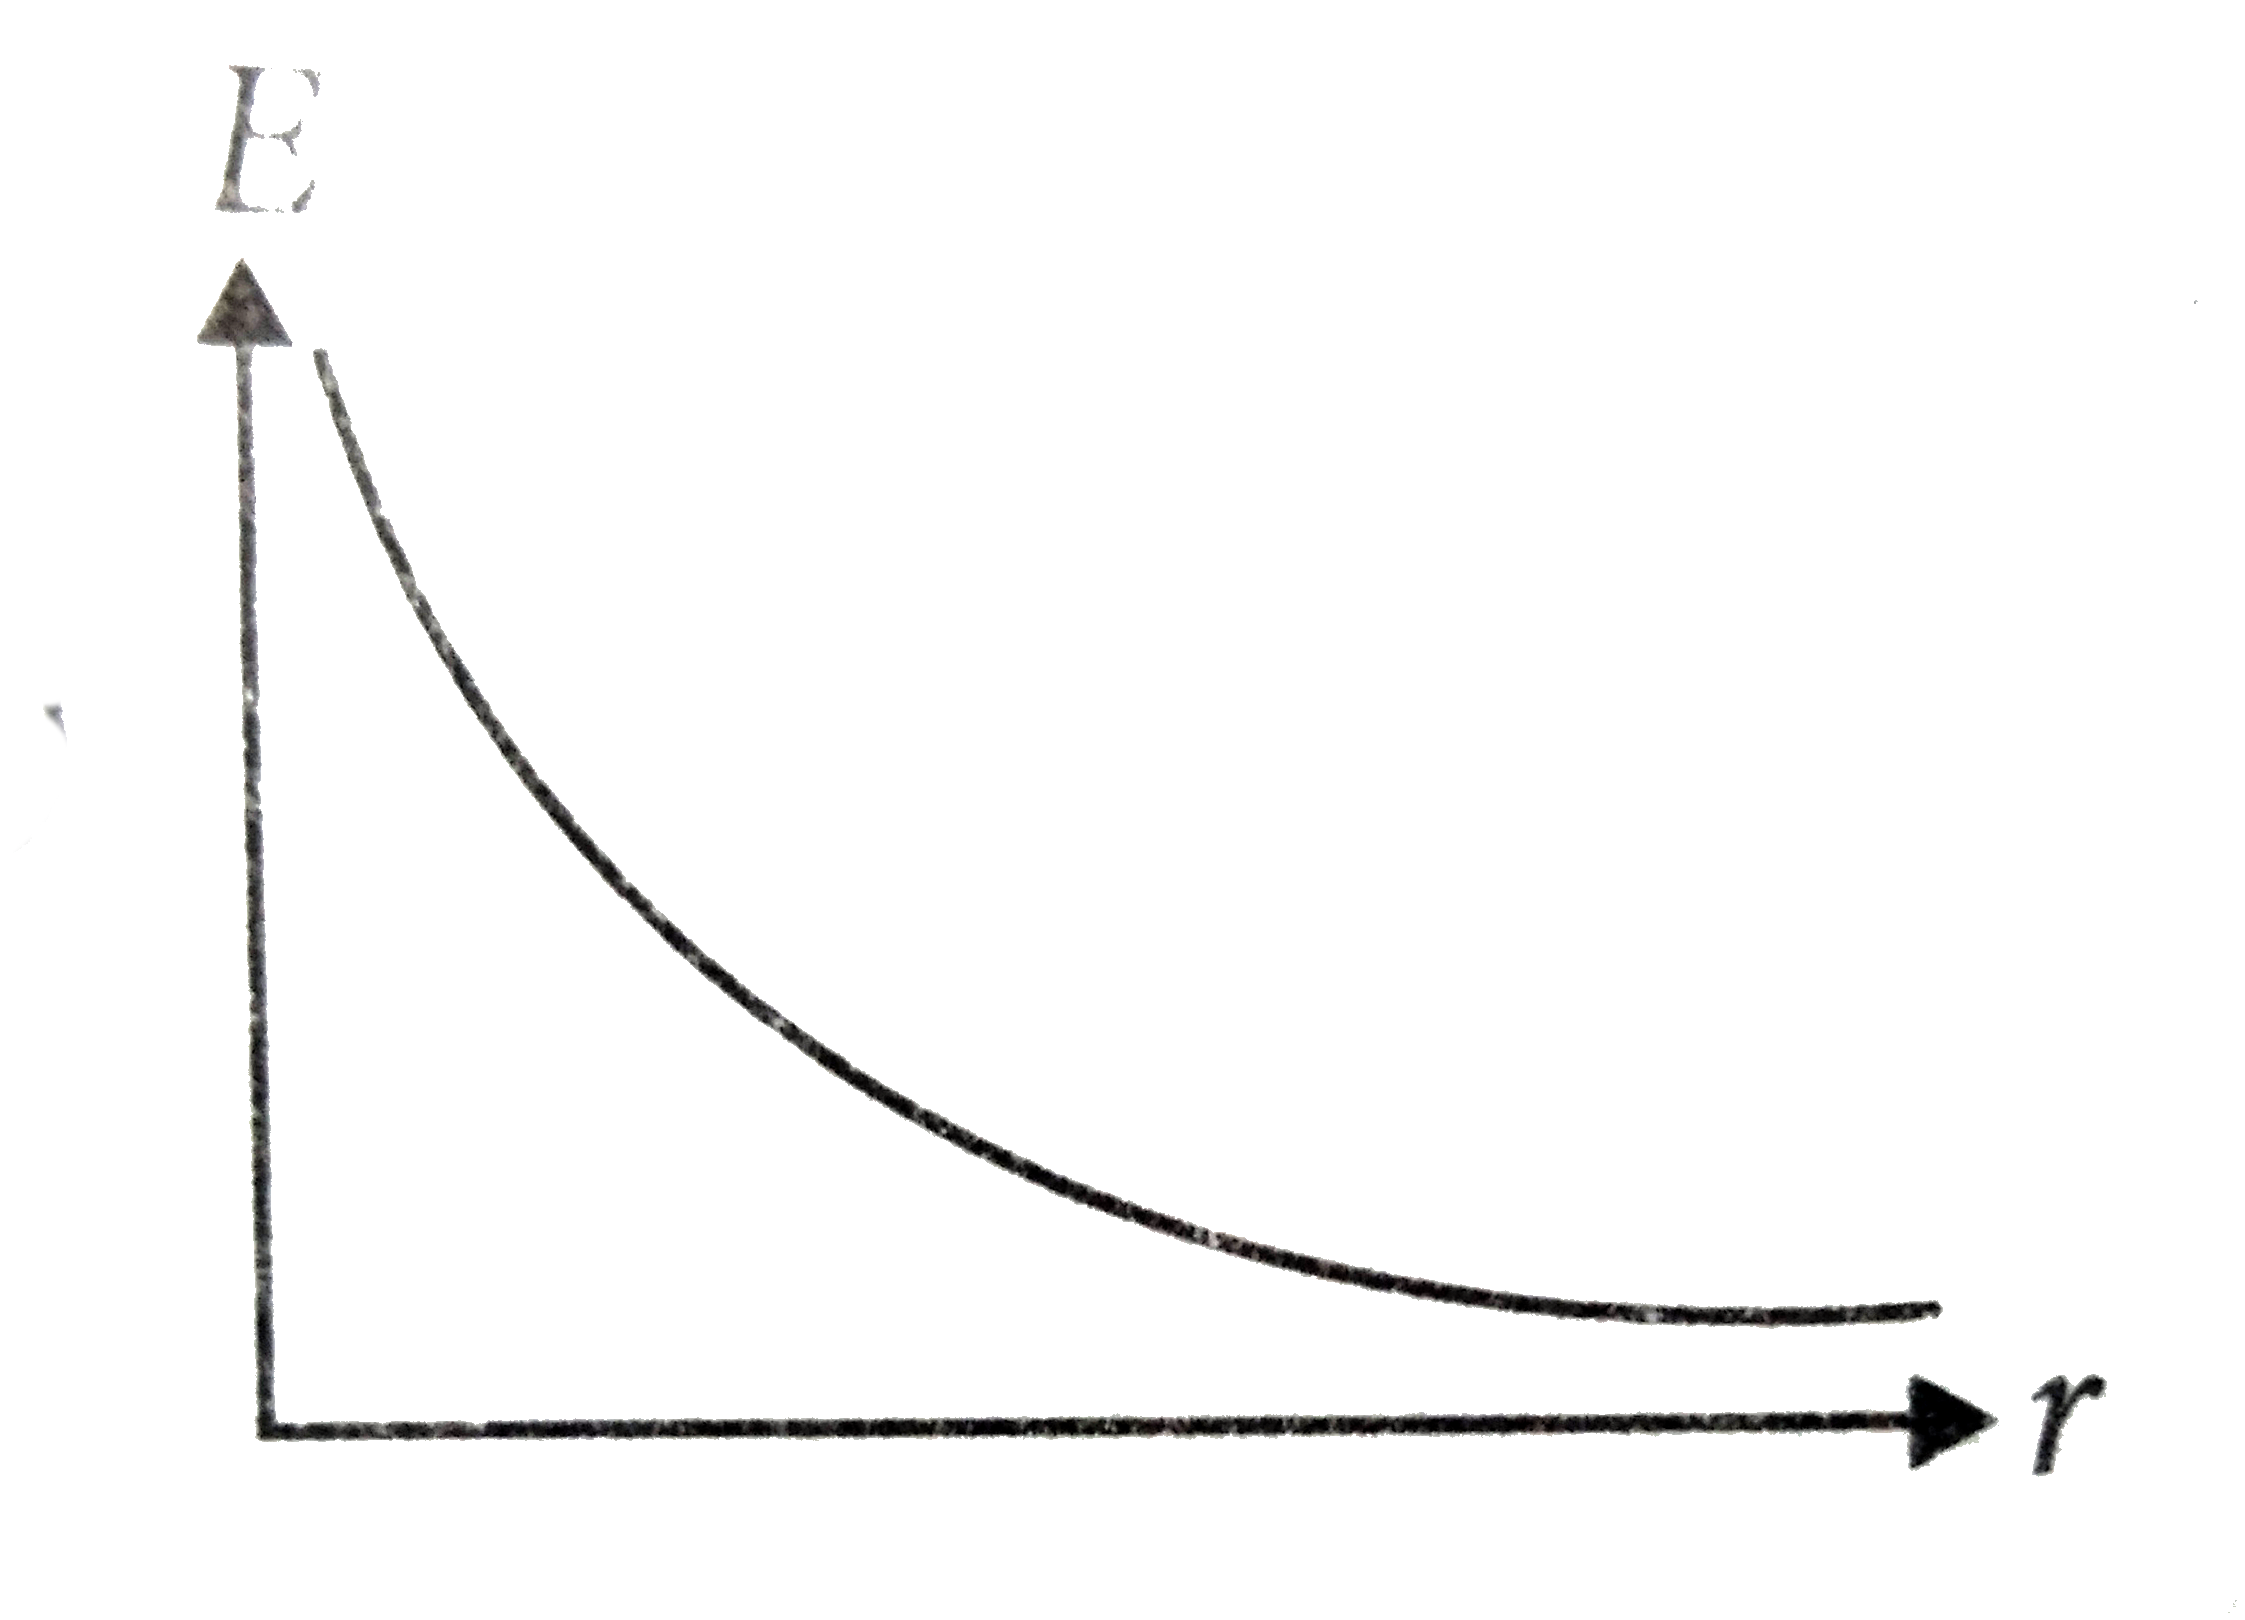
There is a solid sphere of radius R having uniformly distributed charge throughout it. What is the relation between electric field E and distance r from the centre (r is less than R) ?
AE∝r−2BE∝r−1CE∝rDE∝r2
For a uniformly charged non conducting sphere of radius R which of following shows a correct graph between the electric field intensity and the distance from the centre of sphere –
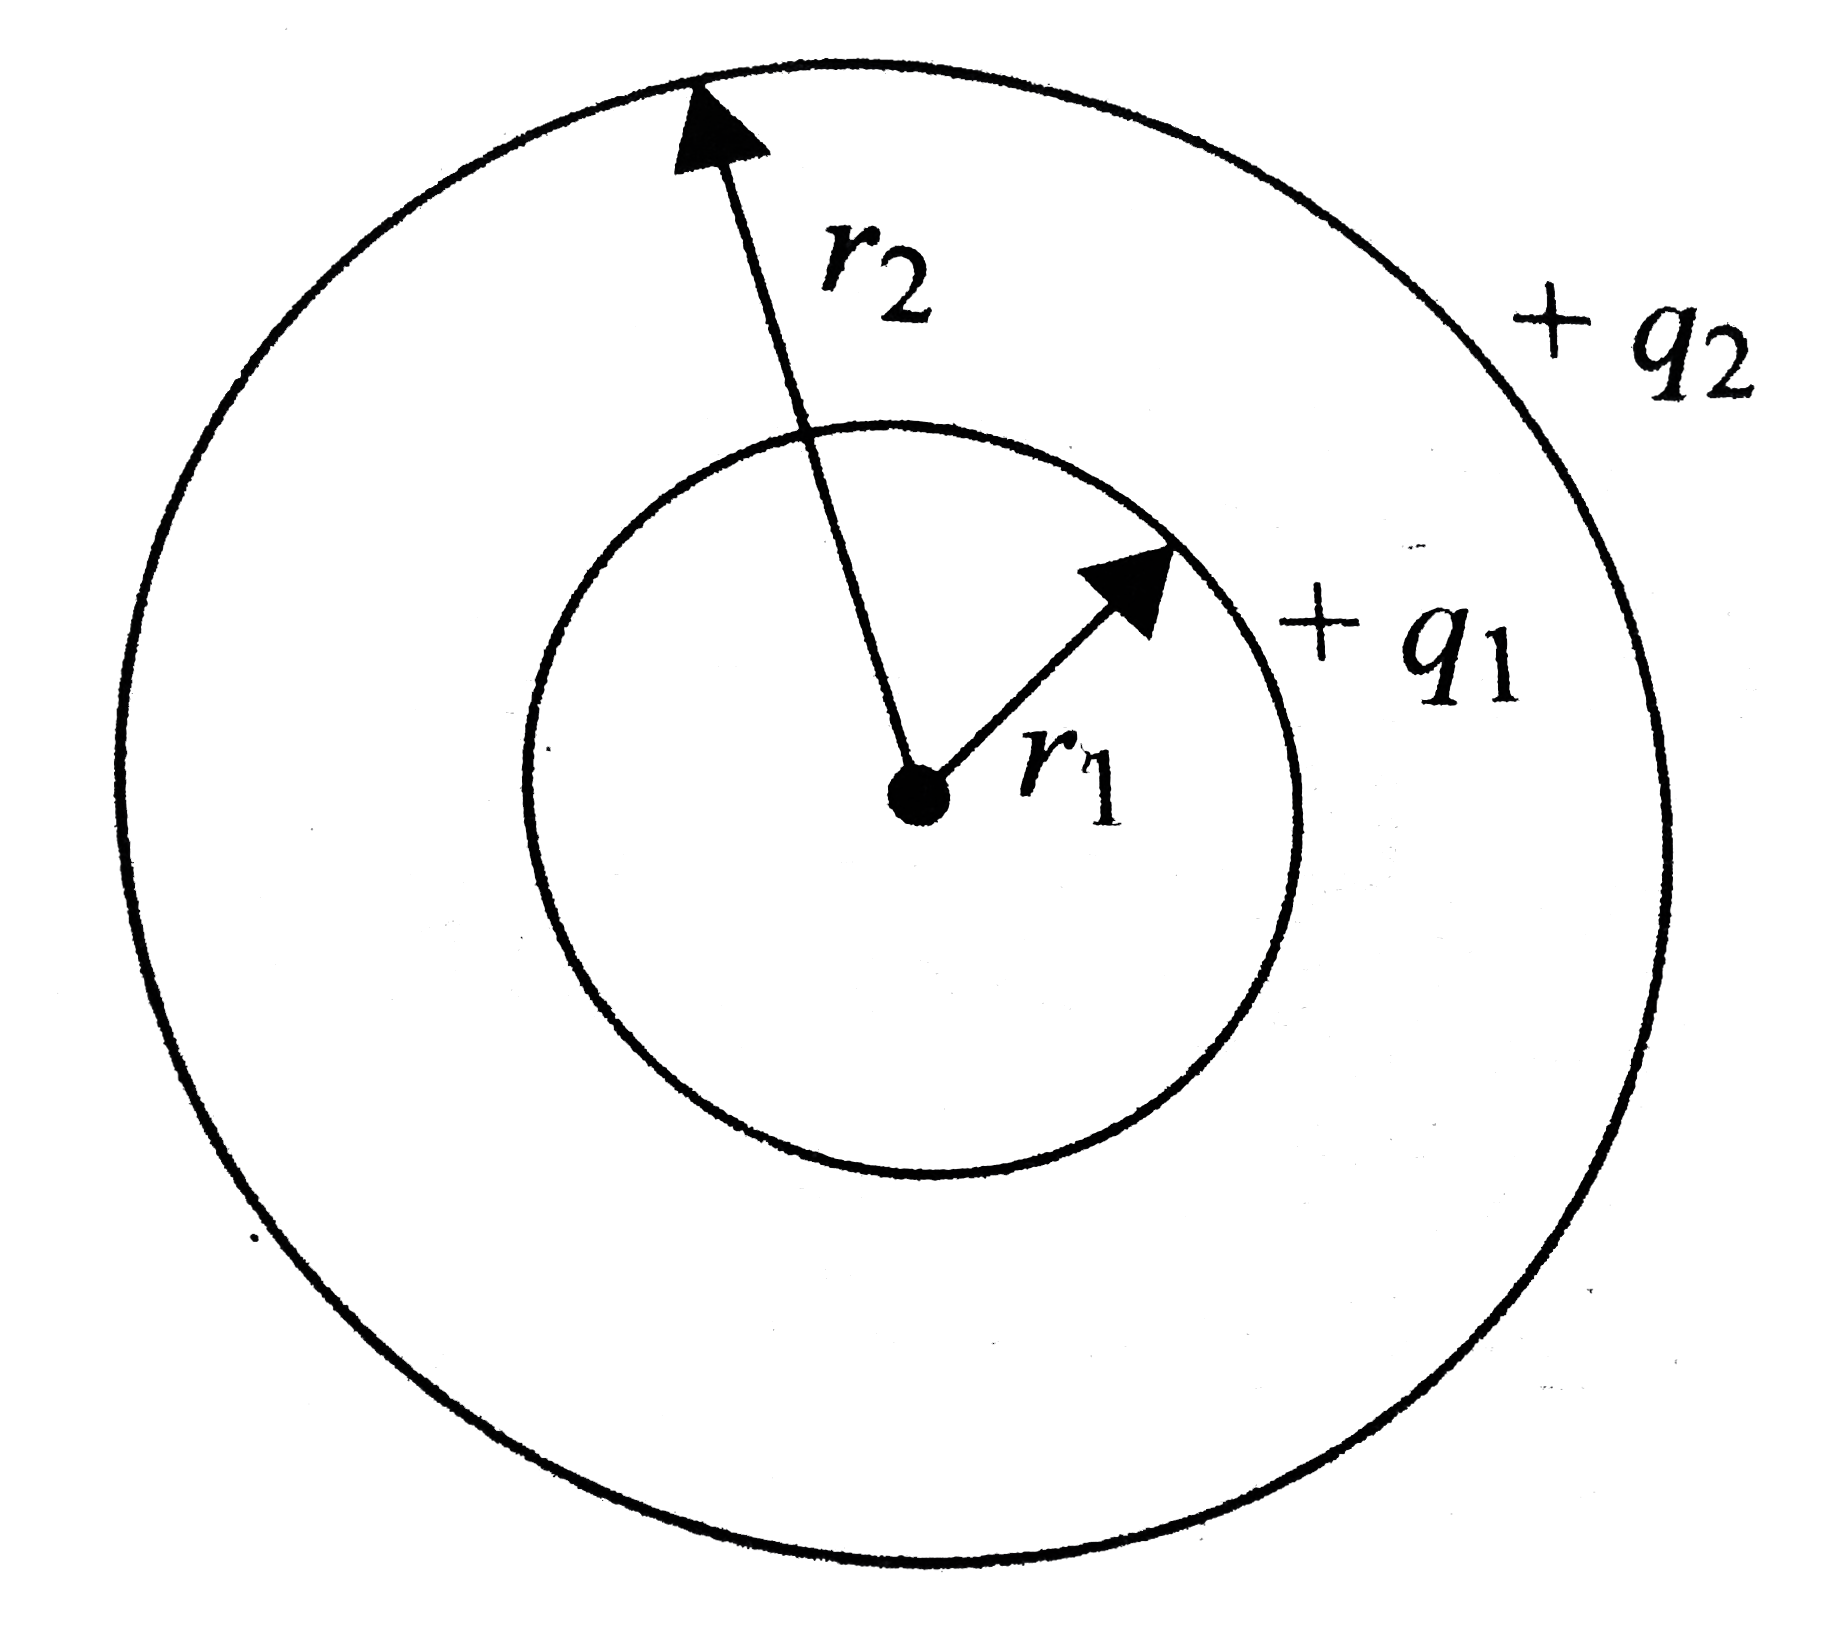
View SolutionFigure shows two concentric conducting shells of radii r1 and r2 carrying uniformly distributed charges q1 and q2, respectively. Find an expression for the potential of each shell.
 .
.
View SolutionA metallic spherical shell of radius R has a charge -Q on it. A point charge +Q is placed at the centre of the shell. Which of the graphs shown below may correctly represent the variation of electric field E with distance r from the centre of shell ?
View SolutionUsing Gauss' law deduce the expression for the electric field due to a uniformly charged sperical conducting shell of radius R at a point (i) outside and (ii) inside the shell.
Plot a graph showing variation of electric field as a function of r>Randr<R. (r being the distance from the centre of the shell)
View SolutionA thin spherical shell of radius R has charge Q spread uniformly over its surface. Which of the following graphs most closely represents the electric field E(r) produced by the shell in the range 0≤r<∞, where r is the distance from the centre of the shell?
View SolutionA thin spherical shell of radius R has charge Q spread uniformly over its surface. Which of the following graphs most closely represents the electric field E(r) produced by the shell in the range 0≤r<∞, where r is the distance from the centre of the shell?
View Solution