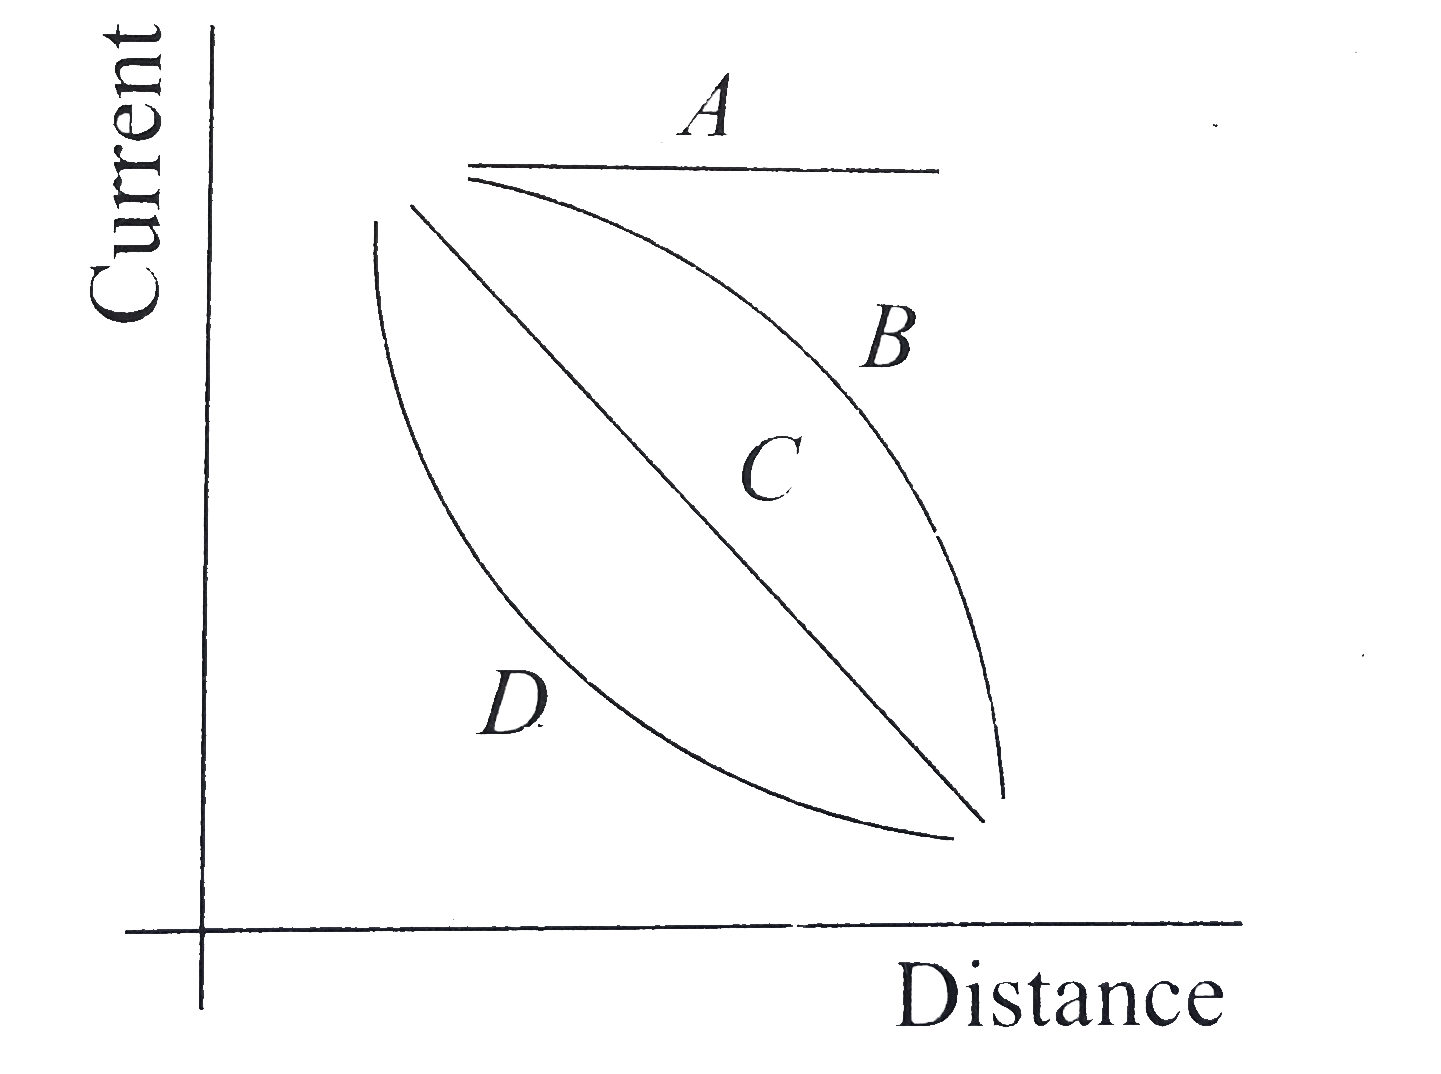
A point source causes photoelectric effect from a small metal plate. Which of the curves in Fig. may represent the saturation photo-current as a function of the distance between the source and the metal?
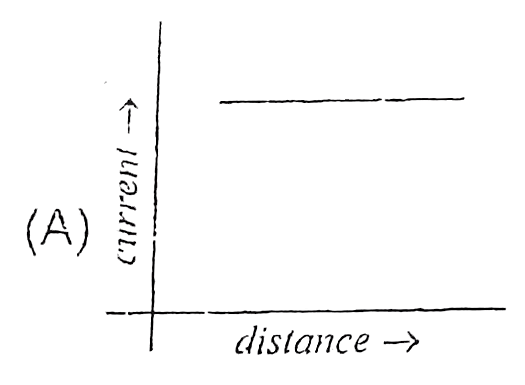
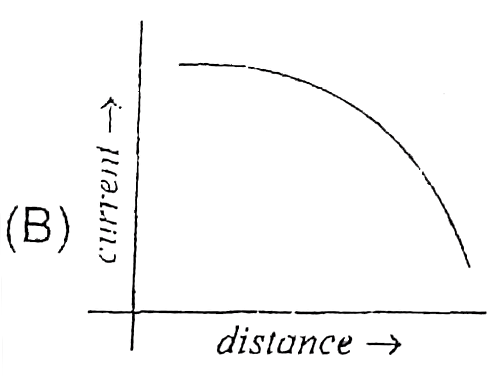
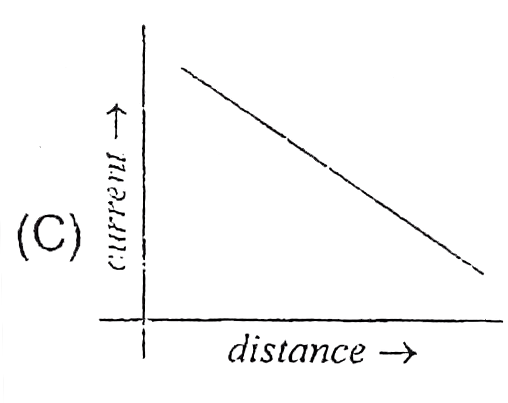
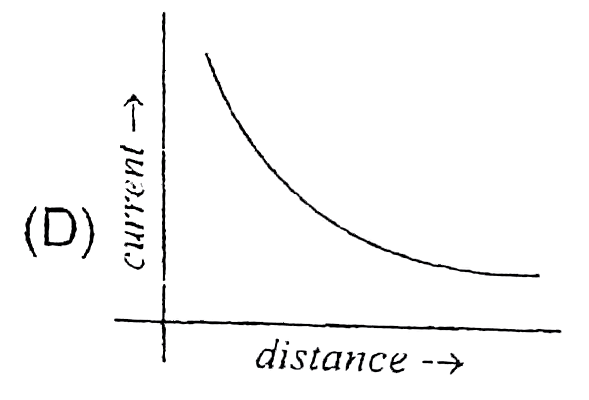
The correct Answer is:D
Step by step video & image solution for A point source causes photoelectric effect from a small metal plate. Which of the curves in Fig. may represent the saturation photo-current as a function of the distance between the source and the metal? by Physics experts to help you in doubts & scoring excellent marks in Class 12 exams.
Updated on:21/07/2023Topper's Solved these Questions
- ATOMIC PHYSICSBOOK - RESONANCE ENGLISHCHAPTER - ATOMIC PHYSICSEXERCISE - Exercise-2 part-II Single and double value integer type
12 Videos
- ATOMIC PHYSICSBOOK - RESONANCE ENGLISHCHAPTER - ATOMIC PHYSICSEXERCISE - Exercise-2 part-III one or more than one options correct type
14 Videos
- ATOMIC PHYSICSBOOK - RESONANCE ENGLISHCHAPTER - ATOMIC PHYSICSEXERCISE - Exercise ( Part II : Only one one correct type)
37 Videos
- ALTERNATING CURRENTBOOK - RESONANCE ENGLISHCHAPTER - ALTERNATING CURRENTEXERCISE - HIGH LEVEL PROBLEMS
11 Videos
- CAPACITANCEBOOK - RESONANCE ENGLISHCHAPTER - CAPACITANCEEXERCISE - High Level Problems
16 Videos
Similar Questions
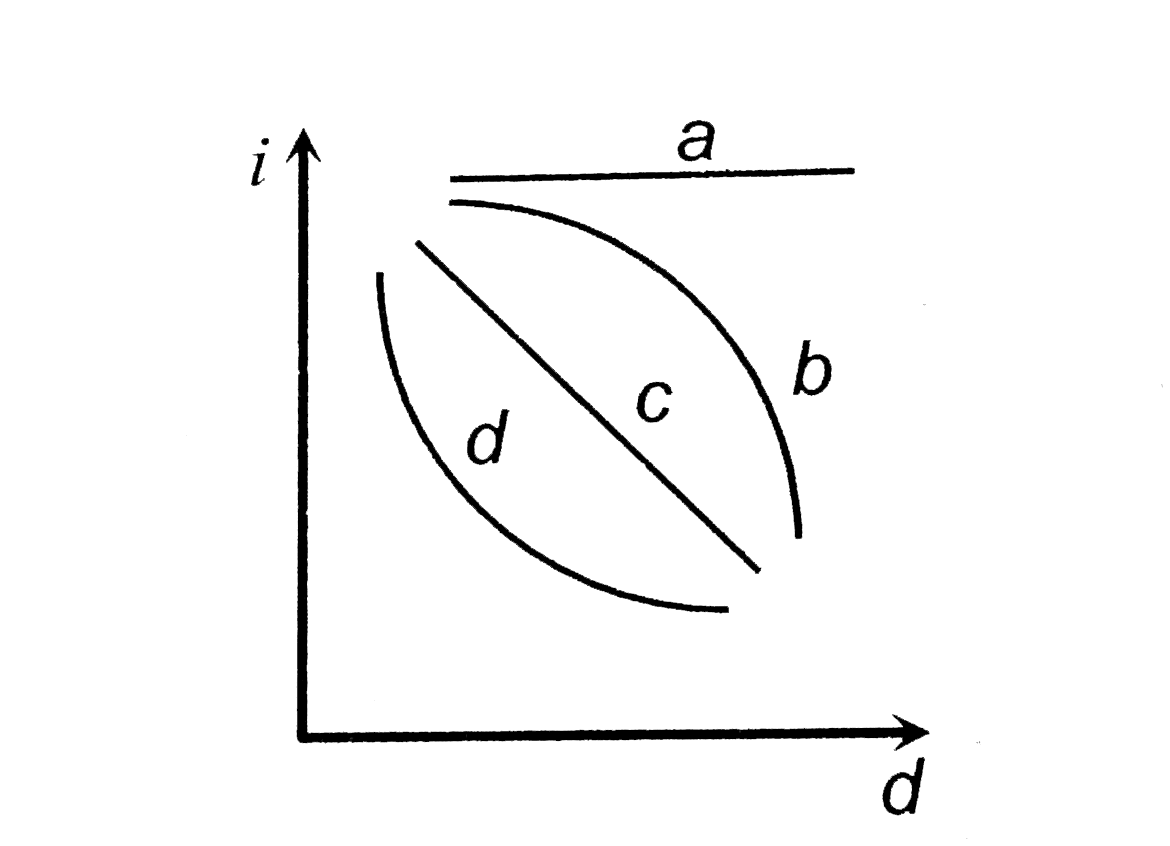
A point source of light is used in an experiment on photoelectric effect . Which of the following curves best represents the variation of photo current (i) with distance (d) of the source from the emitter ?
View SolutionA point source is situated at a distance x<f from the pole of the concave mirror of focal length f. At time t=0 the point source starts moving away from the mirror with constant velocity. Which of the graphs below represents best, variation of image distance |v| with distance x between the pole of mirror and the source.
View SolutionA point source of light is used in a photoelectric effect. If the source is moved farther from the emitted metal, the stopping potential
View SolutionThe anode plate in an experiment on photoelectric effect is kept vertically above the cathode plate. Light source is put on and a saturation photocurrent is recorded. An electric field is switched on which has vertically downward direction
View SolutionFig. shows the variation of stopping potential V0 with the frequency v of the incident radiation for two photosensitive metal P and Q:
(i) Explain which metal has smaller threshold wavelength
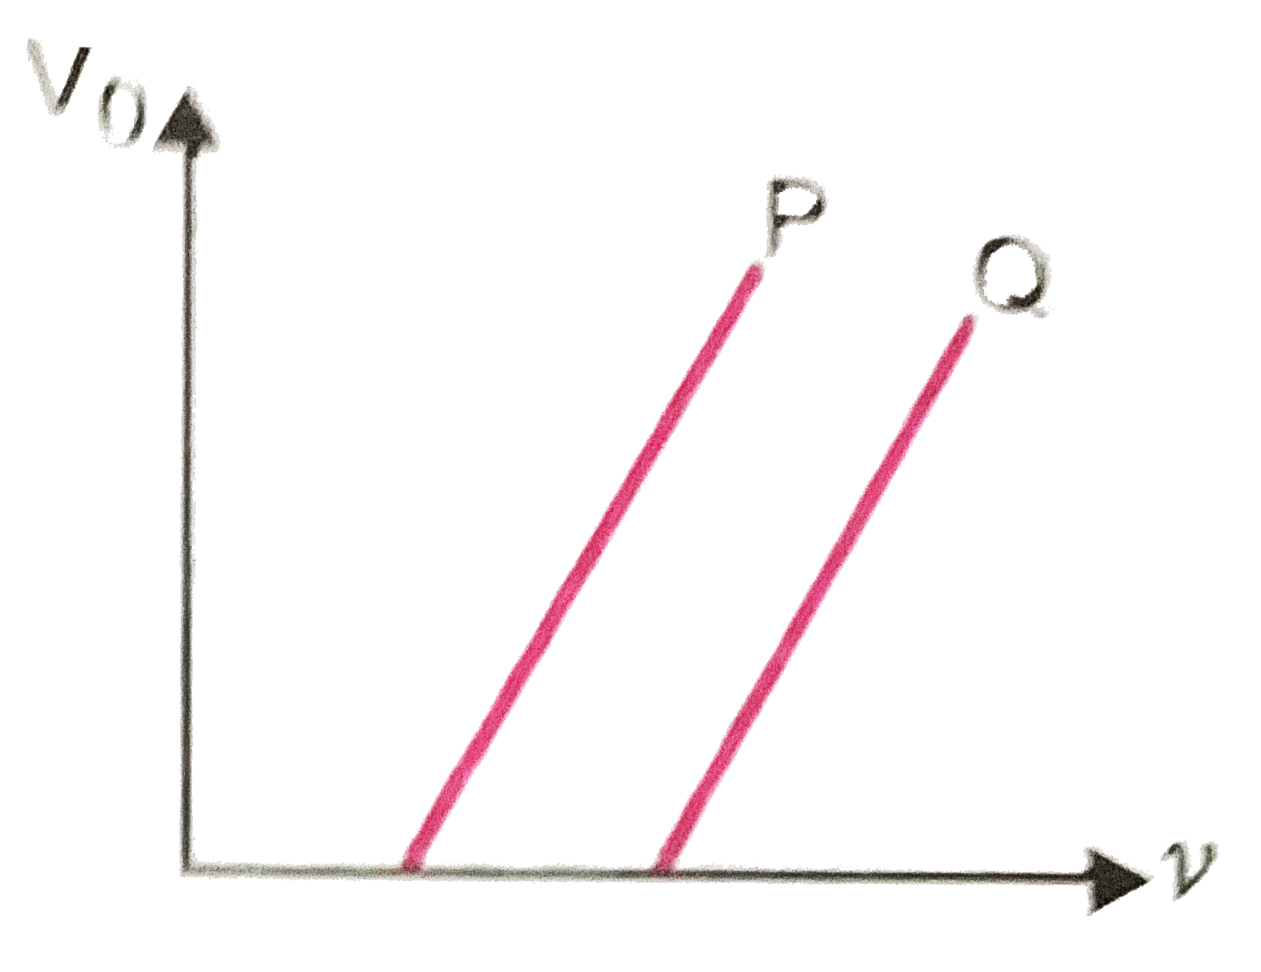
(ii) Explain, giving reason, which metal emits photoelectrons having smaller kinetic energy, for the same wavelength of incident radiation.
(iii) If the distance between the light source and metal P is doubled, how will the stopping potential change.
View SolutionWhich of the graphs shown below does not represent the relationship between incident light and the electron ejected from metal surface ?
View SolutionWhich of the graphs shown below does not represent the relationship between incident light and the electron ejected from metal surface?
View SolutionWhich of the graphs shown below does not represent the relationship between incident light and the electron ejected from metal surface?
View SolutionIn an experiment on the photoelectric effect, an evecuated photocell with a pure metal cothode is used. Which graph best represents the variation of B, the minimum potential defference needed to prevent current from flowing, when x, the frequency of the incident light, is varied?
View SolutionA soure of sound of frequency 165 hz is placed in front of a wall at a distance 2 m from it. A dtector is also placed in front of the wall at the same distance from it. Find the minimum distance between the source and detector for which maximum sound is recorded int he detector . the speed of sound is 330 m/s
View Solution
