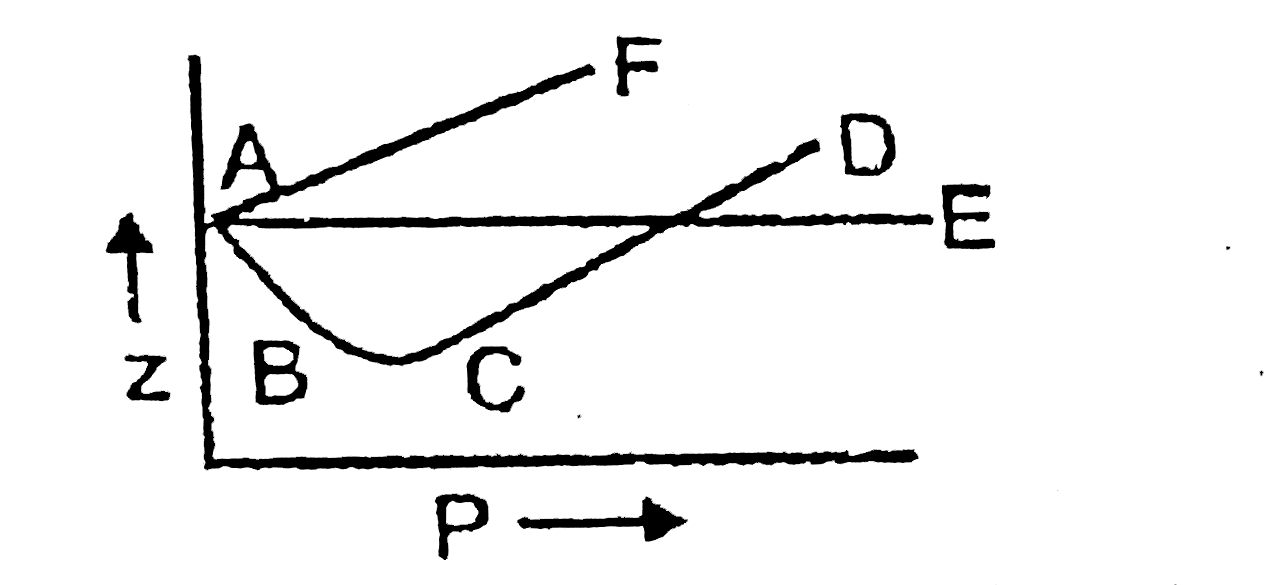
The figure shows the effect of pressure on the compressibility factor, Z of a gas The wrong conclusions(s) is (are) :

A
The curve AE can be explained by PV=RT
B
The curve AF and CD can be explained by PV=RT+Pb
C
The curve AB can be explained by PV=RT-
D
All the three curves AF,AE and AD shows the real behaviour
Video Solution
Text Solution
The correct Answer is:D
(A)For AE, Z = constant
(B)At higher pressure PV=RT+Pb
( C)At lower pressure
|
Updated on:21/07/2023
Topper's Solved these Questions
Similar Questions
Knowledge Check
- Question 1 - Select One
At Boyle's temperature , compressibility factor Z for a real gas is
A1B0C>1D<1
The compressibility factor for an ideal gas is
View SolutionThe compressibility factor for an ideal gas is
View SolutionThe compressibility factor Z for the gas is given by
View SolutionThe compressibility factor for a real gas at high pressure is .
View SolutionThe compressibility factor for a real gas at high pressure is .
View SolutionThe compressibility factor for a real gas at high pressure is .
View SolutionCompressibility factor for H2 behaving as real gas is
View Solution
