When a sample of ideal gas is changed from an initial state to a final state, various curves can be plotted for the process like P-V curve, V-T curve,P-T curve etc.
For example, P-V curve for a fixed amount of an ideal gas at constant temperature is a rectangular hyperbola, V-T curve for a fixed amount of an ideal gas at constant volume is again a straight line. However, the shapes may vary if the constant parameters are also changed.
Now, answer the following questions :
Two moles of an ideal gas is changed from its initial state (16 atm, 6L) to final state (4 atm, 15L) in such a way that this change can be represented by a straight line in P-V curve.The maximum temperature attained by the gas during the above change is :(Take : R=112LatmK−1mol−1)
324 K
589.3 K
1296 K
972 K
The correct Answer is:B
To solve the problem of finding the maximum temperature attained by the ideal gas during the transition from the initial state to the final state, we can follow these steps:
1. Identify the Initial and Final States:
- Initial state: P1=16atm,V1=6L
- Final state: P2=4atm,V2=15L
2. Calculate the Work Done:
- Since the process is represented by a straight line in the P-V curve, we can calculate the area under the curve, which represents the work done.
- The area under the P-V graph forms a trapezium with parallel sides P1 and P2 and height equal to the change in volume (V2−V1).
- Work done W can be calculated using the formula:
W=12×(P1+P2)×(V2−V1)
- Substituting the values:
W=12×(16+4)×(15−6)=12×20×9=90L atm
3. Use the Ideal Gas Equation:
- The work done in an isothermal process can also be expressed as:
W=2.303nRTlog(V2V1)
- Here, n=2moles, R=112L atm K−1mol−1, and we need to calculate T.
4. Calculate the Logarithmic Term:
- Calculate log(V2V1):
log(156)=log(2.5)
- Using a calculator, log(2.5)≈0.39794.
5. Set Up the Equation for Temperature:
- Substitute the known values into the work done equation:
90=2.303×2×112×T×0.39794
6. Solve for Temperature T:
- Rearranging the equation gives:
T=902.303×2×112×0.39794
- Calculate the denominator:
2.303×2×112×0.39794≈0.192
- Therefore,
T≈900.192≈468.75K
7. Final Calculation:
- After recalculating, we find that the maximum temperature attained by the gas during the process is approximately:
T≈589.3K
Conclusion:
The maximum temperature attained by the gas during the above change is approximately 589.3 K.
- Initial state: P1=16atm,V1=6L
- Final state: P2=4atm,V2=15L
- Since the process is represented by a straight line in the P-V curve, we can calculate the area under the curve, which represents the work done.
- The area under the P-V graph forms a trapezium with parallel sides P1 and P2 and height equal to the change in volume (V2−V1).
- Work done W can be calculated using the formula:
W=12×(P1+P2)×(V2−V1)
- Substituting the values:
W=12×(16+4)×(15−6)=12×20×9=90L atm
- The work done in an isothermal process can also be expressed as:
W=2.303nRTlog(V2V1)
- Here, n=2moles, R=112L atm K−1mol−1, and we need to calculate T.
- Calculate log(V2V1):
log(156)=log(2.5)
- Using a calculator, log(2.5)≈0.39794.
- Substitute the known values into the work done equation:
90=2.303×2×112×T×0.39794
- Rearranging the equation gives:
T=902.303×2×112×0.39794
- Calculate the denominator:
2.303×2×112×0.39794≈0.192
- Therefore,
T≈900.192≈468.75K
- After recalculating, we find that the maximum temperature attained by the gas during the process is approximately:
T≈589.3K
The maximum temperature attained by the gas during the above change is approximately 589.3 K.
Topper's Solved these Questions
Similar Questions
When a sample of ideal gas is changed from an initial state to a final state, various curves can be plotted for the process like P-V curve, V-T curve,P-T curve etc.
For example, P-V curve for a fixed amount of an ideal gas at constant temperature is a rectangular hyperbola, V-T curve for a fixed amount of an ideal gas at constant volume is again a straight line. However, the shapes may vary if the constant parameters are also changed.
Now, answer the following questions :
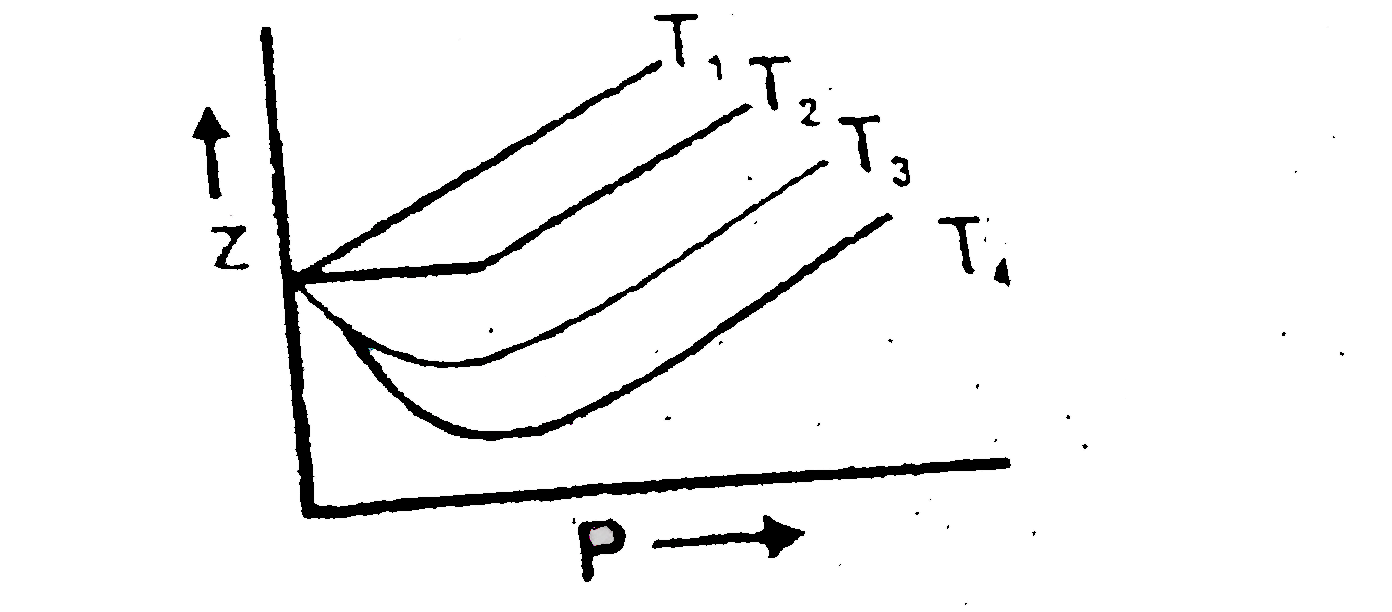
From the given plot between Z and P for a real gas the correct is :
 View Solution
When a sample of ideal gas is changed from an initial state to a final state, various curves can be plotted for the process like P-V curve, V-T curve,P-T curve etc.
For example, P-V curve for a fixed amount of an ideal gas at constant temperature is a rectangular hyperbola, V-T curve for a fixed amount of an ideal gas at constant volume is again a straight line. However, the shapes may vary if the constant parameters are also changed.
Now, answer the following questions :
Which of the following graphs is not possible for a fixed amount of ideal gas upon moving from initial state A to final state B :View SolutionWhen a sample of ideal gas is changed from an initial state to a final state, various curves can be plotted for the process like P-V curve, V-T curve,P-T curve etc.
For example, P-V curve for a fixed amount of an ideal gas at constant temperature is a rectangular hyperbola, V-T curve for a fixed amount of an ideal gas at constant volume is again a straight line. However, the shapes may vary if the constant parameters are also changed.
Now, answer the following questions :
Two Vander waals gases have same value 'b' but different 'a' value then which of the following statement is correct under simialr condition .View Solution1mol of a gas is changed from its initial state (15L,2atm) to final state (4L,10atm). If this change can be represented by a straight line in P−V curve, calculate the maximum temperature that, the gas attained.
 View Solution
One mole of a gas changed from its initial state (15L,2 atm) to final state (4L,10 atm) reversibly. If this change can be represented by a straight line in P - V curve maximum temperature (approximate), the gas attained is x×102K. Then find the value of x.
View SolutionWhich of the following curve is correct for an ideal gas ?
View SolutionWhich of the following curve is correct for a given amount of an ideal gas at constant pressure?
View SolutionWhat is the shape of the curve obtained on plotting P against PV at constant temperature for an ideal gas ?
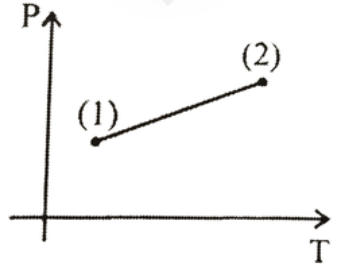
View SolutionFigure shows a process for a given amount of an ideal gas. If volume in state 1 is V1 & in state 2 is V2, then
 View Solution
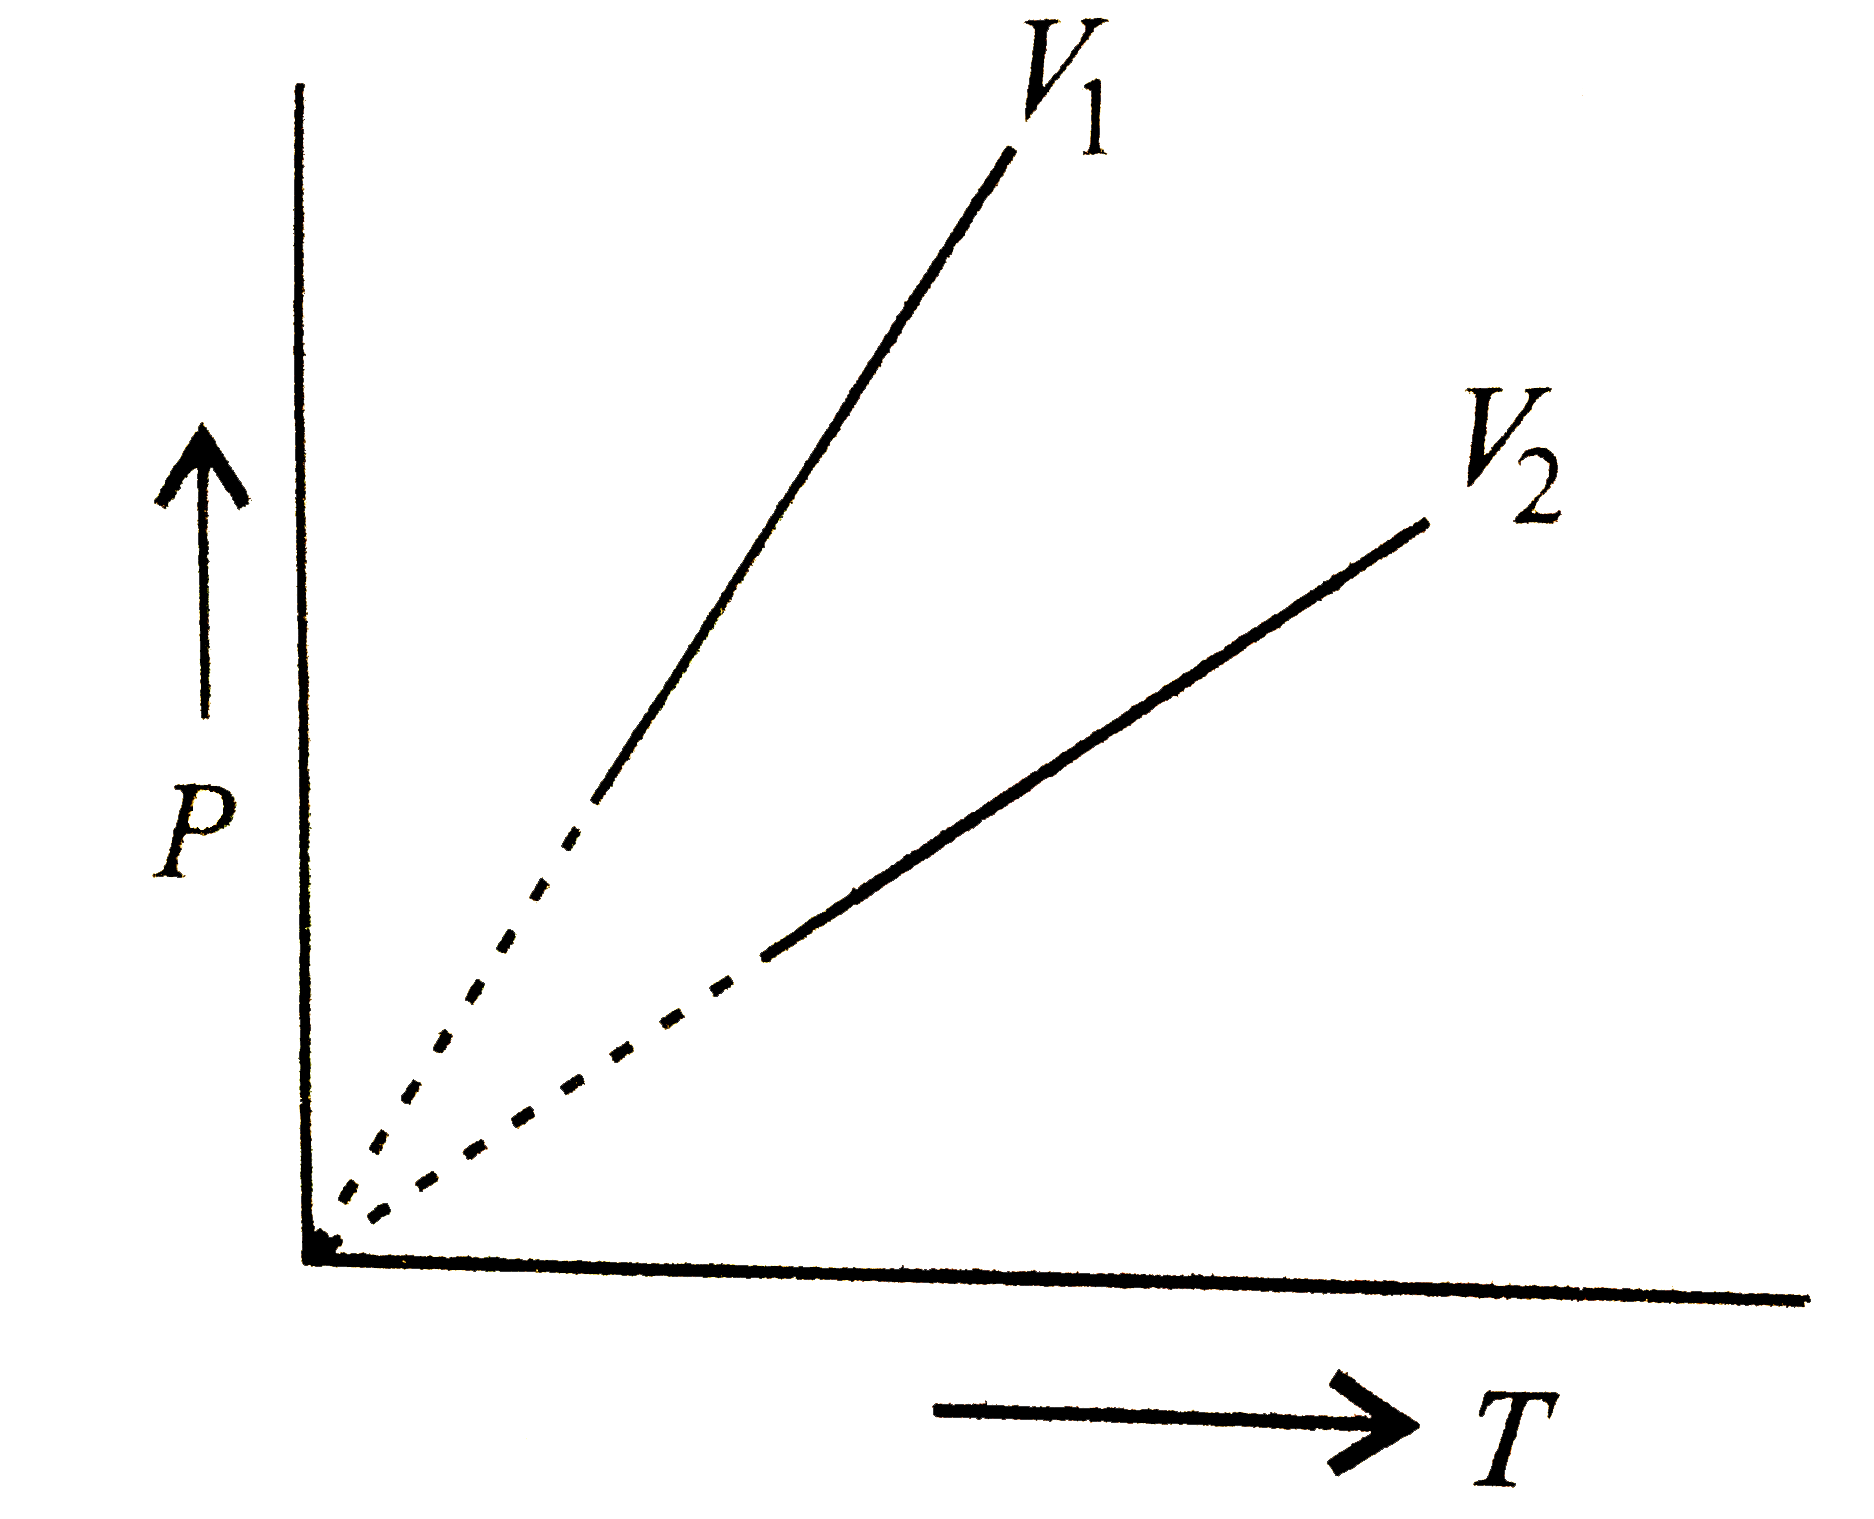
A plot of P vs T for a given mass of gas at constant volume is a straight line . P vs T at constant volumes V1 and V2 for an ideal gas are shown below :
Which of the following is correct ?
 View Solution

