A coaxial cable made up of two conductors. The inner conductor is solid and is of radius R1 and the outer conductor is hollow of inner radius R2 and outer radius R3. The space between the conductors is filled with air. The inner and outer conductors are carrying currents of equal magnitudes and in opposite directions. Then the variation of magnetic field with distance from the axis is best plotted as
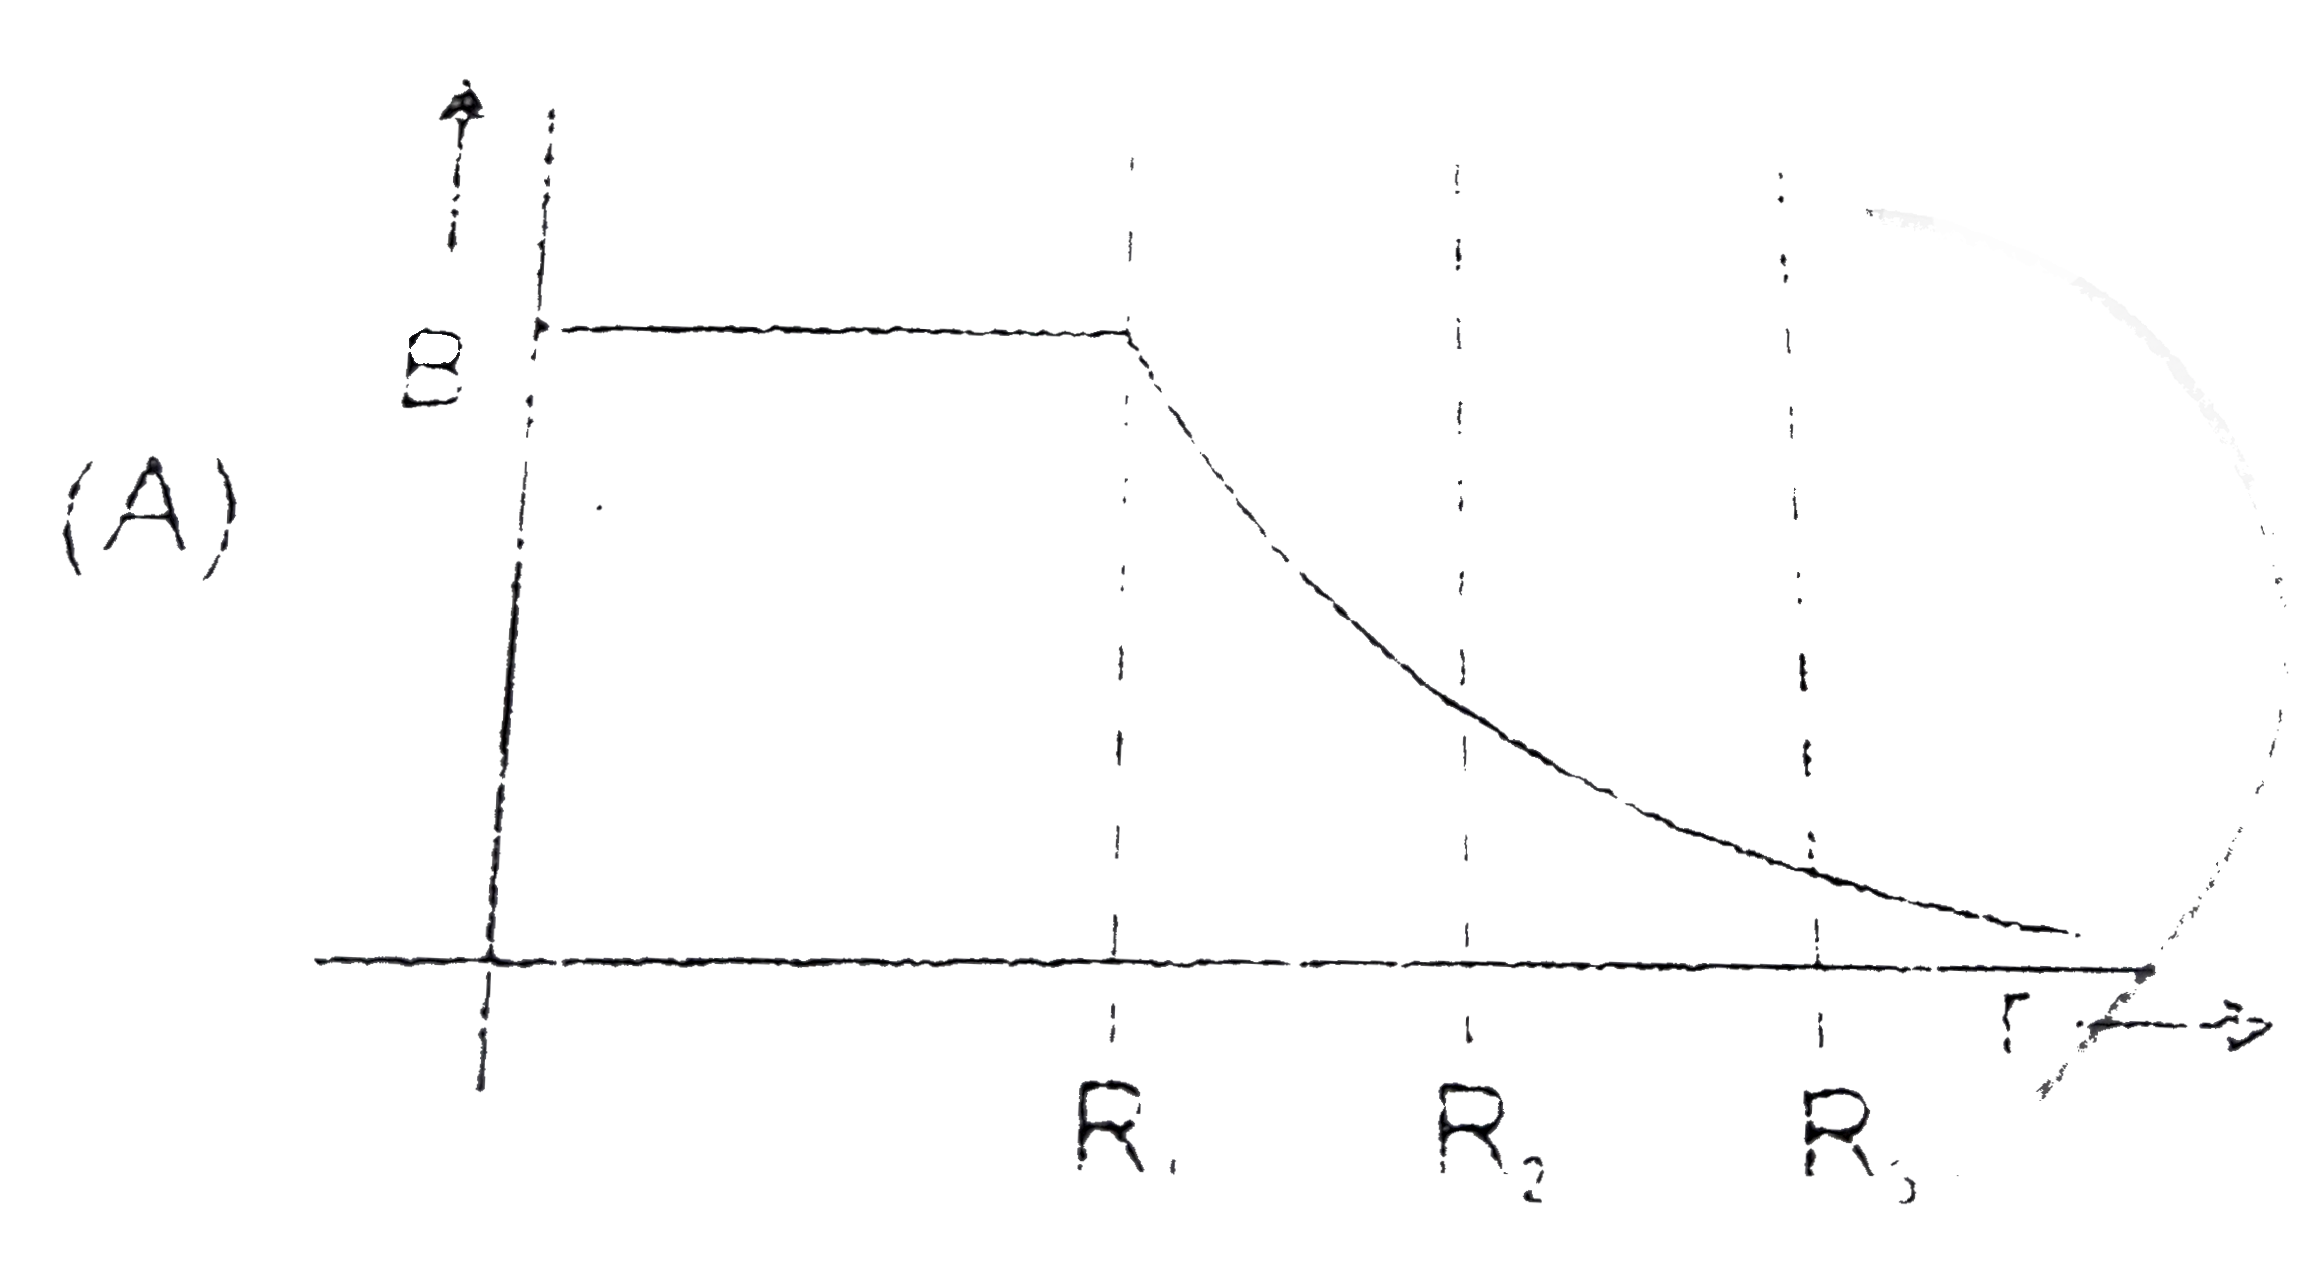
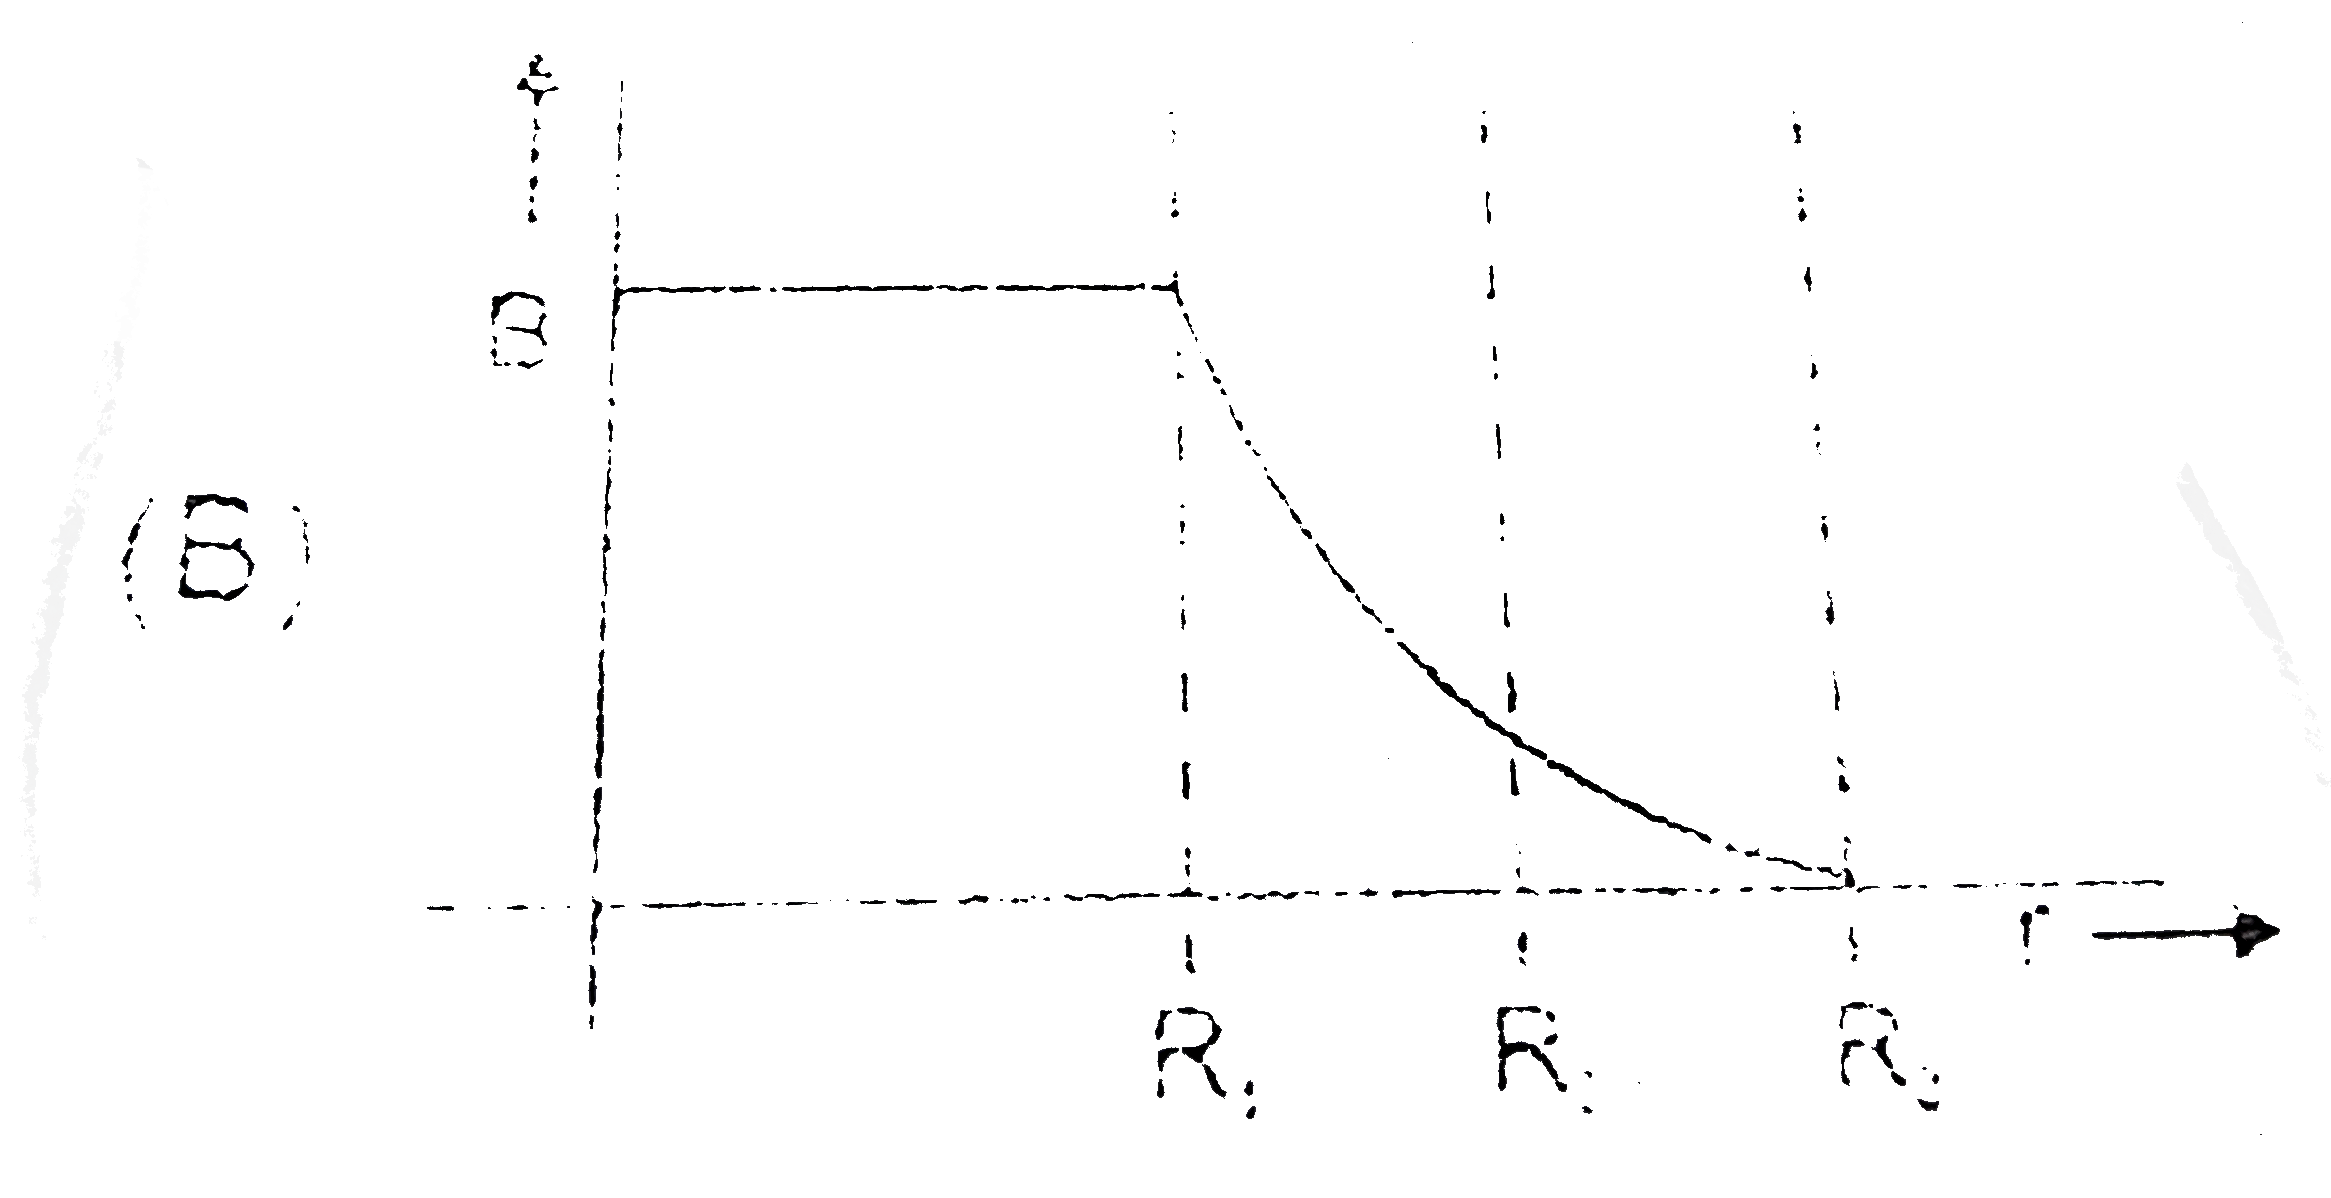
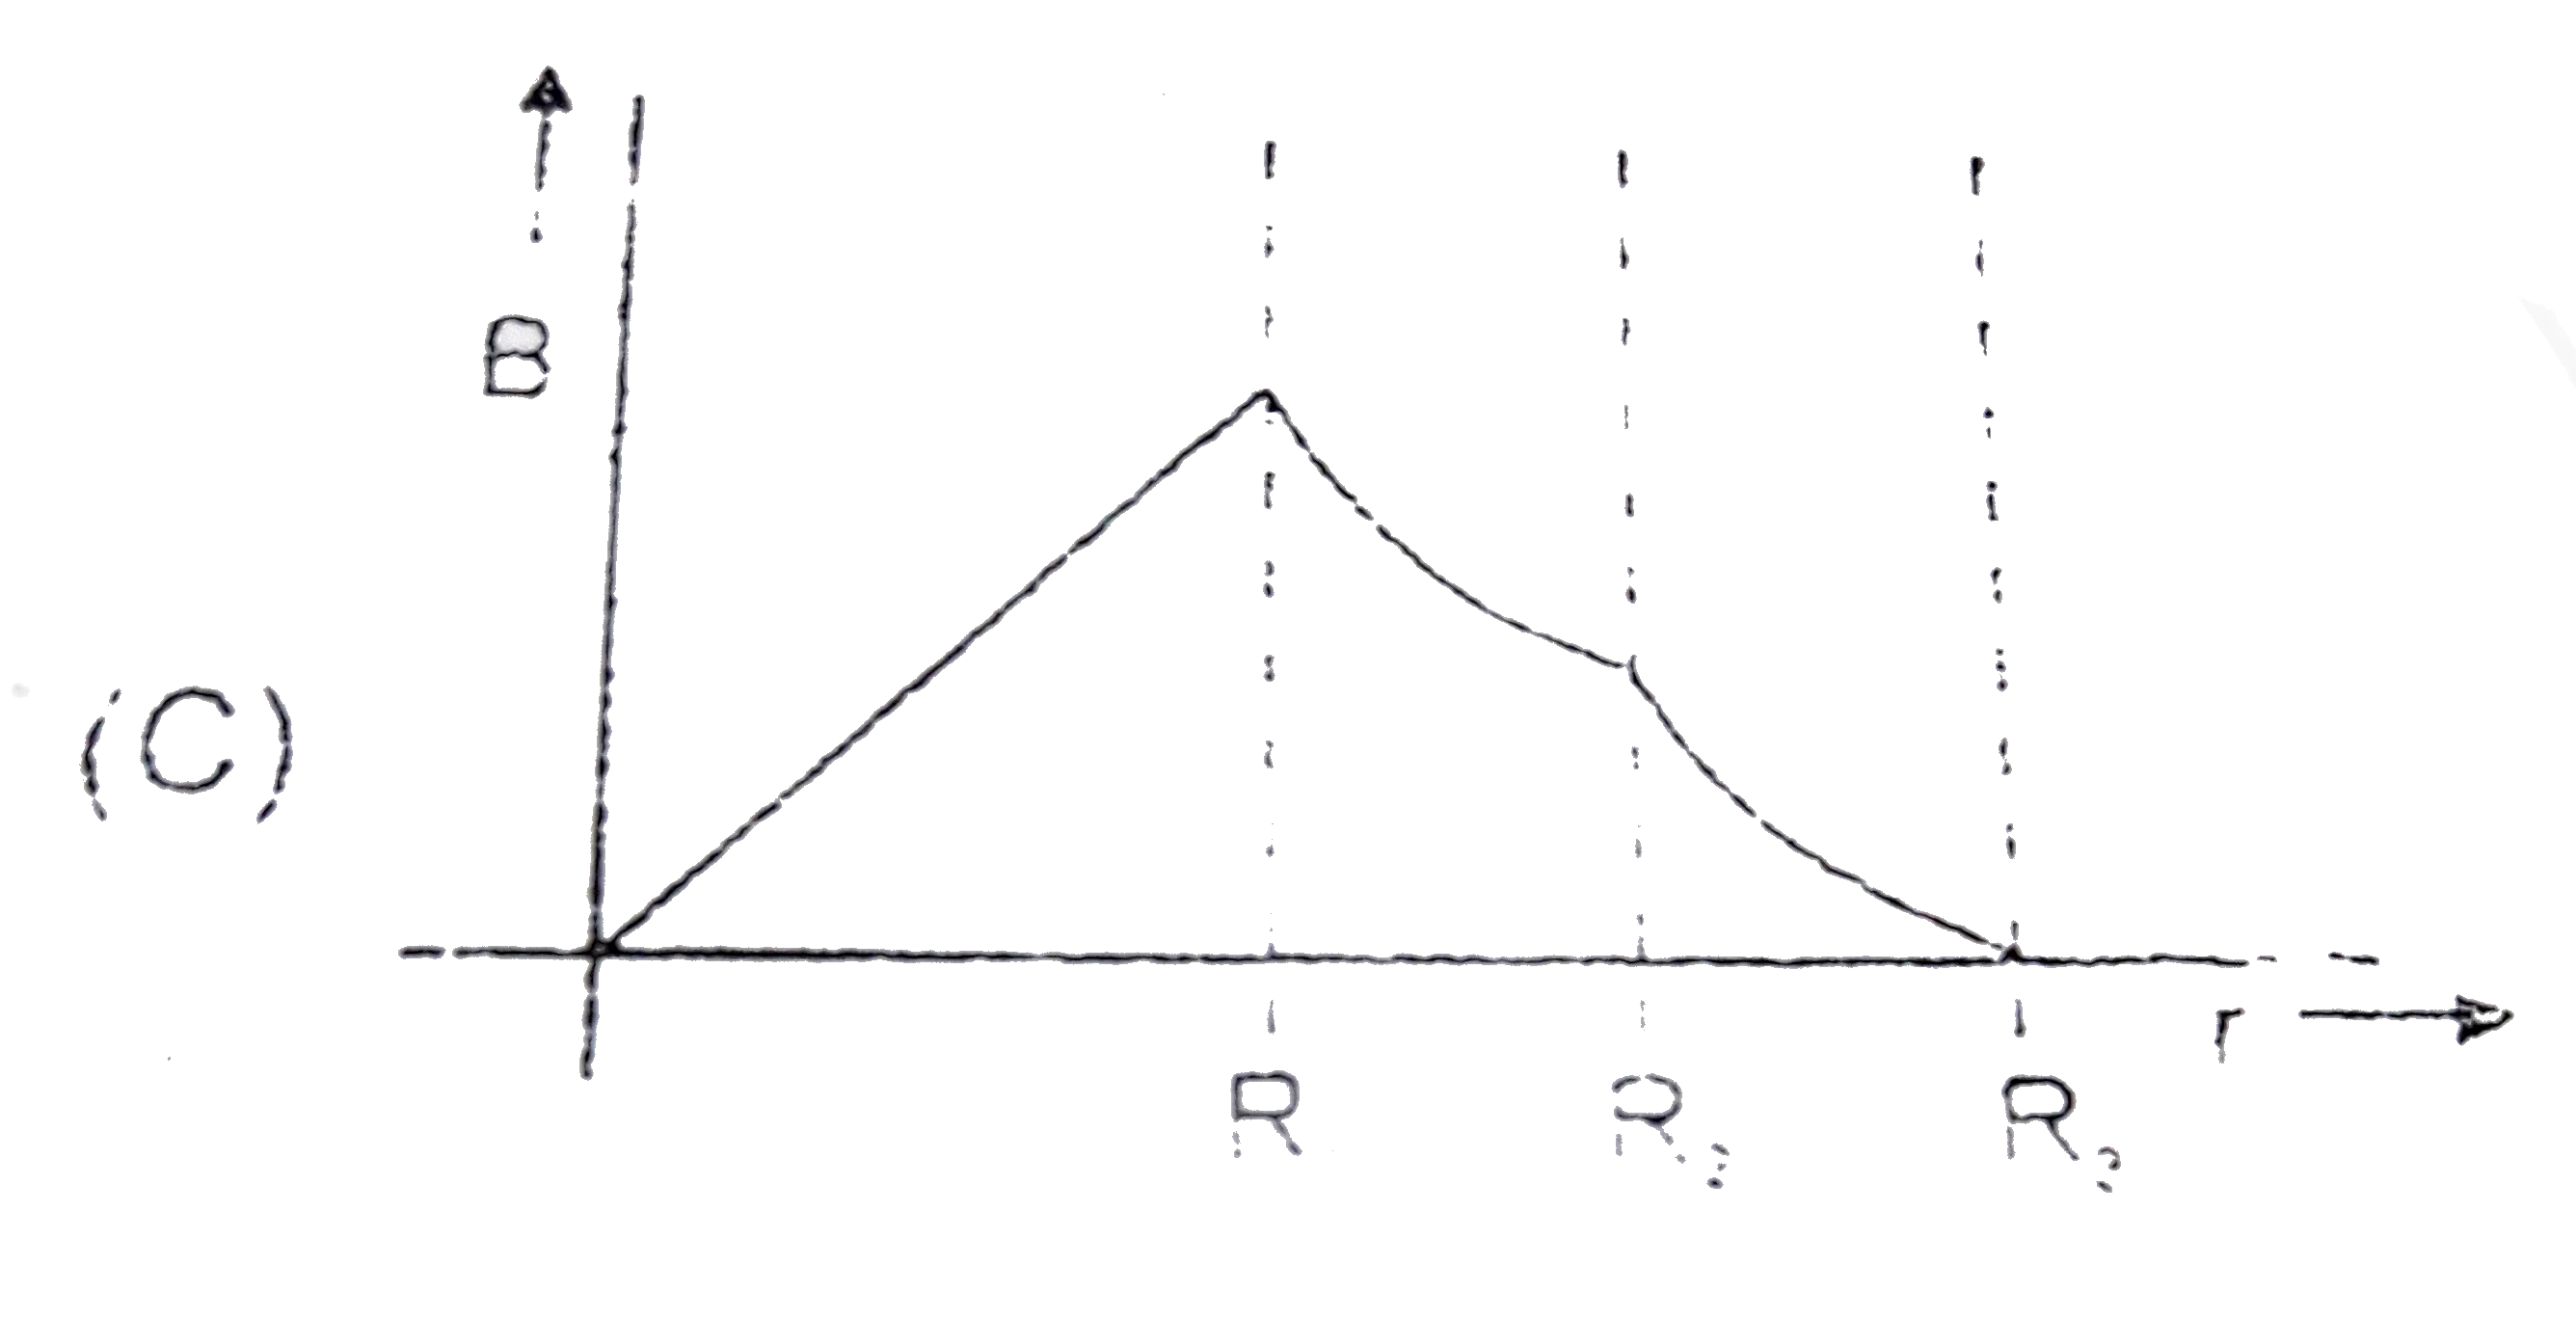
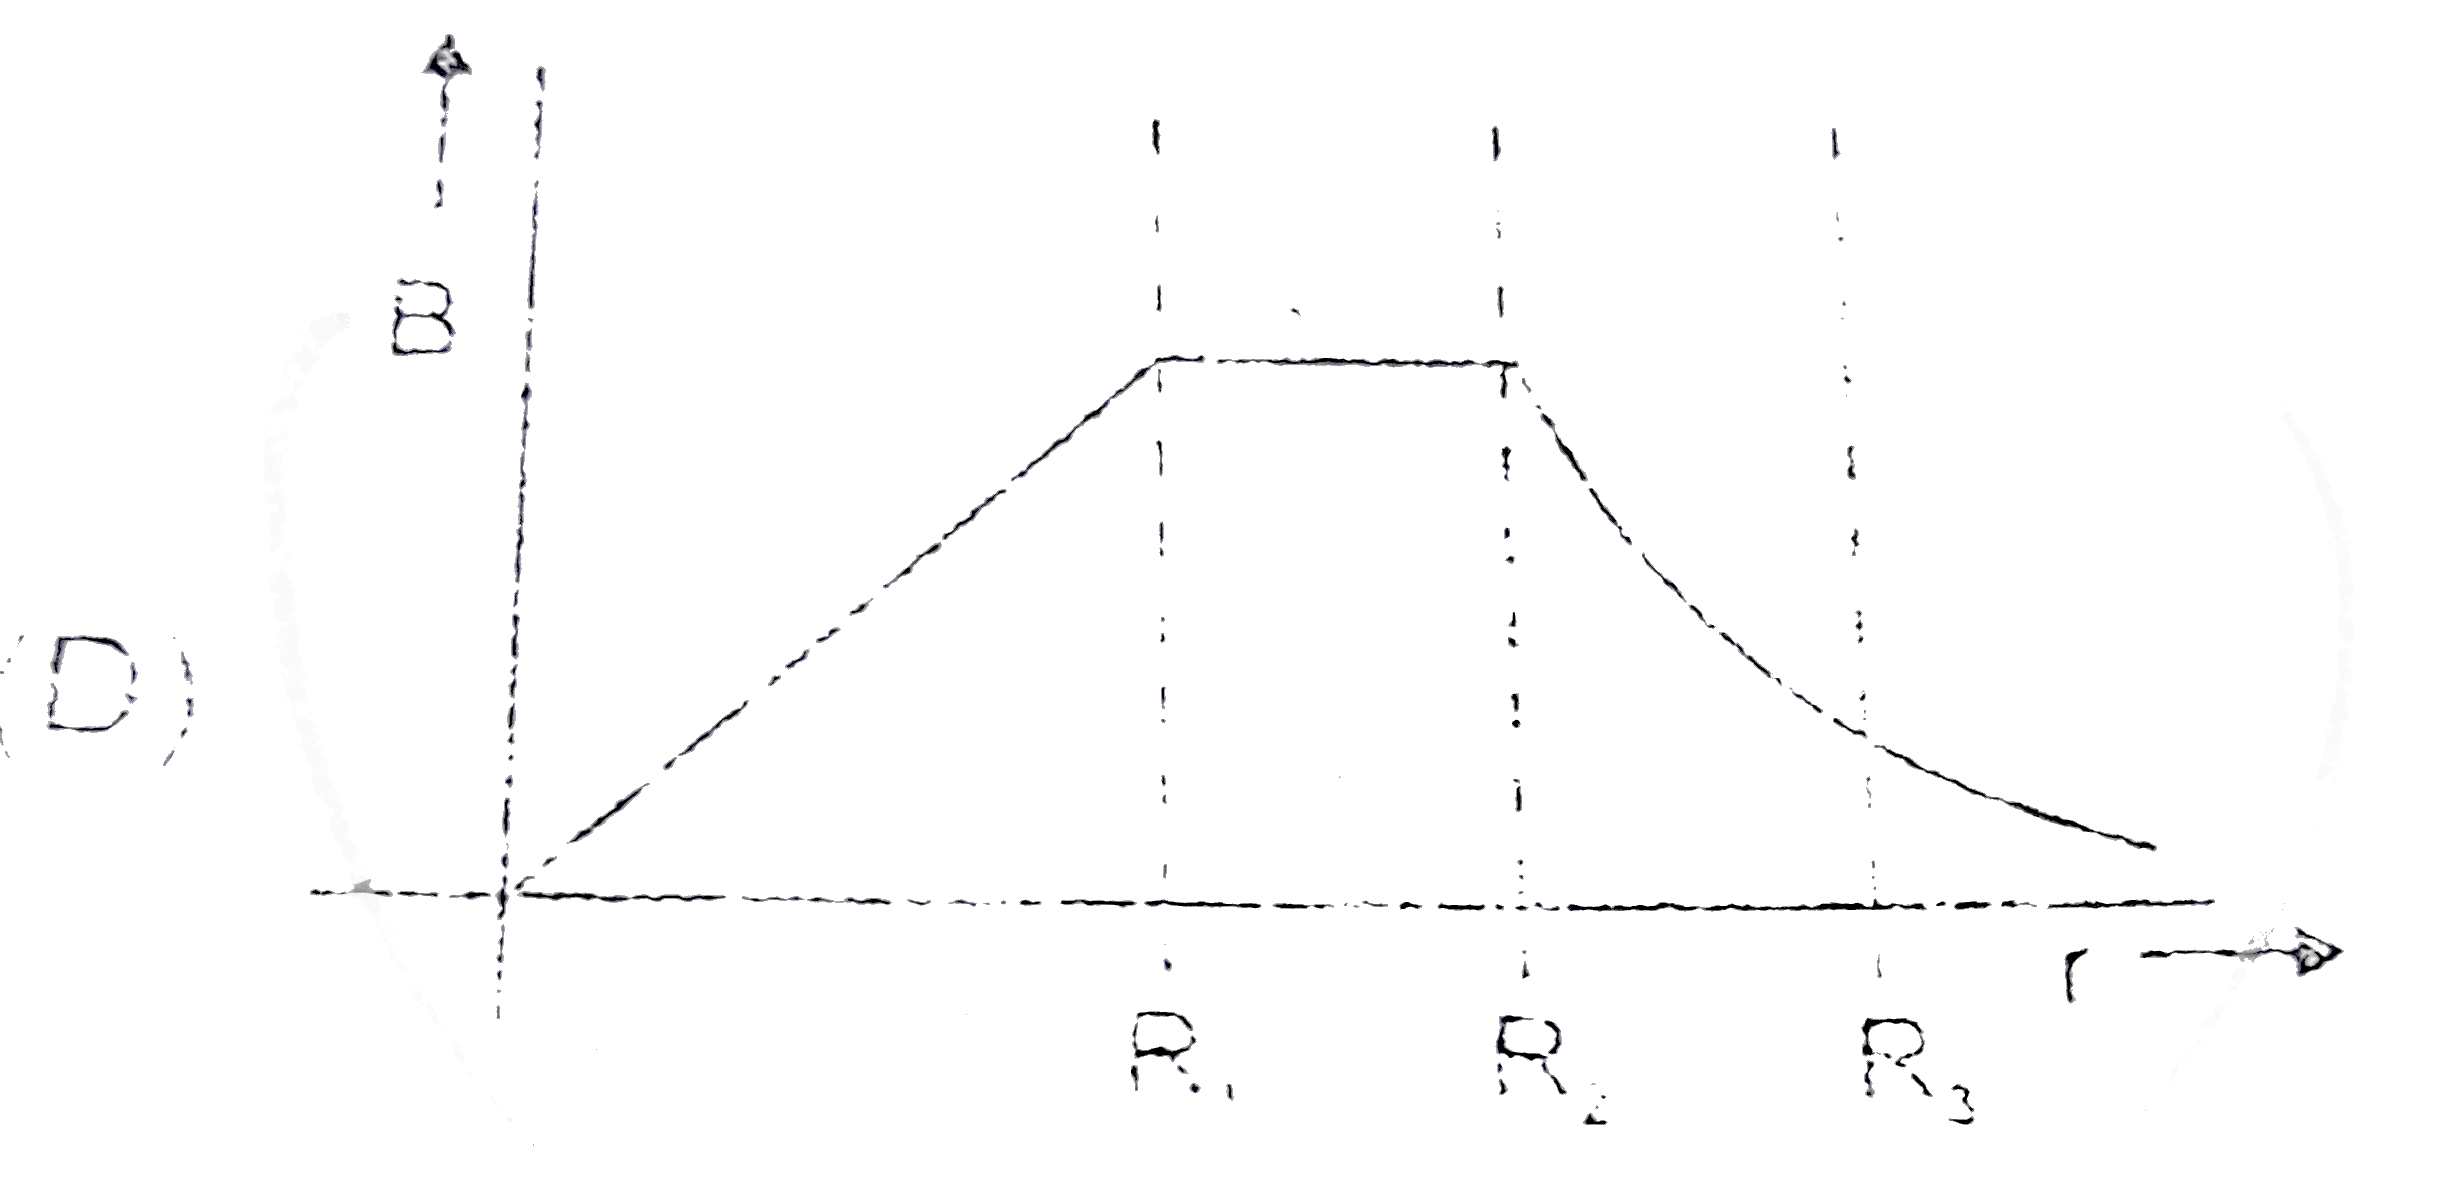
The correct Answer is:C
To solve the problem regarding the variation of the magnetic field with distance from the axis in a coaxial cable with two conductors carrying equal currents in opposite directions, we can follow these steps:
1. Understand the Configuration:
- We have a coaxial cable with an inner conductor of radius R1 and an outer hollow conductor with inner radius R2 and outer radius R3.
- The inner and outer conductors carry equal currents I in opposite directions.
2. Apply Ampère's Law:
- To find the magnetic field at a distance r from the axis, we can use Ampère's Law, which states that the line integral of the magnetic field B around a closed loop is equal to the permeability of free space times the total current Ienc enclosed by the loop:
∮B⋅dl=μ0Ienc
3. Consider Different Regions:
- Region 1: Inside the inner conductor (r<R1):
- The magnetic field B=0 because there is no current enclosed.
- Region 2: Between the inner and outer conductors (R1<r<R2):
- The enclosed current is I. Thus, applying Ampère's Law:
B(2πr)=μ0I⟹B=μ0I2πr
- Region 3: Inside the outer conductor (R2<r<R3):
- The enclosed current is I−I=0. Thus, B=0.
- Region 4: Outside the outer conductor (r>R3):
- The total enclosed current is I−I=0. Thus, B=0.
4. Summarize the Magnetic Field Variation:
- The magnetic field B varies with distance r as follows:
- B=0 for r<R1
- B=μ0I2πr for R1<r<R2
- B=0 for R2<r<R3
- B=0 for r>R3
5. Plot the Magnetic Field:
- The graph of B versus r will show:
- A value of 0 for r<R1
- A hyperbolic decrease from μ0I2πR1 to 0 as r approaches R2
- A value of 0 for R2<r<R3
- A value of 0 for r>R3
Final Answer:
The variation of the magnetic field with distance from the axis is best plotted as a hyperbolic curve between R1 and R2, and zero elsewhere.
- We have a coaxial cable with an inner conductor of radius R1 and an outer hollow conductor with inner radius R2 and outer radius R3.
- The inner and outer conductors carry equal currents I in opposite directions.
- To find the magnetic field at a distance r from the axis, we can use Ampère's Law, which states that the line integral of the magnetic field B around a closed loop is equal to the permeability of free space times the total current Ienc enclosed by the loop:
∮B⋅dl=μ0Ienc
- Region 1: Inside the inner conductor (r<R1):
- The magnetic field B=0 because there is no current enclosed.
- Region 2: Between the inner and outer conductors (R1<r<R2):
- The enclosed current is I. Thus, applying Ampère's Law:
B(2πr)=μ0I⟹B=μ0I2πr
- Region 3: Inside the outer conductor (R2<r<R3):
- The enclosed current is I−I=0. Thus, B=0.
- Region 4: Outside the outer conductor (r>R3):
- The total enclosed current is I−I=0. Thus, B=0.
- The magnetic field B varies with distance r as follows:
- B=0 for r<R1
- B=μ0I2πr for R1<r<R2
- B=0 for R2<r<R3
- B=0 for r>R3
- The graph of B versus r will show:
- A value of 0 for r<R1
- A hyperbolic decrease from μ0I2πR1 to 0 as r approaches R2
- A value of 0 for R2<r<R3
- A value of 0 for r>R3
The variation of the magnetic field with distance from the axis is best plotted as a hyperbolic curve between R1 and R2, and zero elsewhere.
Topper's Solved these Questions
- ELECTRODYNAMICSBOOK - RESONANCE ENGLISHCHAPTER - ELECTRODYNAMICSEXERCISE - Exercise-2 PART-1
15 Videos
- ELECTRODYNAMICSBOOK - RESONANCE ENGLISHCHAPTER - ELECTRODYNAMICSEXERCISE - Exercise-2 PART-2
26 Videos
- ELECTRODYNAMICSBOOK - RESONANCE ENGLISHCHAPTER - ELECTRODYNAMICSEXERCISE - Exercise-1 PART-1
83 Videos
- ELECTRO MAGNETIC WAVESBOOK - RESONANCE ENGLISHCHAPTER - ELECTRO MAGNETIC WAVESEXERCISE - Exercise 3
27 Videos
- ELECTROMAGNETIC INDUCTIONBOOK - RESONANCE ENGLISHCHAPTER - ELECTROMAGNETIC INDUCTIONEXERCISE - A.l.P
19 Videos
Similar Questions
Sphere of inner radius a and outer radius b is made of p uniform resistivity find resistance between inner and outer surface
View SolutionSphere of inner radius a and outer radius b is made of p uniform resistivity find resistance between inner and outer surface
View SolutionIn a coaxial, straight cable, the central conductor and the outer conductor carry equal currents in opposite directions. The magnetic field is zero.
View SolutionA hollow conducting sphere of inner radius r and outer radius 2R is given charge Q as shown in figure, then the
View SolutionThe figure shows a long straight current carrying conductor. Can you plot the variation of magnetic field on x-axis ?
View SolutionA point charge +q is placed at the centre of a conducting spherical shell of inner radius a and outer radius b. Find the charge appearing on the inner and outer surface of the shell.
View SolutionA point charge q is placed at a distance of r from the centre O of an uncharged spherical shell of inner radius R and outer radius 2R. The electric potential at the centre of the shell will be

View SolutionConsider a co axial cable which consists of an inner wilre of radius a surrounded by an outer shell of inner and outer radii b and c respectively. The inner wire caries a current I and outer shell carries an equal and opposite current. The magnetic field at a distance x from the axis where b<x<c is
View SolutionA point charge q is placed at a distance of r from the centre O of an uncharged spherical shell of inner radius R and outer radius 2R.The distance r<R.The electric potential at the centre of the shell will be

View SolutionWhich one of the following graphs represents the variation of electric field with distance r from the centre of a charged spherical conductor of radius R?
View Solution
