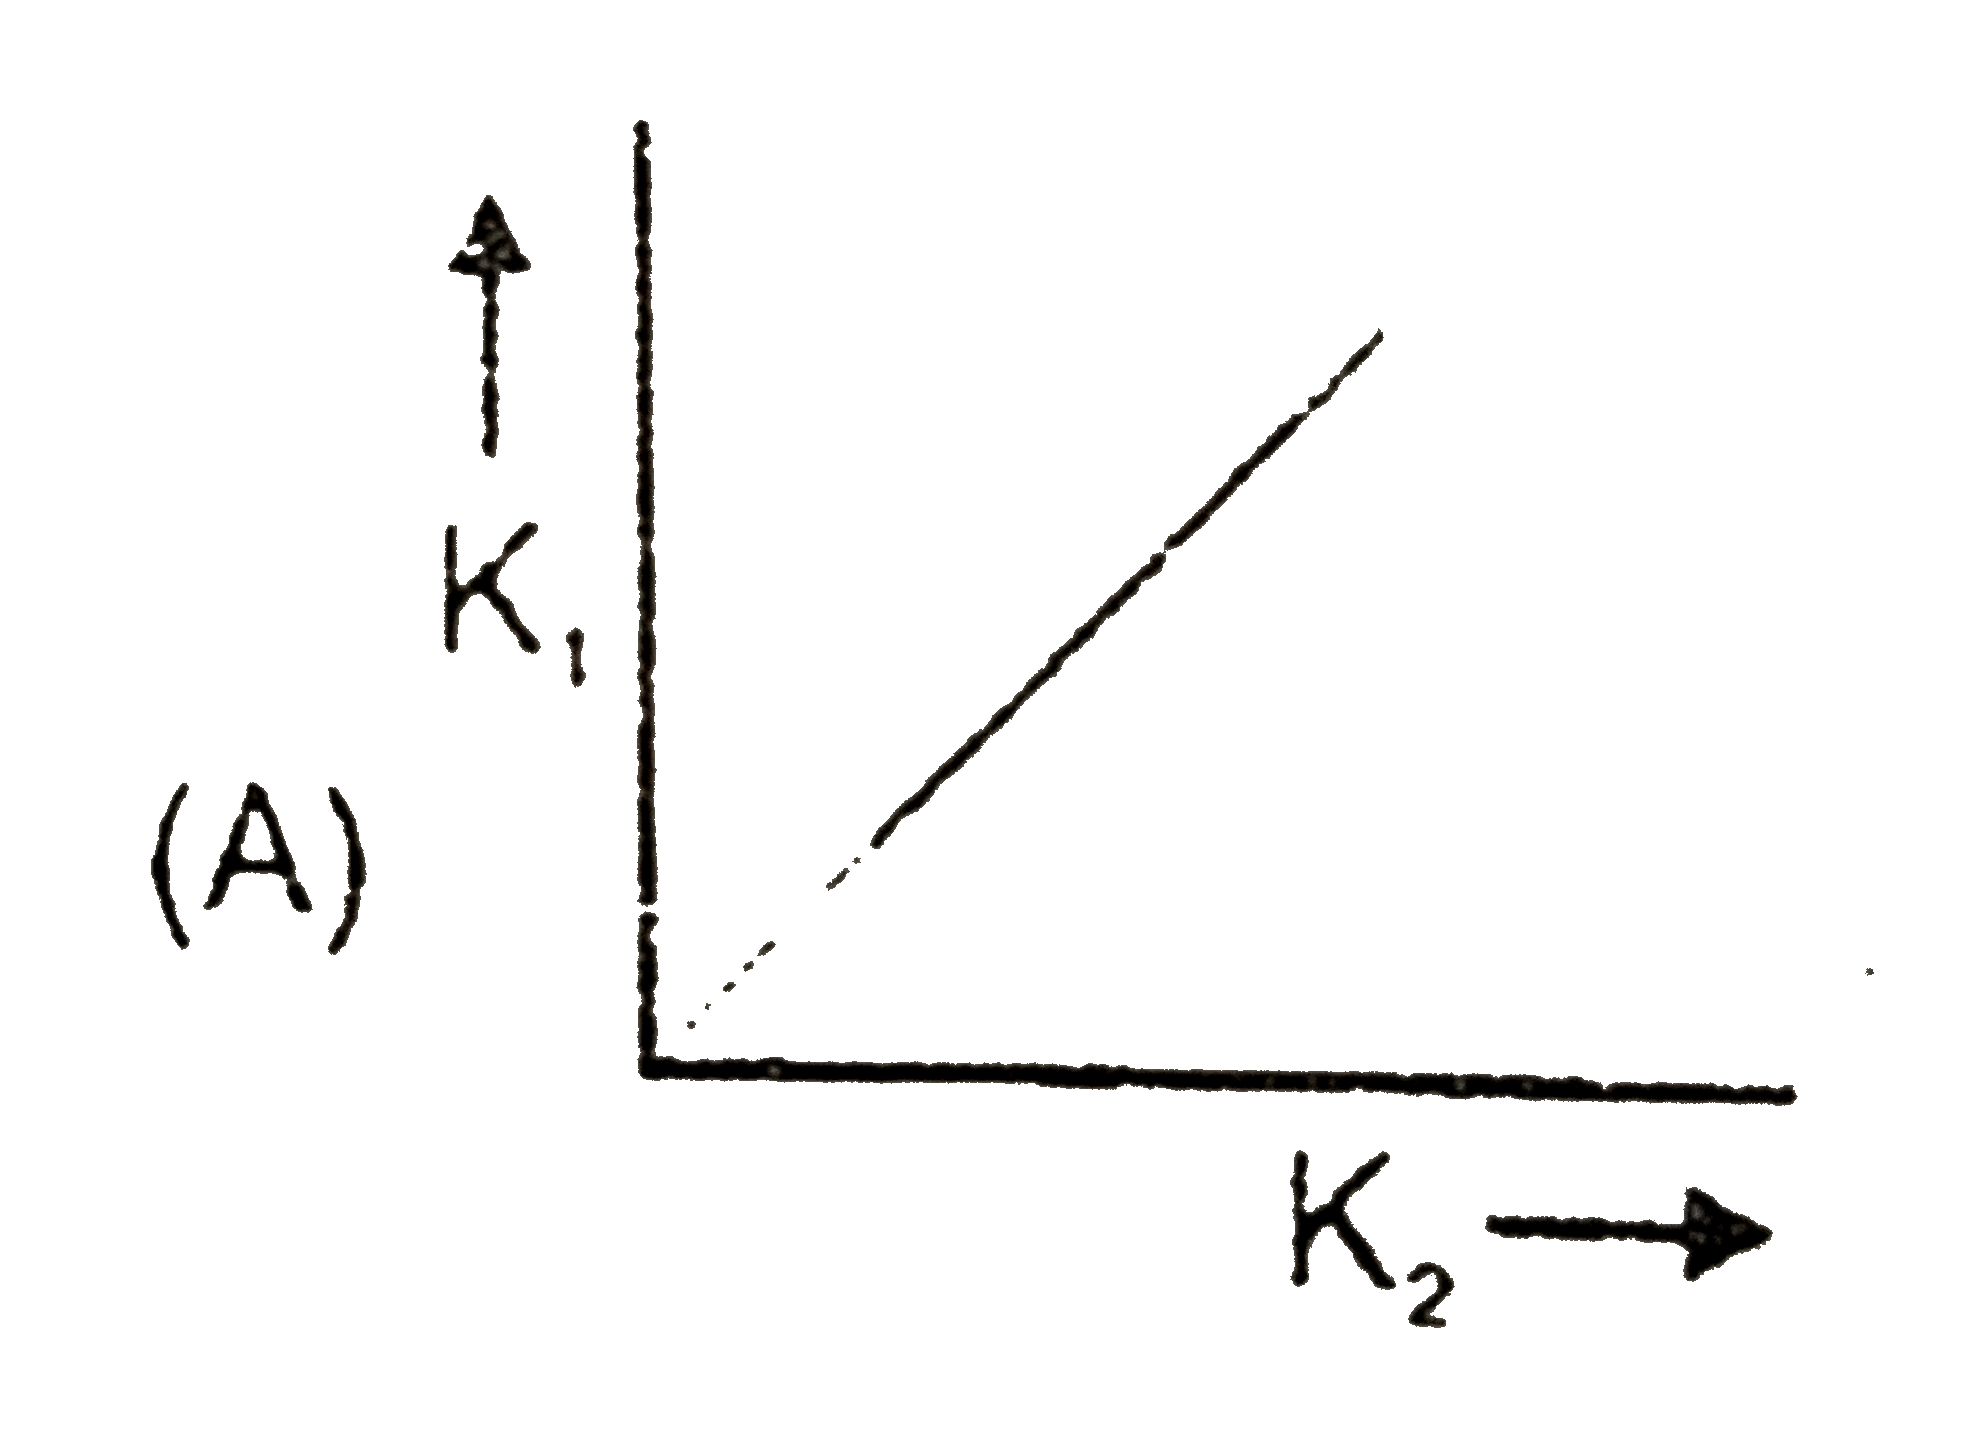
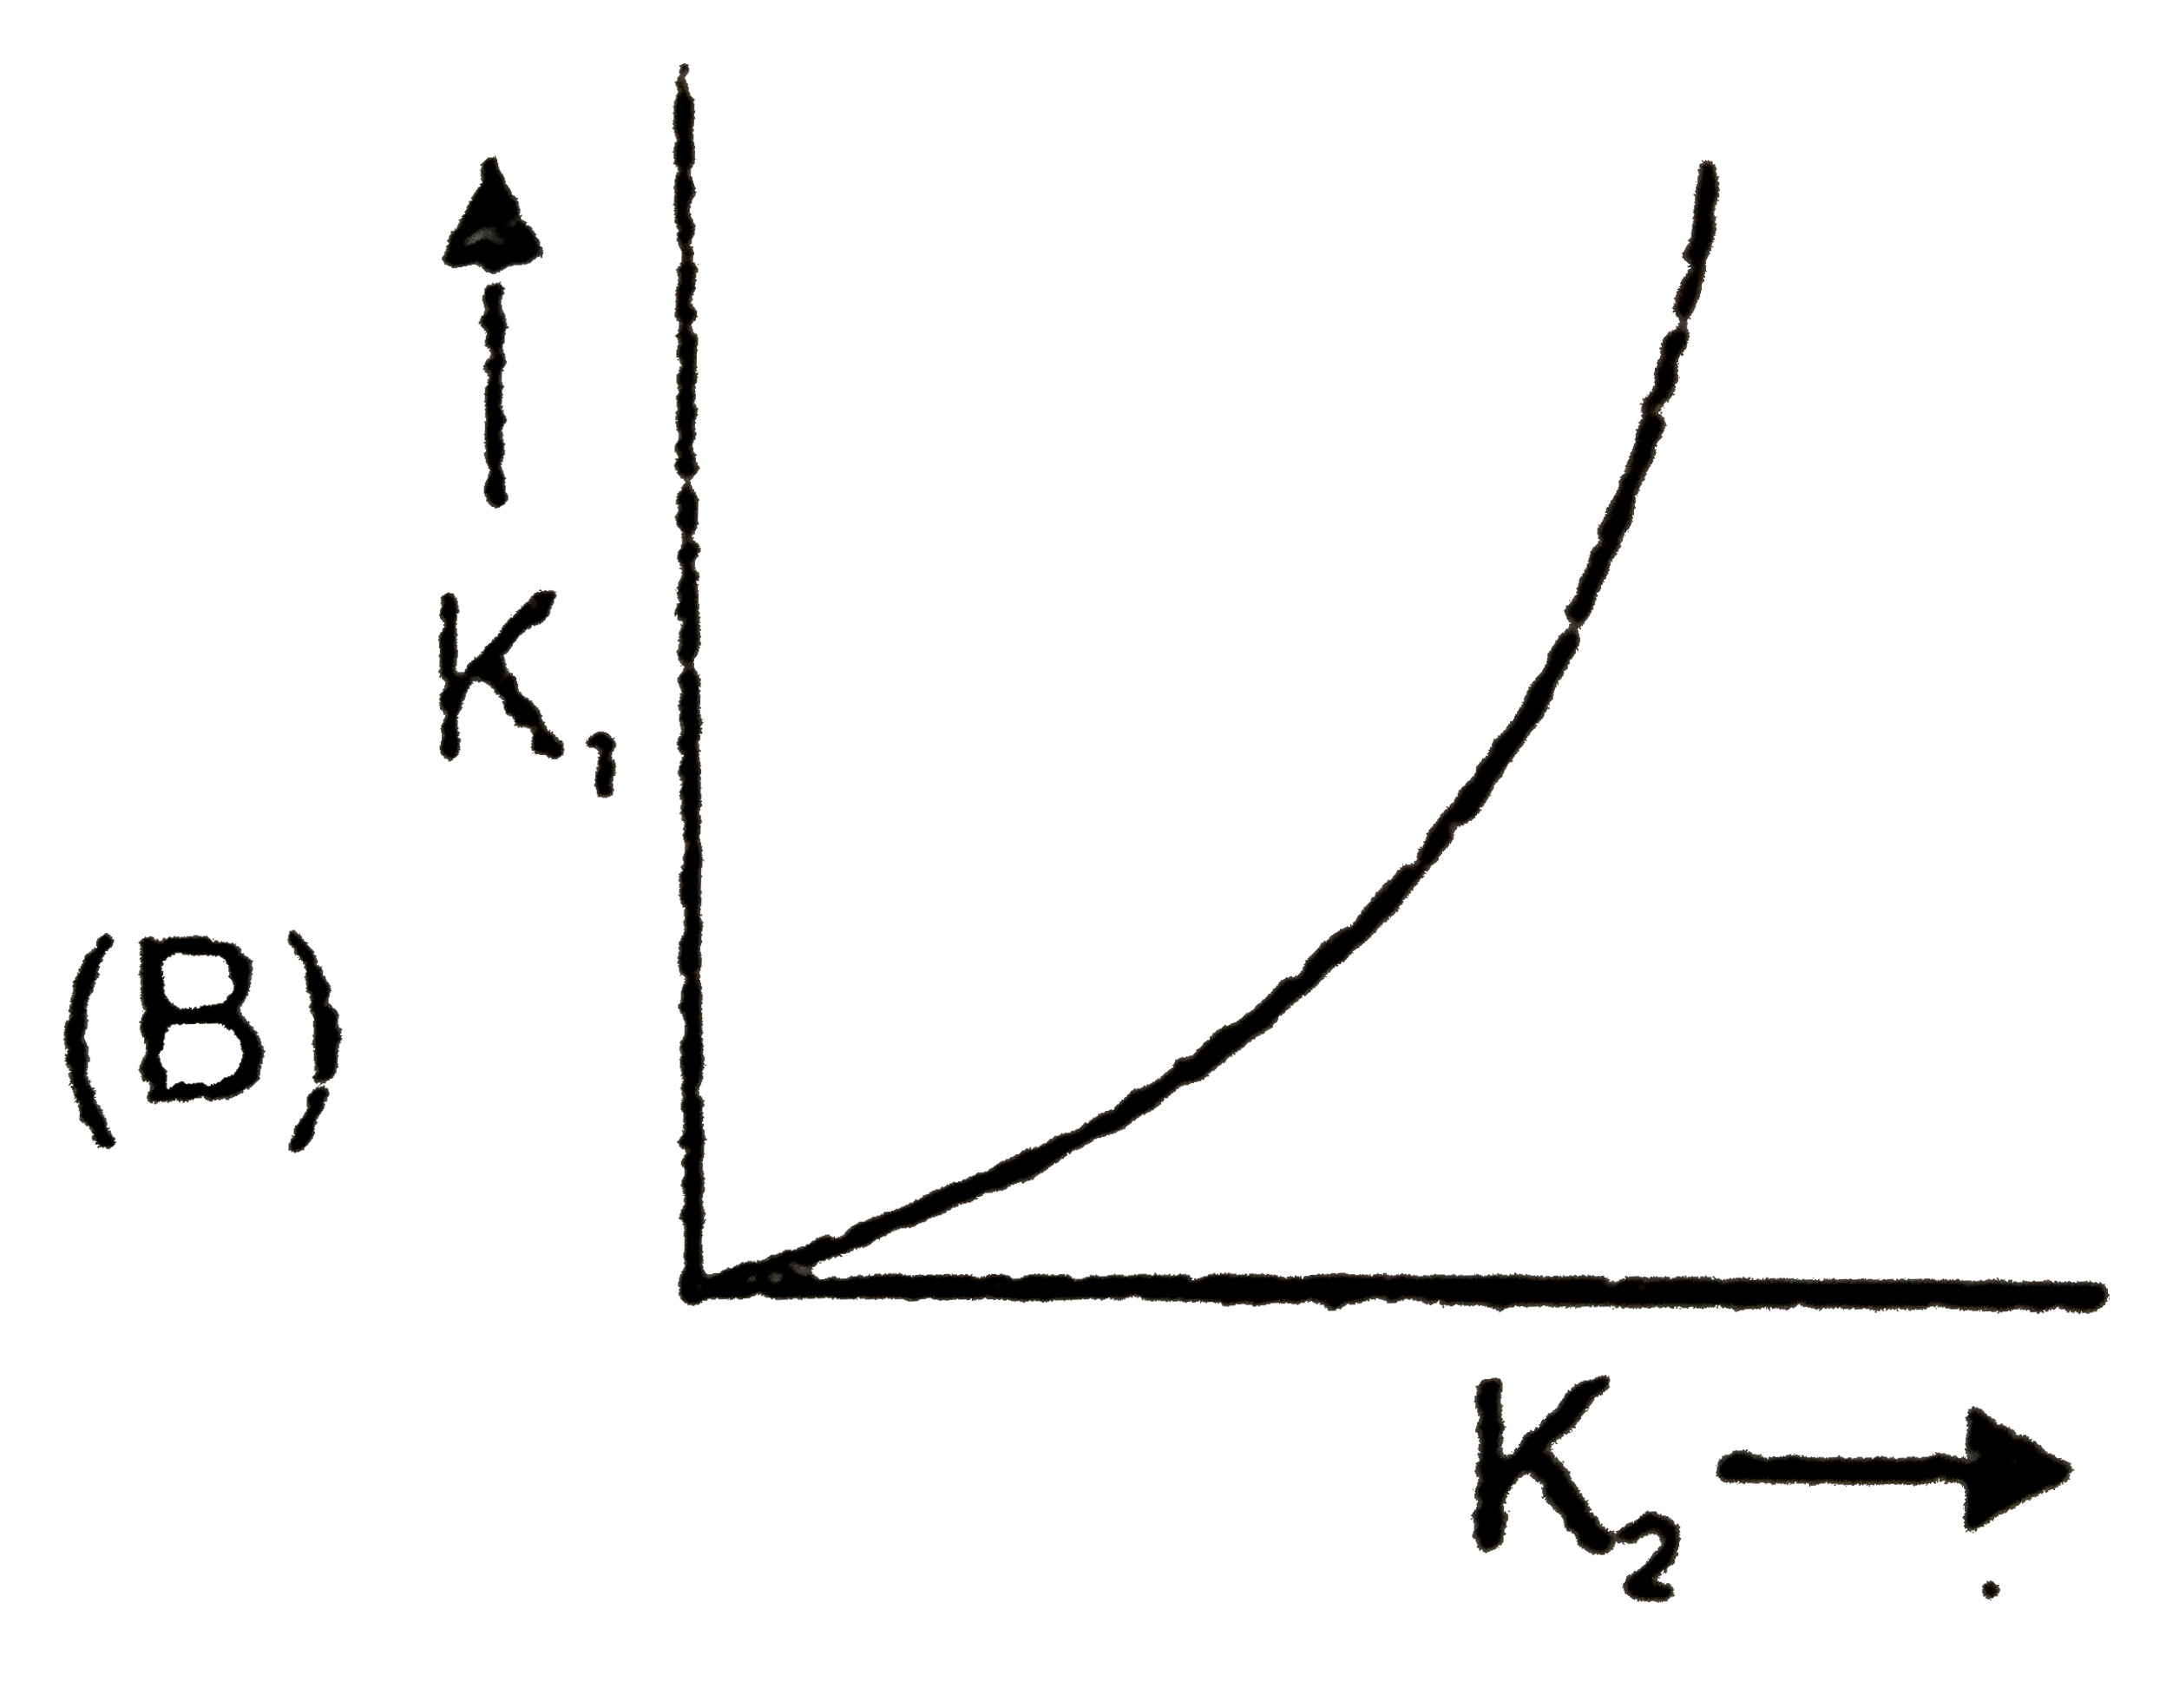
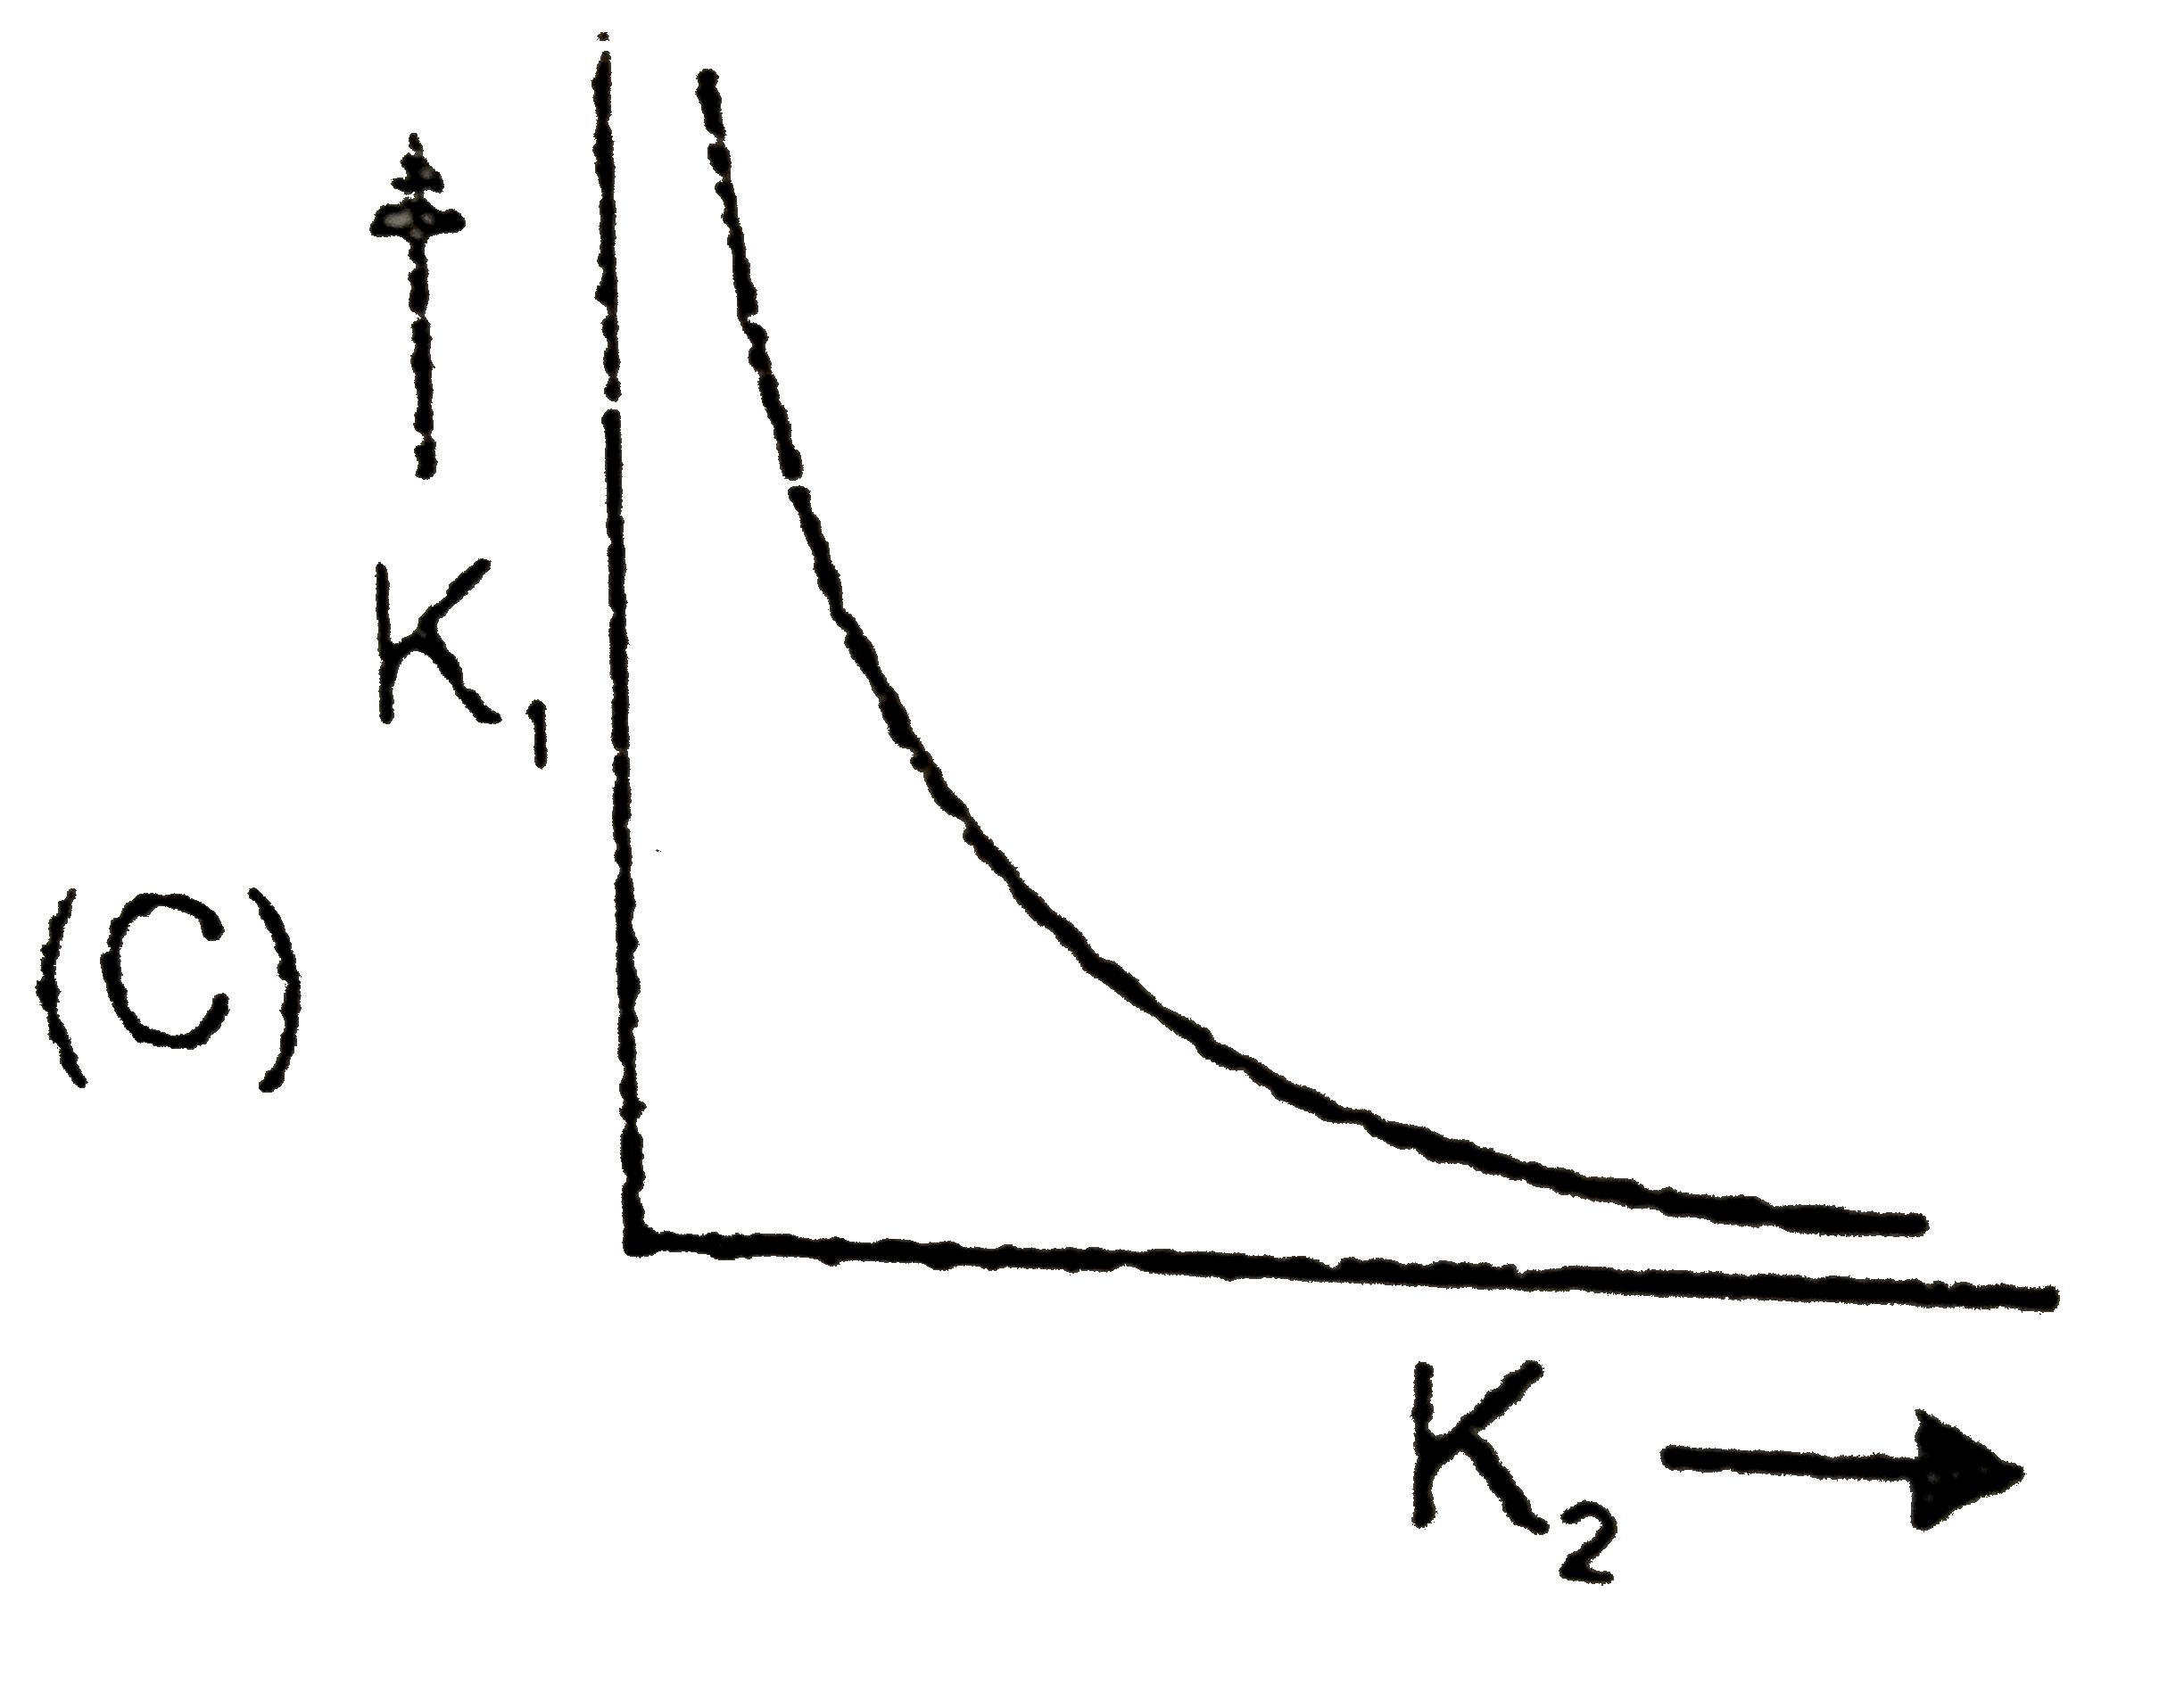
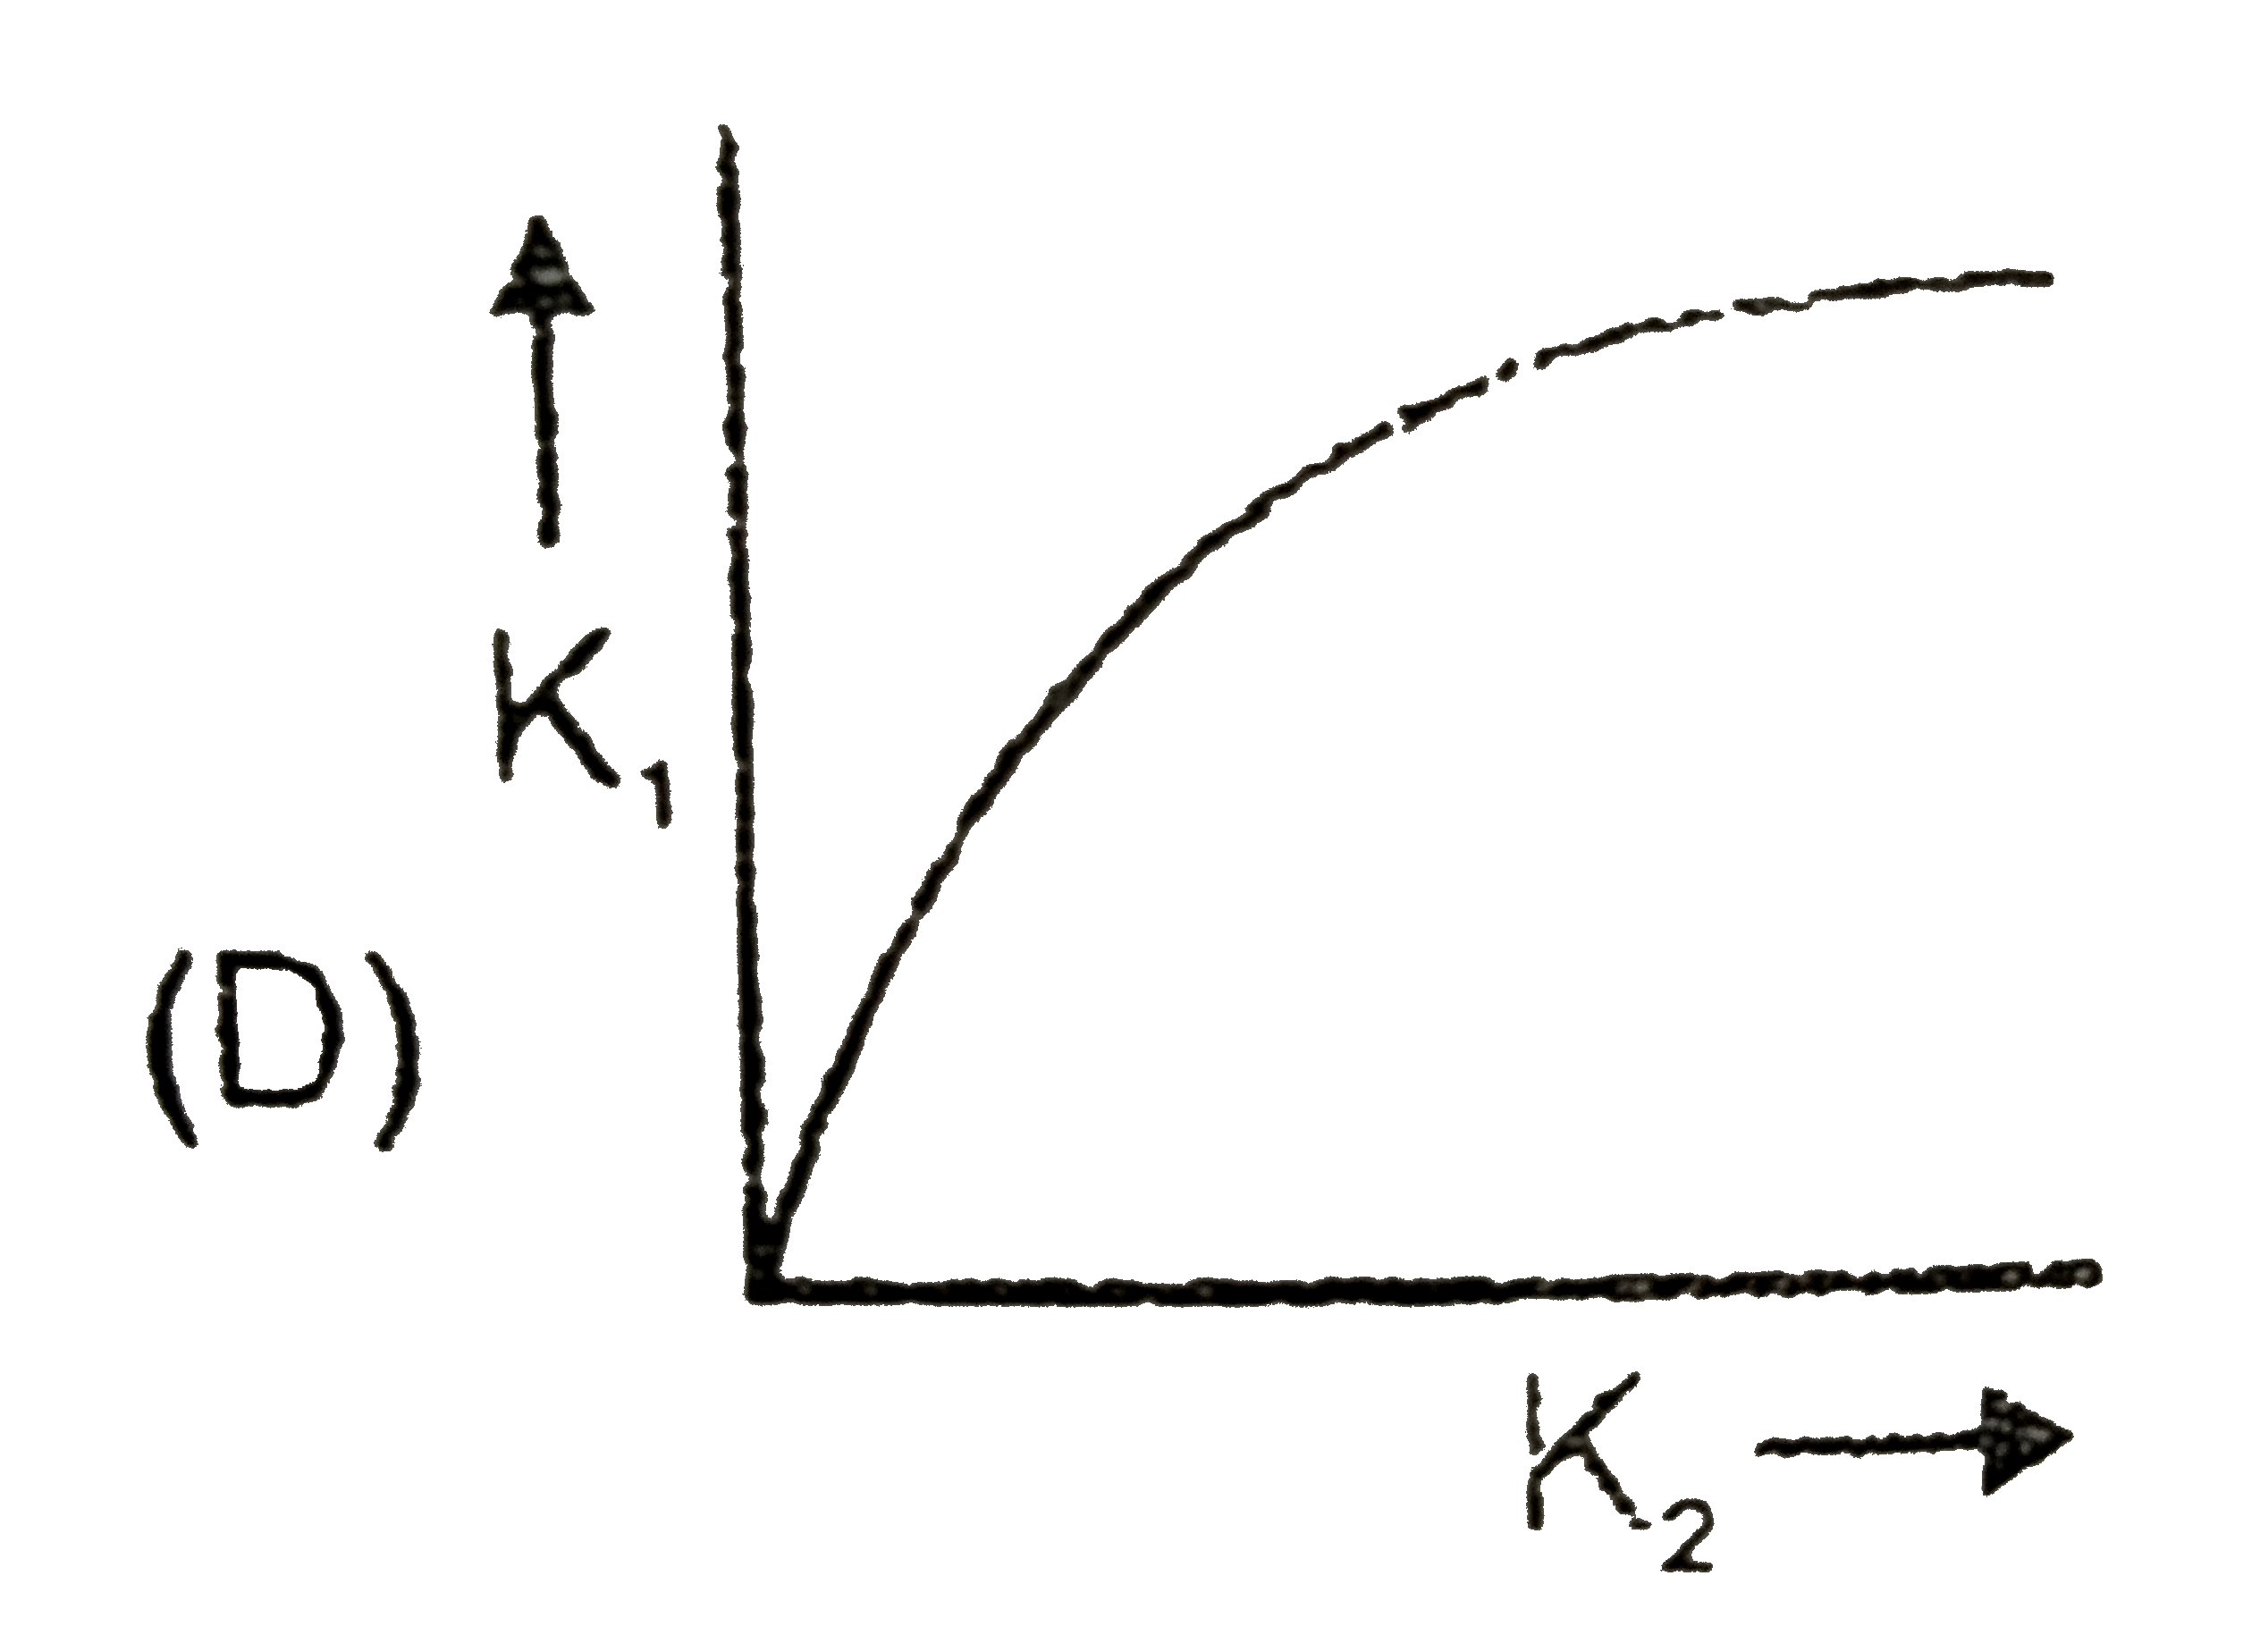
For a container contining A(g),B(g),C(g)&D(g) with rigid walls, an experiment is carried upon. This experiment involves increase in temperature of container in stepsof 1∘C and system is allowed to attain equilibrium, followed by calculation of K1&K2 at each step, where K1&K2 are equilibrium constants for reaction (1) & (2) respectively.
A(g)+2B(g)⇔C(g)+D(g) ....(1)
C(g)+D(g)⇔A(g)+2B(g) .....(2)
Select the graph showing correct relationship-


The correct Answer is:C
To solve the problem, we need to analyze the two equilibrium reactions given and their corresponding equilibrium constants. Let's break it down step by step.
Step 1: Write the Equilibrium Expressions
For the two reactions provided, we need to write the expressions for the equilibrium constants K1 and K2.
1. For Reaction (1):
A(g)+2B(g)⇌C(g)+D(g)
The equilibrium constant K1 is given by:
K1=(C)(D)(A)(B)2
2. For Reaction (2):
C(g)+D(g)⇌A(g)+2B(g)
The equilibrium constant K2 is given by:
K2=(A)(B)2(C)(D)
Step 2: Relate K1 and K2
From the expressions for K1 and K2, we can see that they are inversely related:
K2=1K1
This means that if K1 increases, K2 must decrease, and vice versa.
Step 3: Understand the Effect of Temperature
As the temperature of the system is increased, the equilibrium constants K1 and K2 will change according to the nature of the reactions (endothermic or exothermic). However, since we are not given specific information about the enthalpy changes of the reactions, we can only conclude that the relationship K1⋅K2=1 holds true at all temperatures.
Step 4: Graphical Representation
Given that K1 and K2 are inversely related, we can conclude that the graph representing their relationship will show a hyperbolic curve where:
- When K1 is high, K2 is low.
- When K2 is high, K1 is low.
Conclusion
Thus, the correct graph that represents the relationship between K1 and K2 is the one that shows an inverse relationship.
Final Answer
The correct option is Graph 3 (or option C).
---
For the two reactions provided, we need to write the expressions for the equilibrium constants K1 and K2.
A(g)+2B(g)⇌C(g)+D(g)
The equilibrium constant K1 is given by:
K1=(C)(D)(A)(B)2
C(g)+D(g)⇌A(g)+2B(g)
The equilibrium constant K2 is given by:
K2=(A)(B)2(C)(D)
From the expressions for K1 and K2, we can see that they are inversely related:
K2=1K1
This means that if K1 increases, K2 must decrease, and vice versa.
As the temperature of the system is increased, the equilibrium constants K1 and K2 will change according to the nature of the reactions (endothermic or exothermic). However, since we are not given specific information about the enthalpy changes of the reactions, we can only conclude that the relationship K1⋅K2=1 holds true at all temperatures.
Given that K1 and K2 are inversely related, we can conclude that the graph representing their relationship will show a hyperbolic curve where:
- When K1 is high, K2 is low.
- When K2 is high, K1 is low.
Thus, the correct graph that represents the relationship between K1 and K2 is the one that shows an inverse relationship.
The correct option is Graph 3 (or option C).
Topper's Solved these Questions
- CHEMICAL EQUILIBRIUMBOOK - RESONANCE ENGLISHCHAPTER - CHEMICAL EQUILIBRIUMEXERCISE - Exercise-2 (Part-1)
28 Videos
- CHEMICAL EQUILIBRIUMBOOK - RESONANCE ENGLISHCHAPTER - CHEMICAL EQUILIBRIUMEXERCISE - Exercise-2 (Part-2)
22 Videos
- CHEMICAL EQUILIBRIUMBOOK - RESONANCE ENGLISHCHAPTER - CHEMICAL EQUILIBRIUMEXERCISE - Exercise-1 (Part-1)
38 Videos
- CHEMICAL BONDINGBOOK - RESONANCE ENGLISHCHAPTER - CHEMICAL BONDINGEXERCISE - ORGANIC CHEMISTRY(Fundamental Concept )
6 Videos
- D & F-BLOCK ELEMENTS & THEIR IMPORTANT COMPOUNDS BOOK - RESONANCE ENGLISHCHAPTER - D & F-BLOCK ELEMENTS & THEIR IMPORTANT COMPOUNDS EXERCISE - Match the column
1 Videos
Similar Questions
K1 and K2 are equilibrium constants for reaction (i) and (ii)
N2(g)+O2(g)⇔2NO(g) …(i)
NO(g)⇔1/2N2(g)+1/2O2(g) …(ii)
then,
View SolutionK1 and K2 are equilibrium constants for reaction (i) and (ii)
N2(g)+O2(g)⇔2NO(g) …(i)
NO(g)⇔1/2N2(g)+1/2O2(g) …(ii)
then,
View SolutionEquilibrium constant for the reaction 4A(g)↔B(g)+2C(g) is-
Given : 2A(g)↔B(g)+Y(g),kc1=8
C(g)↔A(g)+12Y(g),kc2=14
View SolutionThe equilibrium constant Kp for the reaction H2(g)+I2(g)⇔2HI(g) changes if:
View SolutionThe Kc for given reaction will be A2(g)+2B(g)⇔C(g)+2D(s)
View SolutionThe equilibrium constant for the reaction A(g)⇔B(g) and B(g)⇔C(g) are K1=10−2 and K2=10−1 respectively . Equilibrium constant for the reaction (12)C(g)⇔(12)A(g) is
View SolutionThe relation between KPandKC for the reaction A(g)+B(g)⇔C(g)+2D(g) is -
View SolutionKp/Kc for the reaction
CO(g)+12O2(g)⇔CO2(g) is
View SolutionKp/Kc for the reaction
CO(g)+12O2(g)⇔CO2(g) is
View Solutionconsider the following gaseous equilibrium with equilibrium constant K1 and K2 respectively
SO2(g)+1/2O2⇔SO3(g)
2SO3(g)⇔2SO2(g)+O2(g)
The equilibrium constants are related as
View Solution
