Variation of log10K with 1T is shown by the following graph in which straight line is at 45∘ , hence ΔH∘ is: 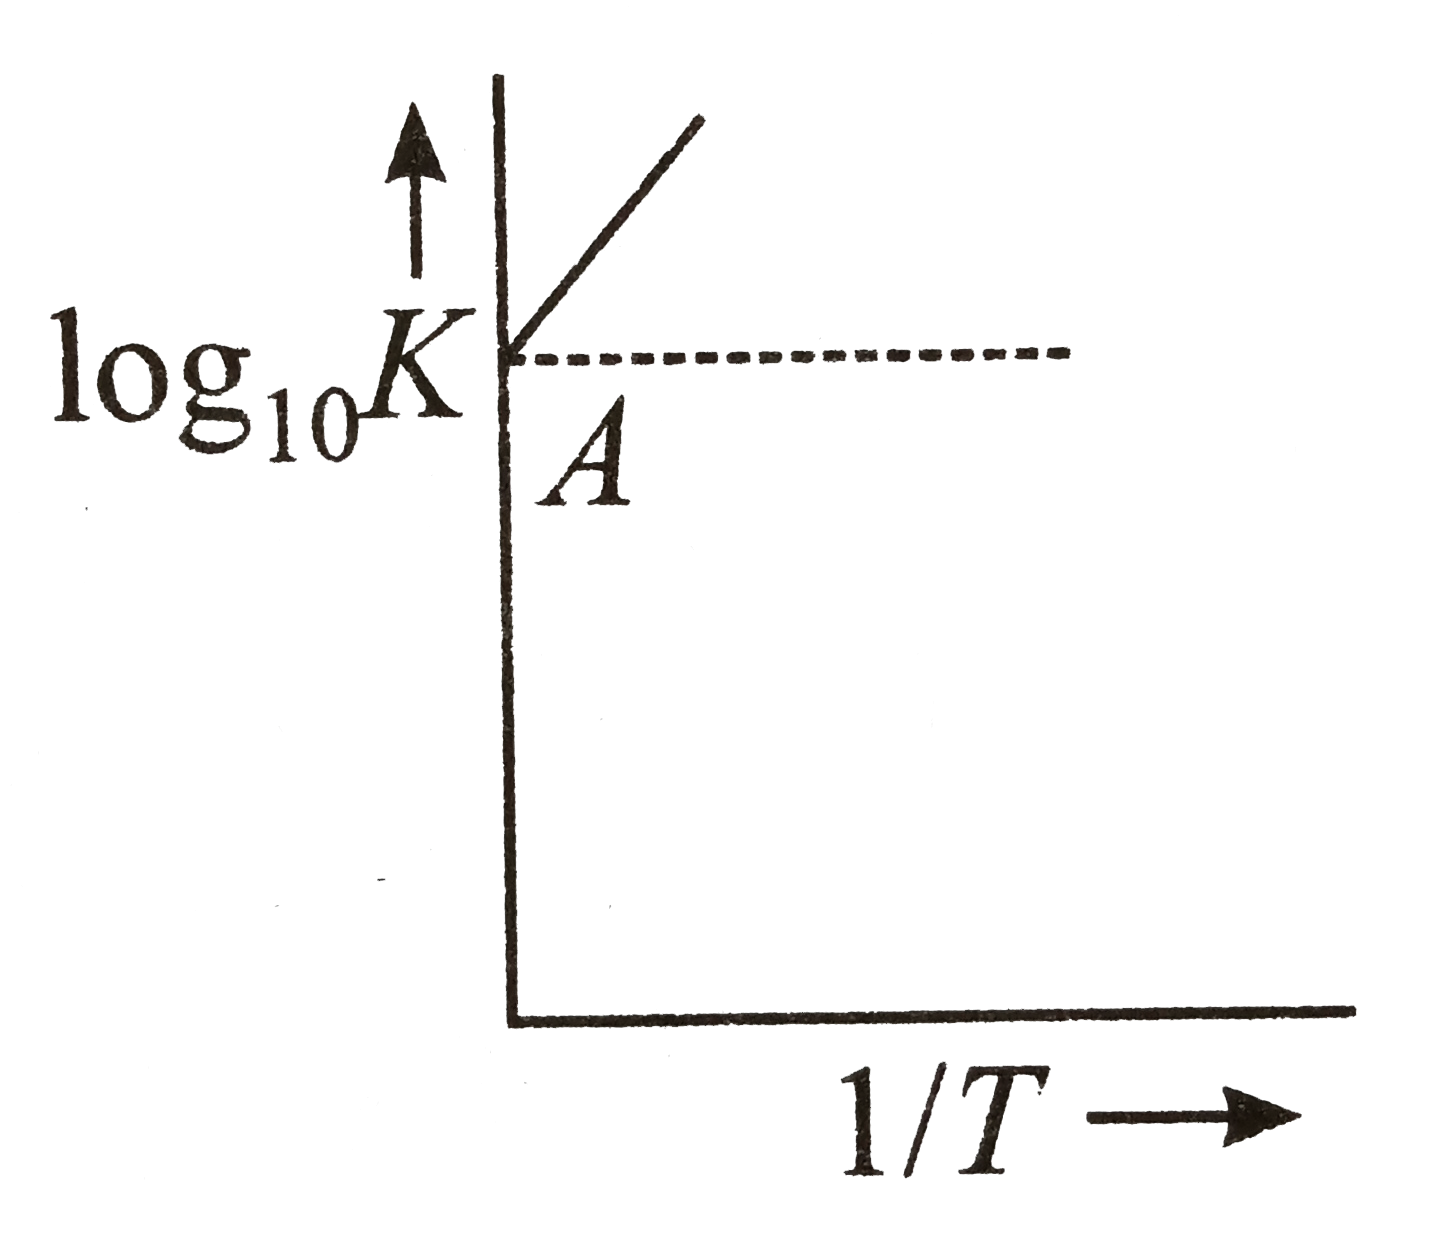
+4.606cal
−4.606cal
2cal
−2cal
The correct Answer is:B
K=Ae−ΔH/RT
logK=logA−ΔH2.303RT.
logK=logA−ΔH2.303R×1T.
logK=[−ΔH2.303R]×1T+logA.
(-DeltaH)/(2.303R)=1.<b>DeltaH=-2.303R=-4.606cal.
Topper's Solved these Questions
- CHEMICAL EQUILIBRIUMBOOK - RESONANCE ENGLISHCHAPTER - CHEMICAL EQUILIBRIUMEXERCISE - Advanced Level Problems (Part-2)(Section-2)
6 Videos
- CHEMICAL EQUILIBRIUMBOOK - RESONANCE ENGLISHCHAPTER - CHEMICAL EQUILIBRIUMEXERCISE - Advanced Level Problems (Part-2)(Section-3)
6 Videos
- CHEMICAL EQUILIBRIUMBOOK - RESONANCE ENGLISHCHAPTER - CHEMICAL EQUILIBRIUMEXERCISE - Advanced Level Problems (Part-1)
31 Videos
- CHEMICAL BONDINGBOOK - RESONANCE ENGLISHCHAPTER - CHEMICAL BONDINGEXERCISE - ORGANIC CHEMISTRY(Fundamental Concept )
6 Videos
- D & F-BLOCK ELEMENTS & THEIR IMPORTANT COMPOUNDS BOOK - RESONANCE ENGLISHCHAPTER - D & F-BLOCK ELEMENTS & THEIR IMPORTANT COMPOUNDS EXERCISE - Match the column
1 Videos
Similar Questions
Knowledge Check
Which of the following graph yield a straight line?
Ax/m vs pBlog x/m vs pCx/m vs log pDlog x/m vs log p
Which of the following graphs give a straight lines for the given properties of an ideal gas
View SolutionWhich of the following graph for a body moving along a straight line is possible ?
View SolutionThe graph between logk versus 1/T is a straight line.
View SolutionWhich of the following statement is not correc for following straight line graph :-

View SolutionThe acceleration (a)-time(t) graph for a particle moving along a straight from rest is shown in figure. Which of the following graph is the best representation of its velocity (v) with time (t) ?
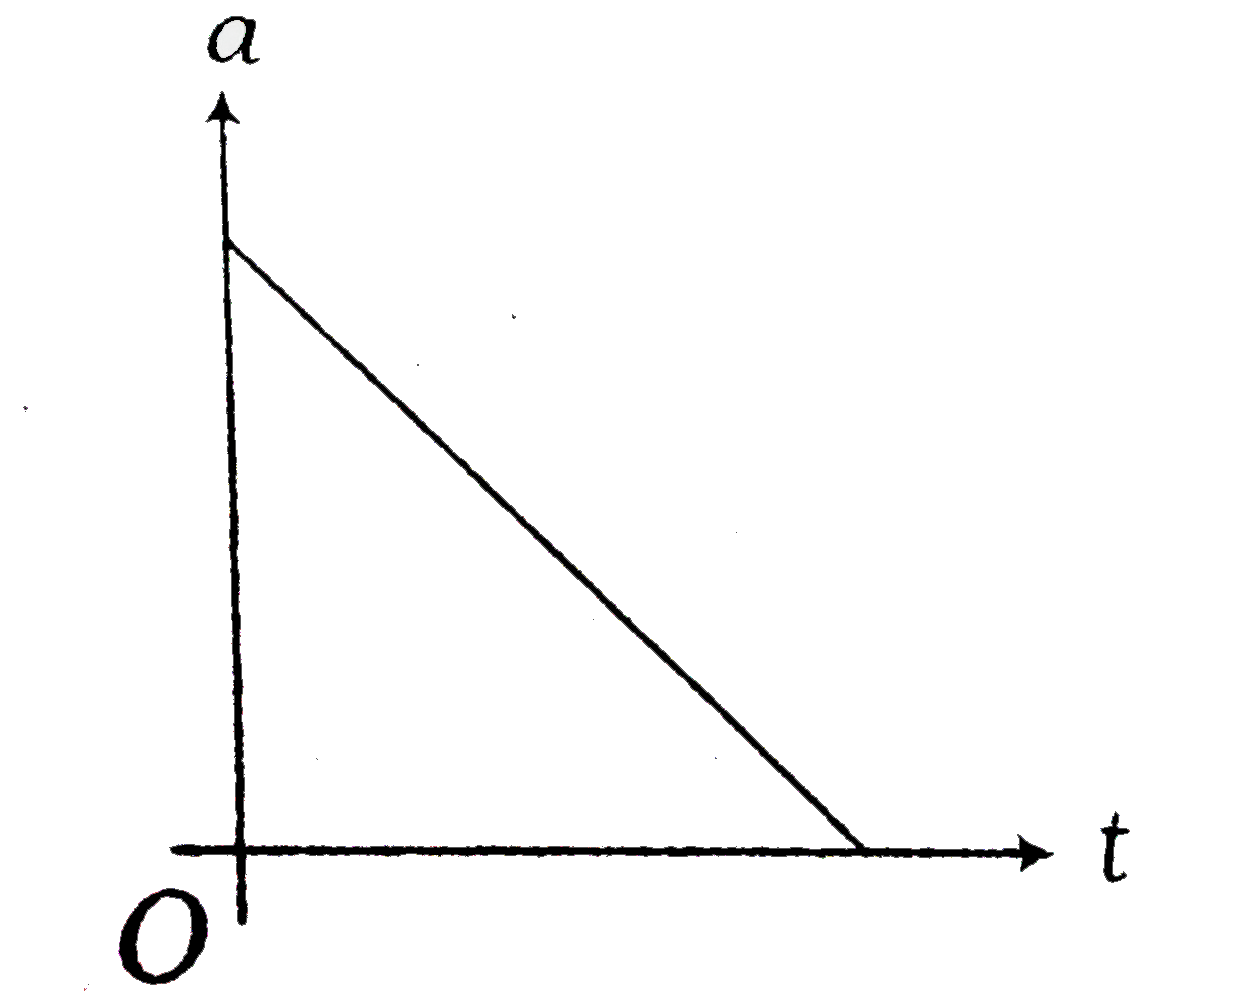
View SolutionThe acceleration (a)-time(t) graph for a particle moving along a straight from rest is shown in figur. Which of the following graph is the best representation of its velocity (v) with time (t) ?

View Solution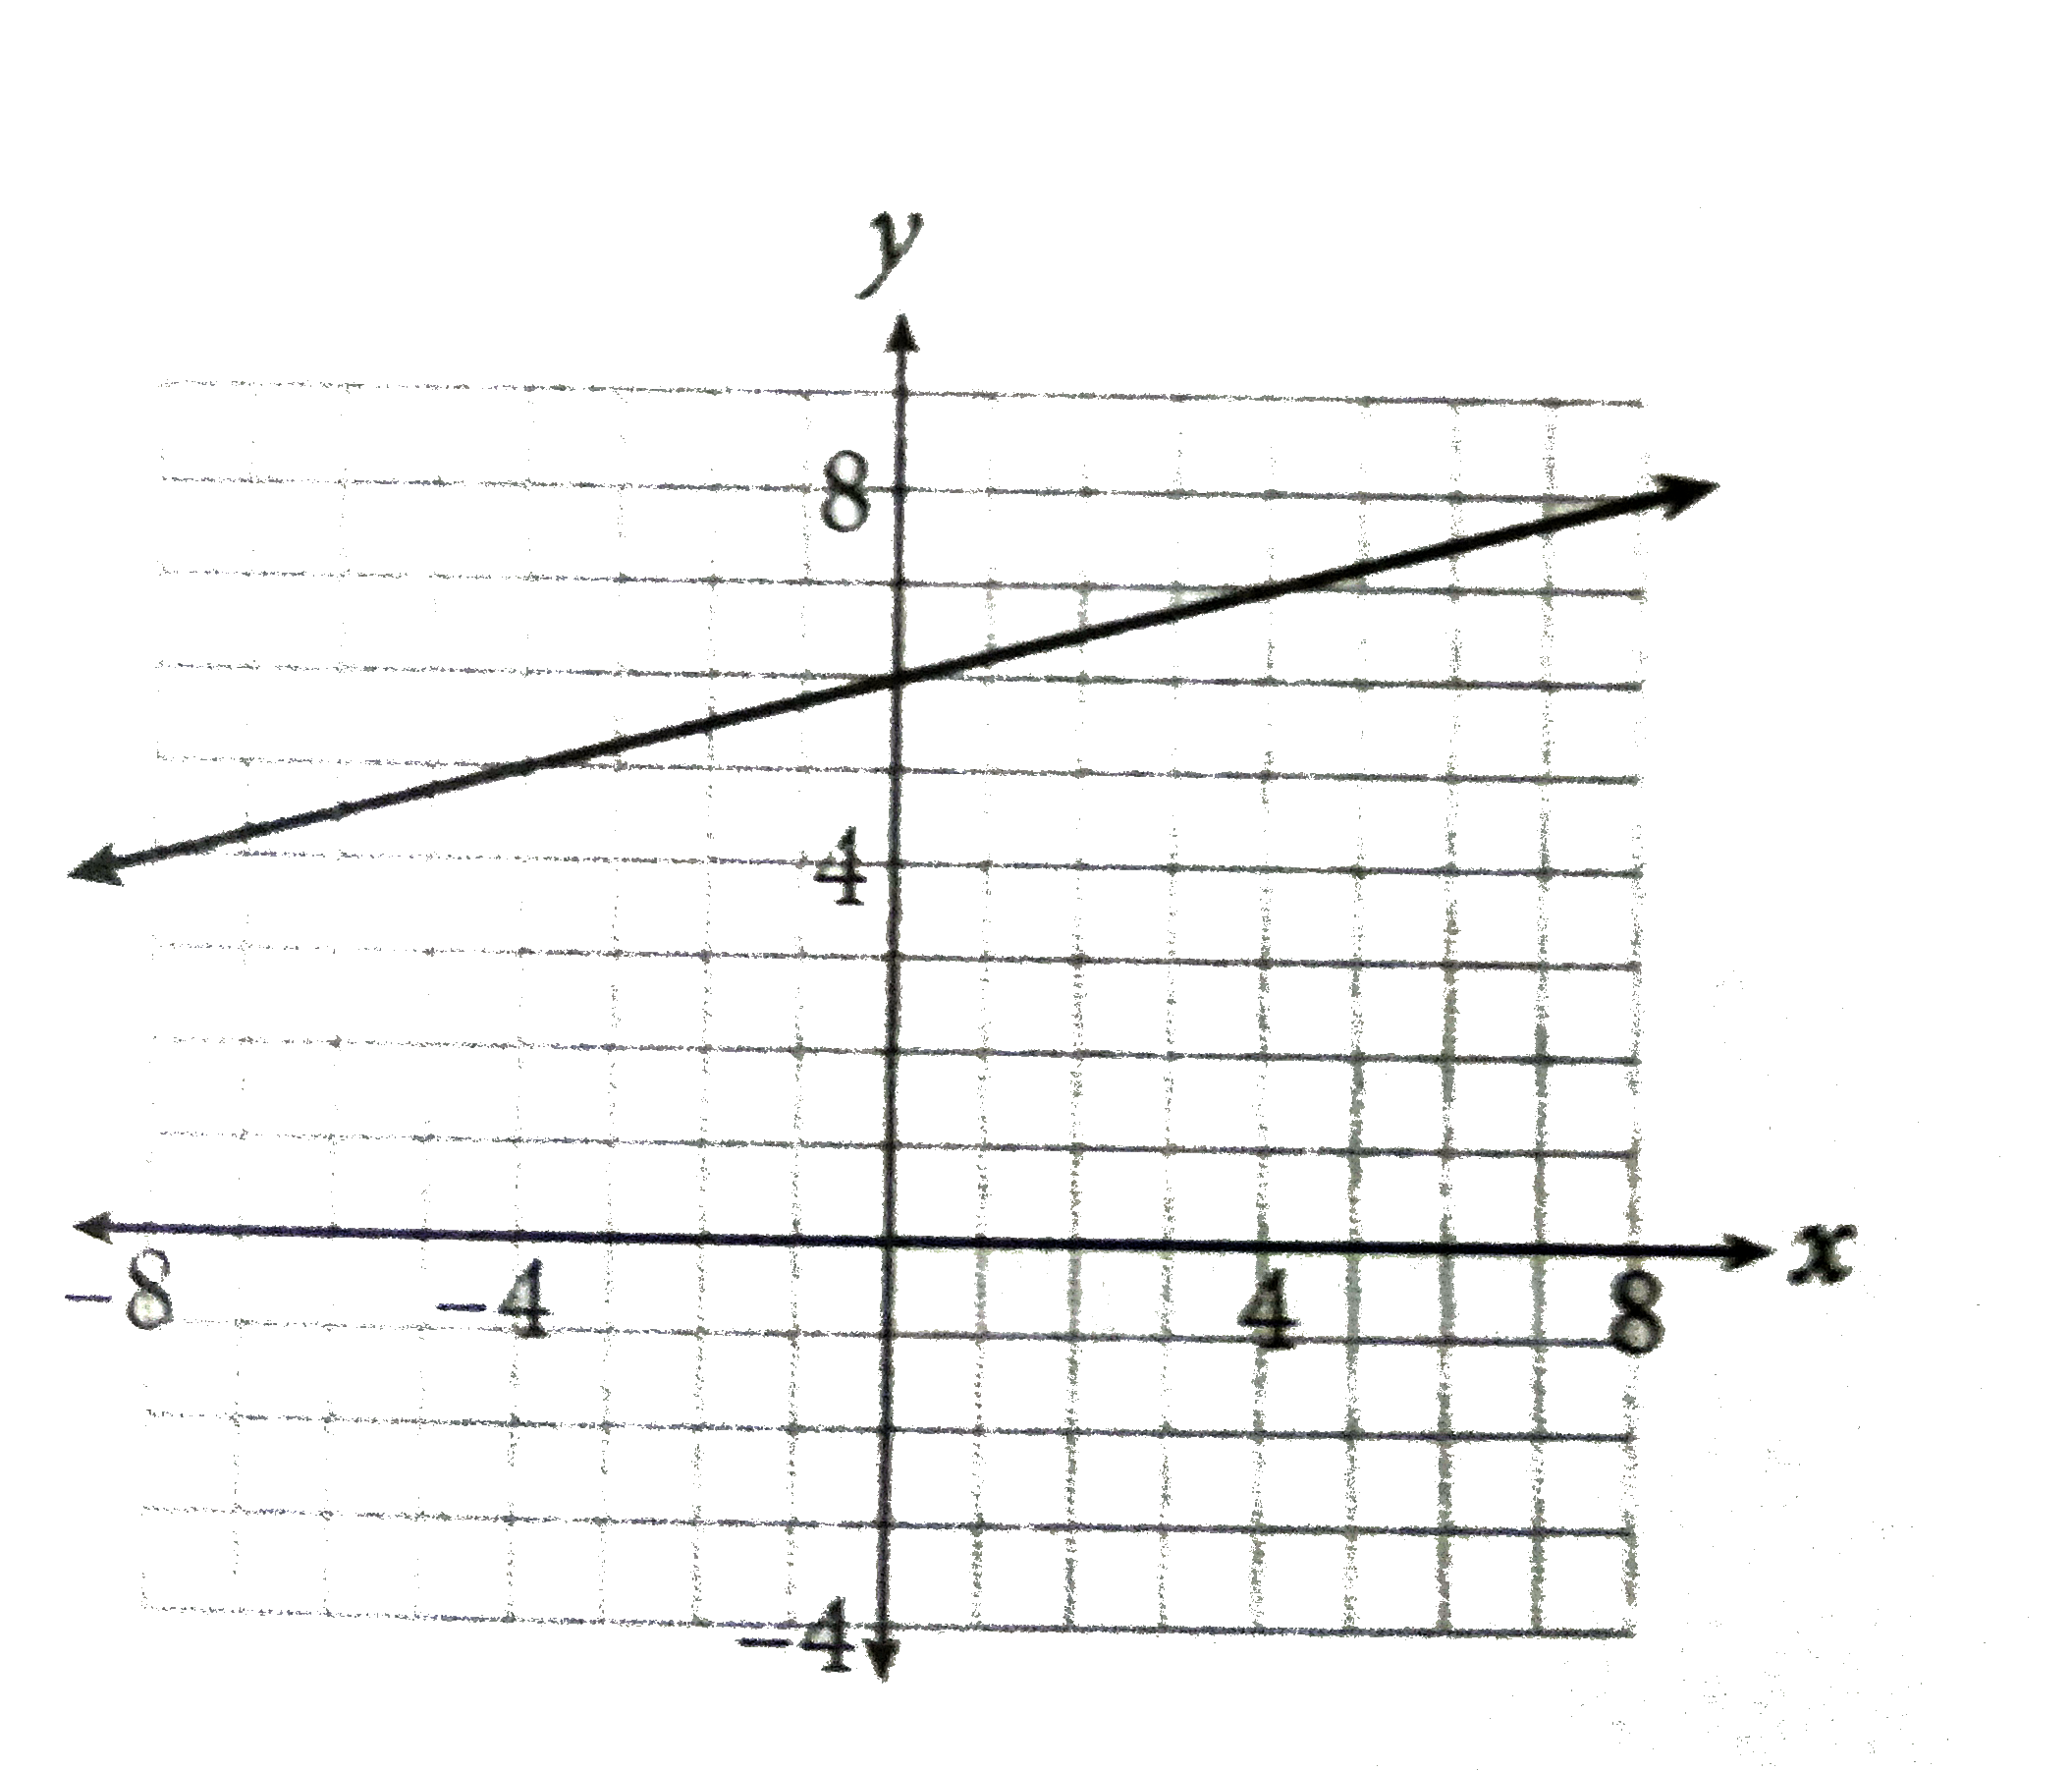
Which of the following equations represents the line shown in the graph?
View Solution

