The de Broglie wavelenght (λ) associated with a photoelectron varies with the frequency (v) of the incident radiation as,[v0 is threshold frequency]:
λ∝1(v−v0)32
λ∝1(v−v0)14
λ∝1(v−v0)12
λ∝1(v−v0)
The correct Answer is:C
E=hu
(hu−hr0)=K.E. (from photoelectric effect)
λ=h√2mK.E., λ∝h√(u−u0)⇒λ∝1(u−u0)1/2
Topper's Solved these Questions
- JEE MAIN REVISION TEST 5 (2020)BOOK - VMC MODULES ENGLISHCHAPTER - JEE MAIN REVISION TEST 5 (2020)EXERCISE - CHEMISTRY (SECTION 2)
5 Videos
- JEE MAIN REVISION TEST 11 (2020) BOOK - VMC MODULES ENGLISHCHAPTER - JEE MAIN REVISION TEST 11 (2020) EXERCISE - CHEMISTRY (SECTION - 2)
5 Videos
- JEE MAIN REVISION TEST 8 (2020)BOOK - VMC MODULES ENGLISHCHAPTER - JEE MAIN REVISION TEST 8 (2020)EXERCISE - CHEMISTRY (SECTION 2)
5 Videos
Similar Questions
Maximum kinetic energy (Ek) of a photoelectron varies with the frequency (v) of the incident radiation as
View SolutionDe Broglie wavelength λ associated with neutrons is related with absolute temperature T as
View SolutionThe de - Broglie wavelength associated with the particle of mass m moving with velocity v is
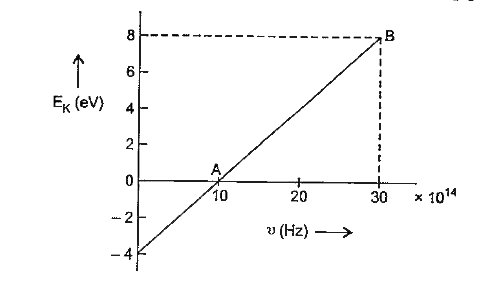
View SolutionIn an experiment of photo-electric effect, the graph of maximum kinetic energy Ek of the emitted photoelectrons versus the frequency v of the incident light is a straight line AB as shown in figure below :

Threshold frequency of the metal.
View SolutionThe group velocity of the de Broglie wave packet associated with a particle moving with velocity v is-
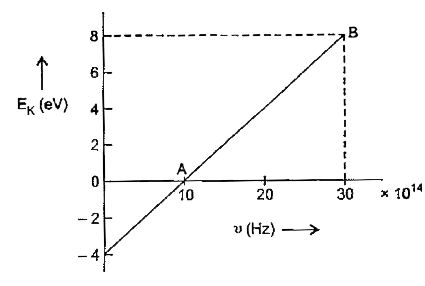
View SolutionIn an experiment of photoelectric effect, the graph of maximum kinetic energy EK of the emitted photoelectrons versus the frequency v of the incident light is a straight line AB as shown in Figure below:
Find : (i) Threshold frequency of the metal.
(ii) work function of the metal
(iii) Stopping potential for the photoelectrons emitted by the light of frequency v=30×1014 Hz.
View Solution(i) Plot a labelled graph of |Vs| where Vs is stopping potential versus frequency f of the incident radiation.
(ii) State how will you use this graph to determine the value of Planck.s constant.
View SolutionIn an experiment of photo-electric effect, the graph of maximum kinetic energy Ek of the emitted photoelectrons versus the frequency v of the incident light is a straight line AB as shown in figure below :

Stopping potential for the photoelectrons emitted by the light of frequency
v=30×1014Hz
View SolutionExplain giving reasons for the following :
(a) Photoelectric current in a photocell increases with the increase in intensity of the incident radiation.
(b) The stopping potential V0 varies linearly with the frequency ν of the incident radiation for a given photosensitive surface with the slope remaining the same for different surfaces.
(c) Maximum kinetic energy of the photoelectrons is independent of the intensity of incident radiation.
View SolutionThe threshold frequency for certain metal is v0. When light of frequency 2v0 is incident on it, the maximum velocity of photoelectrons is 4×10⁶ms−1. If the frequency of incident radiation is increaed to 5v0, then the maximum velocity of photoelectrons will be
View Solution
