If slope of curve is first positive, then zero and after that became negative, so best represented to following graph which satisfied above condition is :
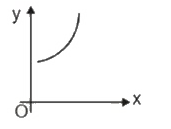
The correct Answer is:A
To solve the problem, we need to analyze the conditions given for the slope of the curve and identify the correct graph representation based on these conditions.
1. Understanding Slope Conditions:
- The slope of the curve is first positive, which means the tangent to the curve makes an angle with the x-axis that is greater than 0 degrees and less than 90 degrees.
- The slope then becomes zero, which means the tangent to the curve is horizontal, making an angle of exactly 0 degrees with the x-axis.
- Finally, the slope becomes negative, meaning the tangent makes an angle greater than 90 degrees and less than 180 degrees with the x-axis.
2. Analyzing Each Graph:
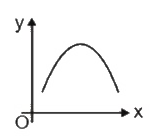
- Graph 1: Check if the slope is positive, then zero, and then negative.
- Initially, if the curve is rising (positive slope), then it levels off (zero slope), and then it falls (negative slope). This graph satisfies all conditions.
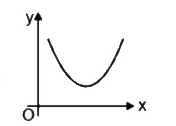
- Graph 2: Check if the slope is positive, then zero, and then negative.
- If the curve rises but then drops immediately to a negative slope without reaching zero, this graph does not satisfy the conditions.
- Graph 3: Check if the slope is positive, then zero, and then negative.
- Similar to Graph 2, if the curve does not level off to zero before becoming negative, this graph does not satisfy the conditions.
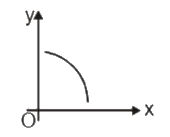
- Graph 4: Check if the slope is positive, then zero, and then negative.
- If the curve rises, levels off to zero, and then falls, this graph satisfies all conditions.
3. Conclusion:
- The graphs that satisfy the condition of having a positive slope, then zero slope, and finally a negative slope are Graph 1 and Graph 4.
- Therefore, the best representation of the curve is Graph 1 (or Graph 4 if applicable).
Final Answer:
The best representation of the curve that satisfies the conditions is Graph 1 (and possibly Graph 4).
- The slope of the curve is first positive, which means the tangent to the curve makes an angle with the x-axis that is greater than 0 degrees and less than 90 degrees.
- The slope then becomes zero, which means the tangent to the curve is horizontal, making an angle of exactly 0 degrees with the x-axis.
- Finally, the slope becomes negative, meaning the tangent makes an angle greater than 90 degrees and less than 180 degrees with the x-axis.
- Graph 1: Check if the slope is positive, then zero, and then negative.
- Initially, if the curve is rising (positive slope), then it levels off (zero slope), and then it falls (negative slope). This graph satisfies all conditions.
- Graph 2: Check if the slope is positive, then zero, and then negative.
- If the curve rises but then drops immediately to a negative slope without reaching zero, this graph does not satisfy the conditions.
- Graph 3: Check if the slope is positive, then zero, and then negative.
- Similar to Graph 2, if the curve does not level off to zero before becoming negative, this graph does not satisfy the conditions.
- Graph 4: Check if the slope is positive, then zero, and then negative.
- If the curve rises, levels off to zero, and then falls, this graph satisfies all conditions.
- The graphs that satisfy the condition of having a positive slope, then zero slope, and finally a negative slope are Graph 1 and Graph 4.
- Therefore, the best representation of the curve is Graph 1 (or Graph 4 if applicable).
The best representation of the curve that satisfies the conditions is Graph 1 (and possibly Graph 4).
Topper's Solved these Questions
- BASIC MATHEMATICS & VECTORSBOOK - VMC MODULES ENGLISHCHAPTER - BASIC MATHEMATICS & VECTORSEXERCISE - Efficient
50 Videos
- BASIC MATHEMATICS & VECTORSBOOK - VMC MODULES ENGLISHCHAPTER - BASIC MATHEMATICS & VECTORSEXERCISE - Impeccable
50 Videos
- BASIC MATHEMATICS & VECTORSBOOK - VMC MODULES ENGLISHCHAPTER - BASIC MATHEMATICS & VECTORSEXERCISE - Impeccable
50 Videos
- CAPACITORSBOOK - VMC MODULES ENGLISHCHAPTER - CAPACITORSEXERCISE - JEE Advance ( Archive ) LEVEL 48
1 Videos
Similar Questions
Knowledge Check
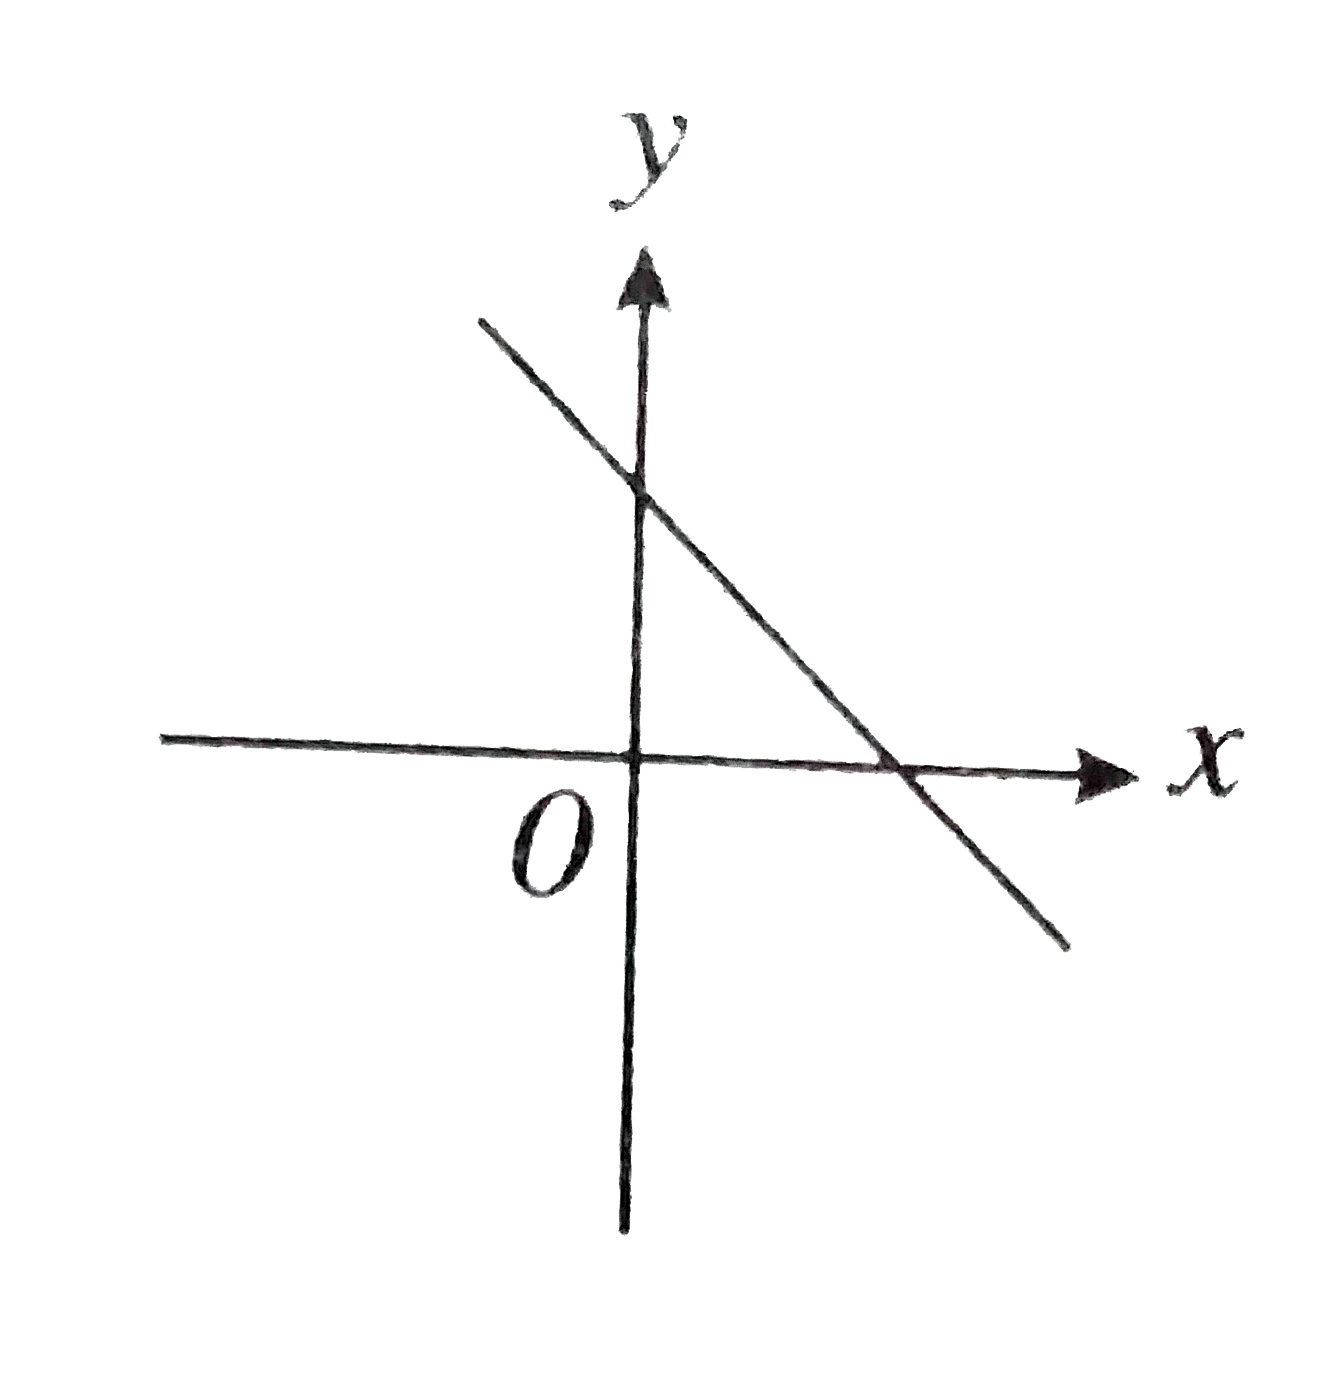
Which of the following could be the equation of the line represented in the graph above?Ay=2x+4By=2x-4Cy=-2x-1Dy=-2x+4The distance above the ground is represented by positive integers and the distance below the ground by negative integers. An elevator begins to descend from 15 m above the ground at a rate of 5 m per second. What will be its position after 45 seconds?
A−240 mB−200 mC−220 mD−210 m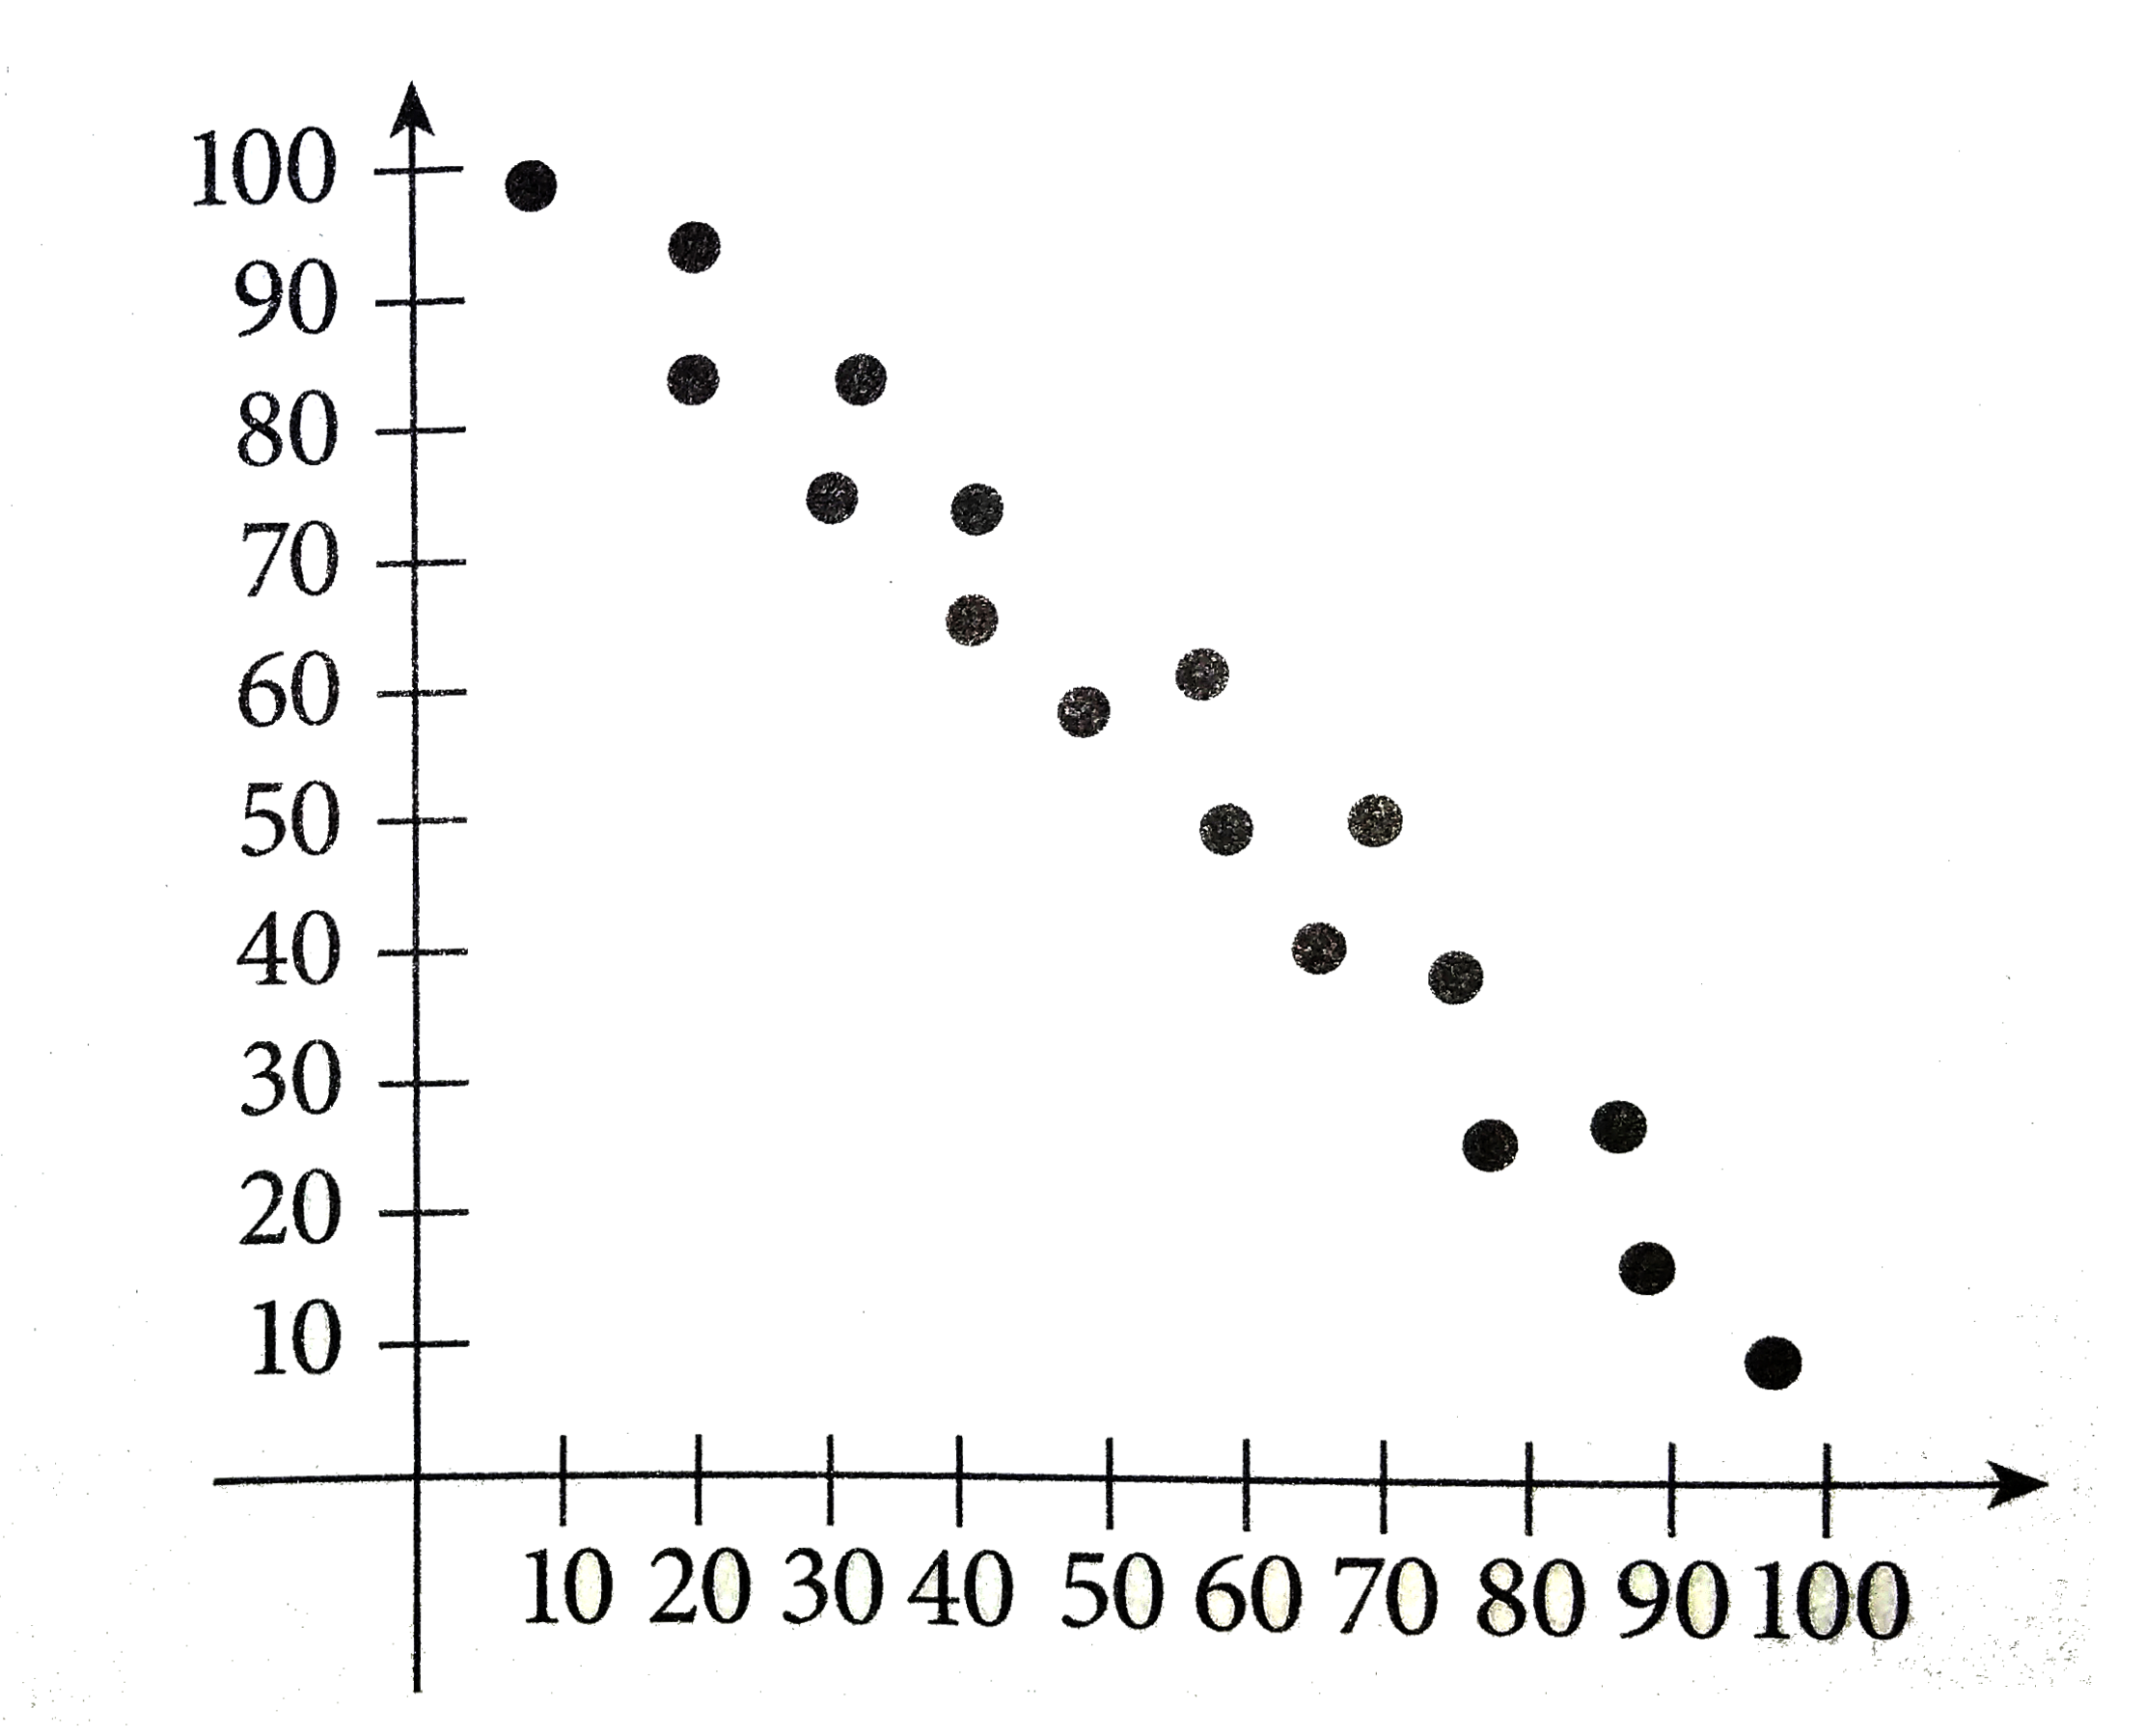
Which of the following is most likely the slope of the line of best fit for the scatterplot above?A−10B−1C1D10
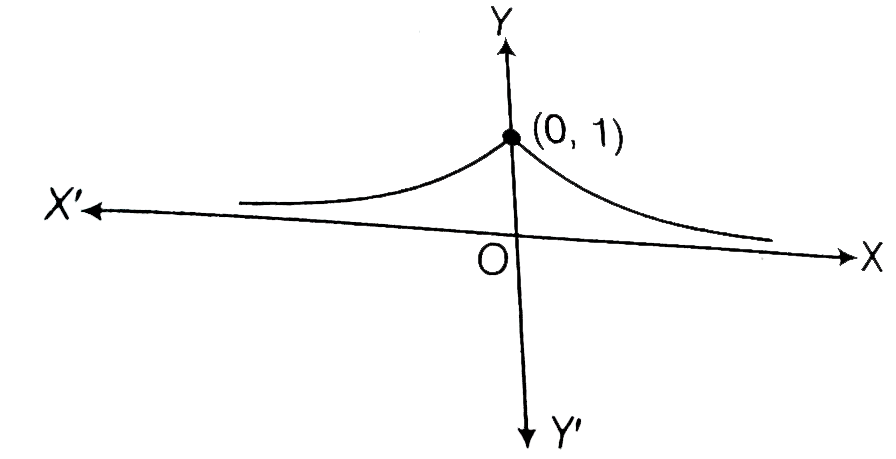
Which one of the following function best represents the graphs as shown below?
View SolutionSTATEMENT - 1 : All accelerated object are represented on position-time graphs by curved lines.
STATEMENT - 2 : An object with a positive velocity will be represented on a position-time graph by a line with a positive slope.
STATEMENT - 3 : An object with a negative velocity will be represented on a position-time graph by a line with a negative slope.
View Solutionfigure depicts a block sliding along a frictionless ramp in vertical plane Eight numbered arrows in the diagram repreesent direction to be referred to when answering the questions
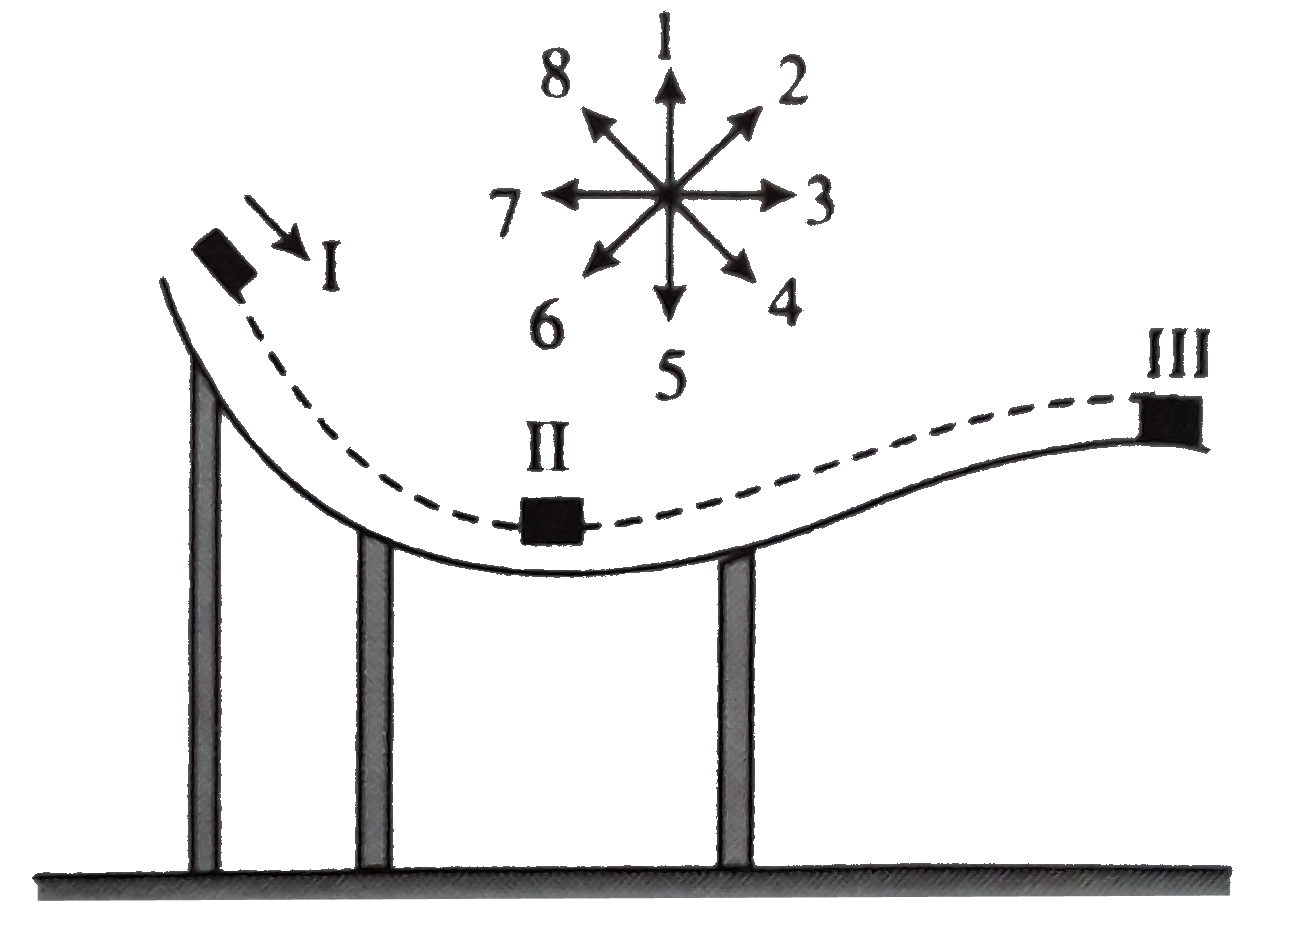
Position - i : Starts sliding on curve path
Position - ii : Lowest position of the curve path
Position - iii : Just outside of the curve path
The direction of the acceleration of the blocks (after leaving the ramp) at position i is best represented by which of the arrows in the diagram?
View Solutionfigure depicts a block sliding along a frictionless ramp in vertical plane Eight numbered arrows in the diagram repreesent direction to be referred to when answering the questions
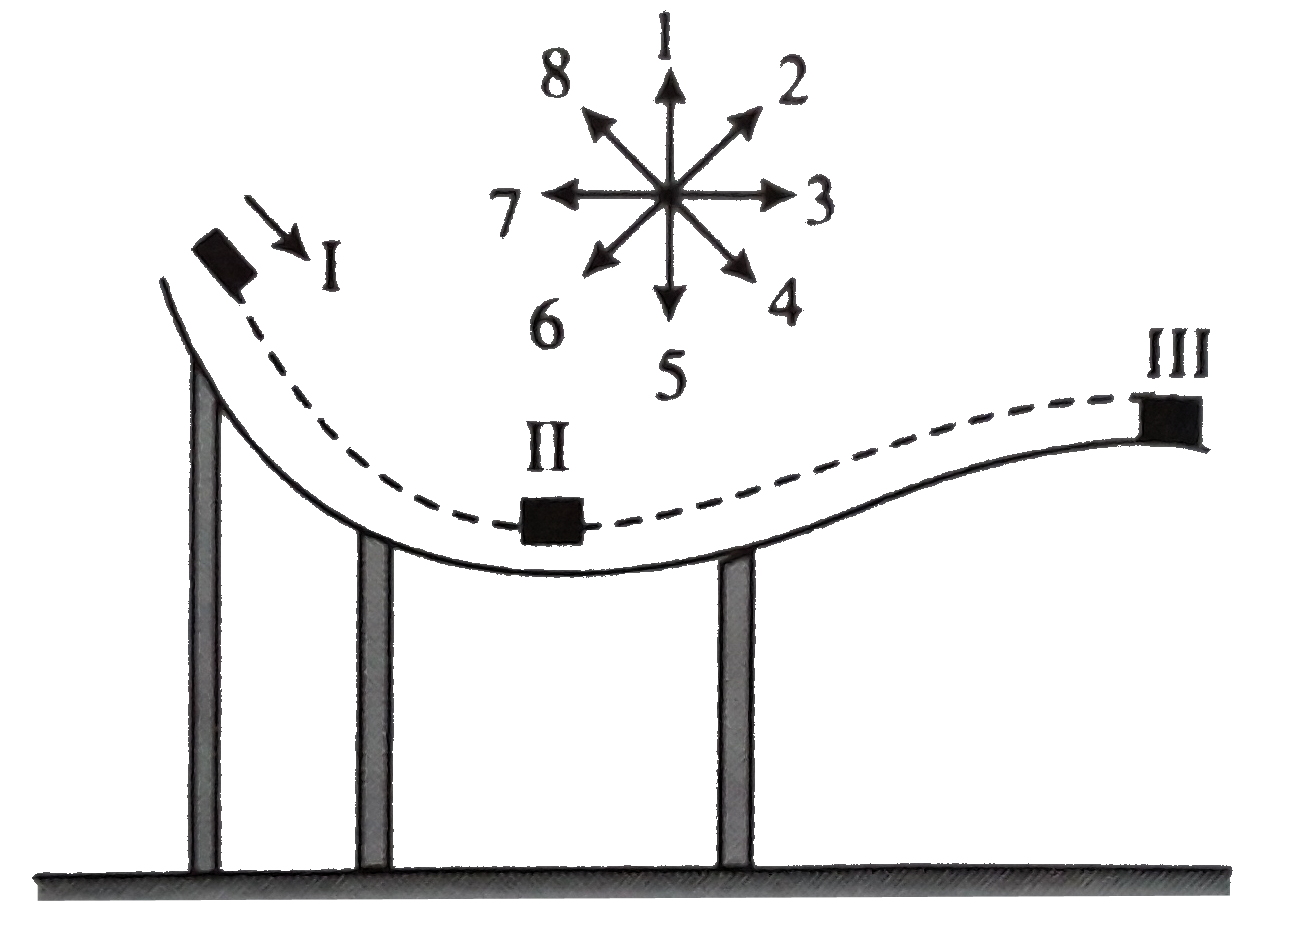
Position - i : Starts sliding on curve path
Position - ii : Lowest position of the curve path
Position - iii : Just outside of the curve path
The direction of the acceleration of the blocks when in position ii is best represented by which of the arrows in the diagram?
View SolutionWhich of the following graphs best represents the variation of acceleration 'a' with displacement x?
View Solution

