The relationship y=3x is best represent at :
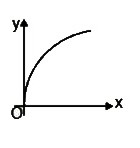
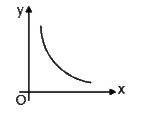
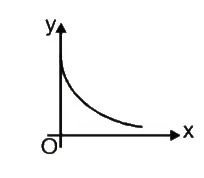
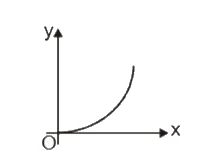
The correct Answer is:B
To solve the problem of representing the relationship y=3x, we will analyze the behavior of the function and plot its graph step by step.
Step 1: Understand the function
The given function is y=3x. This is a hyperbolic function, which means it will have certain characteristics based on the values of x.
Hint: Consider the behavior of the function as x approaches different values, especially zero and infinity.
Step 2: Analyze the function at critical points
1. When x=0:
- The function y=3x is undefined because division by zero is not possible. Therefore, y approaches infinity as x approaches zero from the right (positive side).
- Conclusion: As x→0+, y→+∞.
2. When x is positive and approaches infinity:
- As x increases, y=3x approaches zero. This means that for very large values of x, y becomes very small.
- Conclusion: As x→+∞, y→0.
3. When x is negative:
- If x is negative, y will also be negative. For example, if x=−1, then y=−3; if x=−2, then y=−1.5, and so on.
- As x approaches zero from the left (negative side), y approaches negative infinity.
- Conclusion: As x→0−, y→−∞.
Step 3: Graph the function
Now that we have analyzed the behavior of the function, we can plot it:
- The graph will have two branches: one in the first quadrant (where x>0 and y>0) and one in the third quadrant (where x<0 and y<0).
- The graph will approach the x-axis (y = 0) as x goes to infinity and will approach the y-axis (x = 0) as y goes to infinity.
Step 4: Identify the correct representation
From the analysis, we can conclude that:
- The function has vertical asymptote at x=0 (where y approaches infinity).
- The function has horizontal asymptote at y=0 (as x approaches infinity).
Therefore, the best representation of the relationship y=3x is a hyperbola that opens towards the first and third quadrants.
Final Conclusion: The correct option that represents the relationship y=3x is the one that shows the hyperbolic nature with the asymptotes as described.
The given function is y=3x. This is a hyperbolic function, which means it will have certain characteristics based on the values of x.
1. When x=0:
- The function y=3x is undefined because division by zero is not possible. Therefore, y approaches infinity as x approaches zero from the right (positive side).
- Conclusion: As x→0+, y→+∞.
- As x increases, y=3x approaches zero. This means that for very large values of x, y becomes very small.
- Conclusion: As x→+∞, y→0.
- If x is negative, y will also be negative. For example, if x=−1, then y=−3; if x=−2, then y=−1.5, and so on.
- As x approaches zero from the left (negative side), y approaches negative infinity.
- Conclusion: As x→0−, y→−∞.
Now that we have analyzed the behavior of the function, we can plot it:
- The graph will have two branches: one in the first quadrant (where x>0 and y>0) and one in the third quadrant (where x<0 and y<0).
- The graph will approach the x-axis (y = 0) as x goes to infinity and will approach the y-axis (x = 0) as y goes to infinity.
From the analysis, we can conclude that:
- The function has vertical asymptote at x=0 (where y approaches infinity).
- The function has horizontal asymptote at y=0 (as x approaches infinity).
Topper's Solved these Questions
- BASIC MATHEMATICS & VECTORSBOOK - VMC MODULES ENGLISHCHAPTER - BASIC MATHEMATICS & VECTORSEXERCISE - Efficient
50 Videos
- BASIC MATHEMATICS & VECTORSBOOK - VMC MODULES ENGLISHCHAPTER - BASIC MATHEMATICS & VECTORSEXERCISE - Impeccable
50 Videos
- BASIC MATHEMATICS & VECTORSBOOK - VMC MODULES ENGLISHCHAPTER - BASIC MATHEMATICS & VECTORSEXERCISE - Impeccable
50 Videos
- CAPACITORSBOOK - VMC MODULES ENGLISHCHAPTER - CAPACITORSEXERCISE - JEE Advance ( Archive ) LEVEL 48
1 Videos
Similar Questions
Knowledge Check
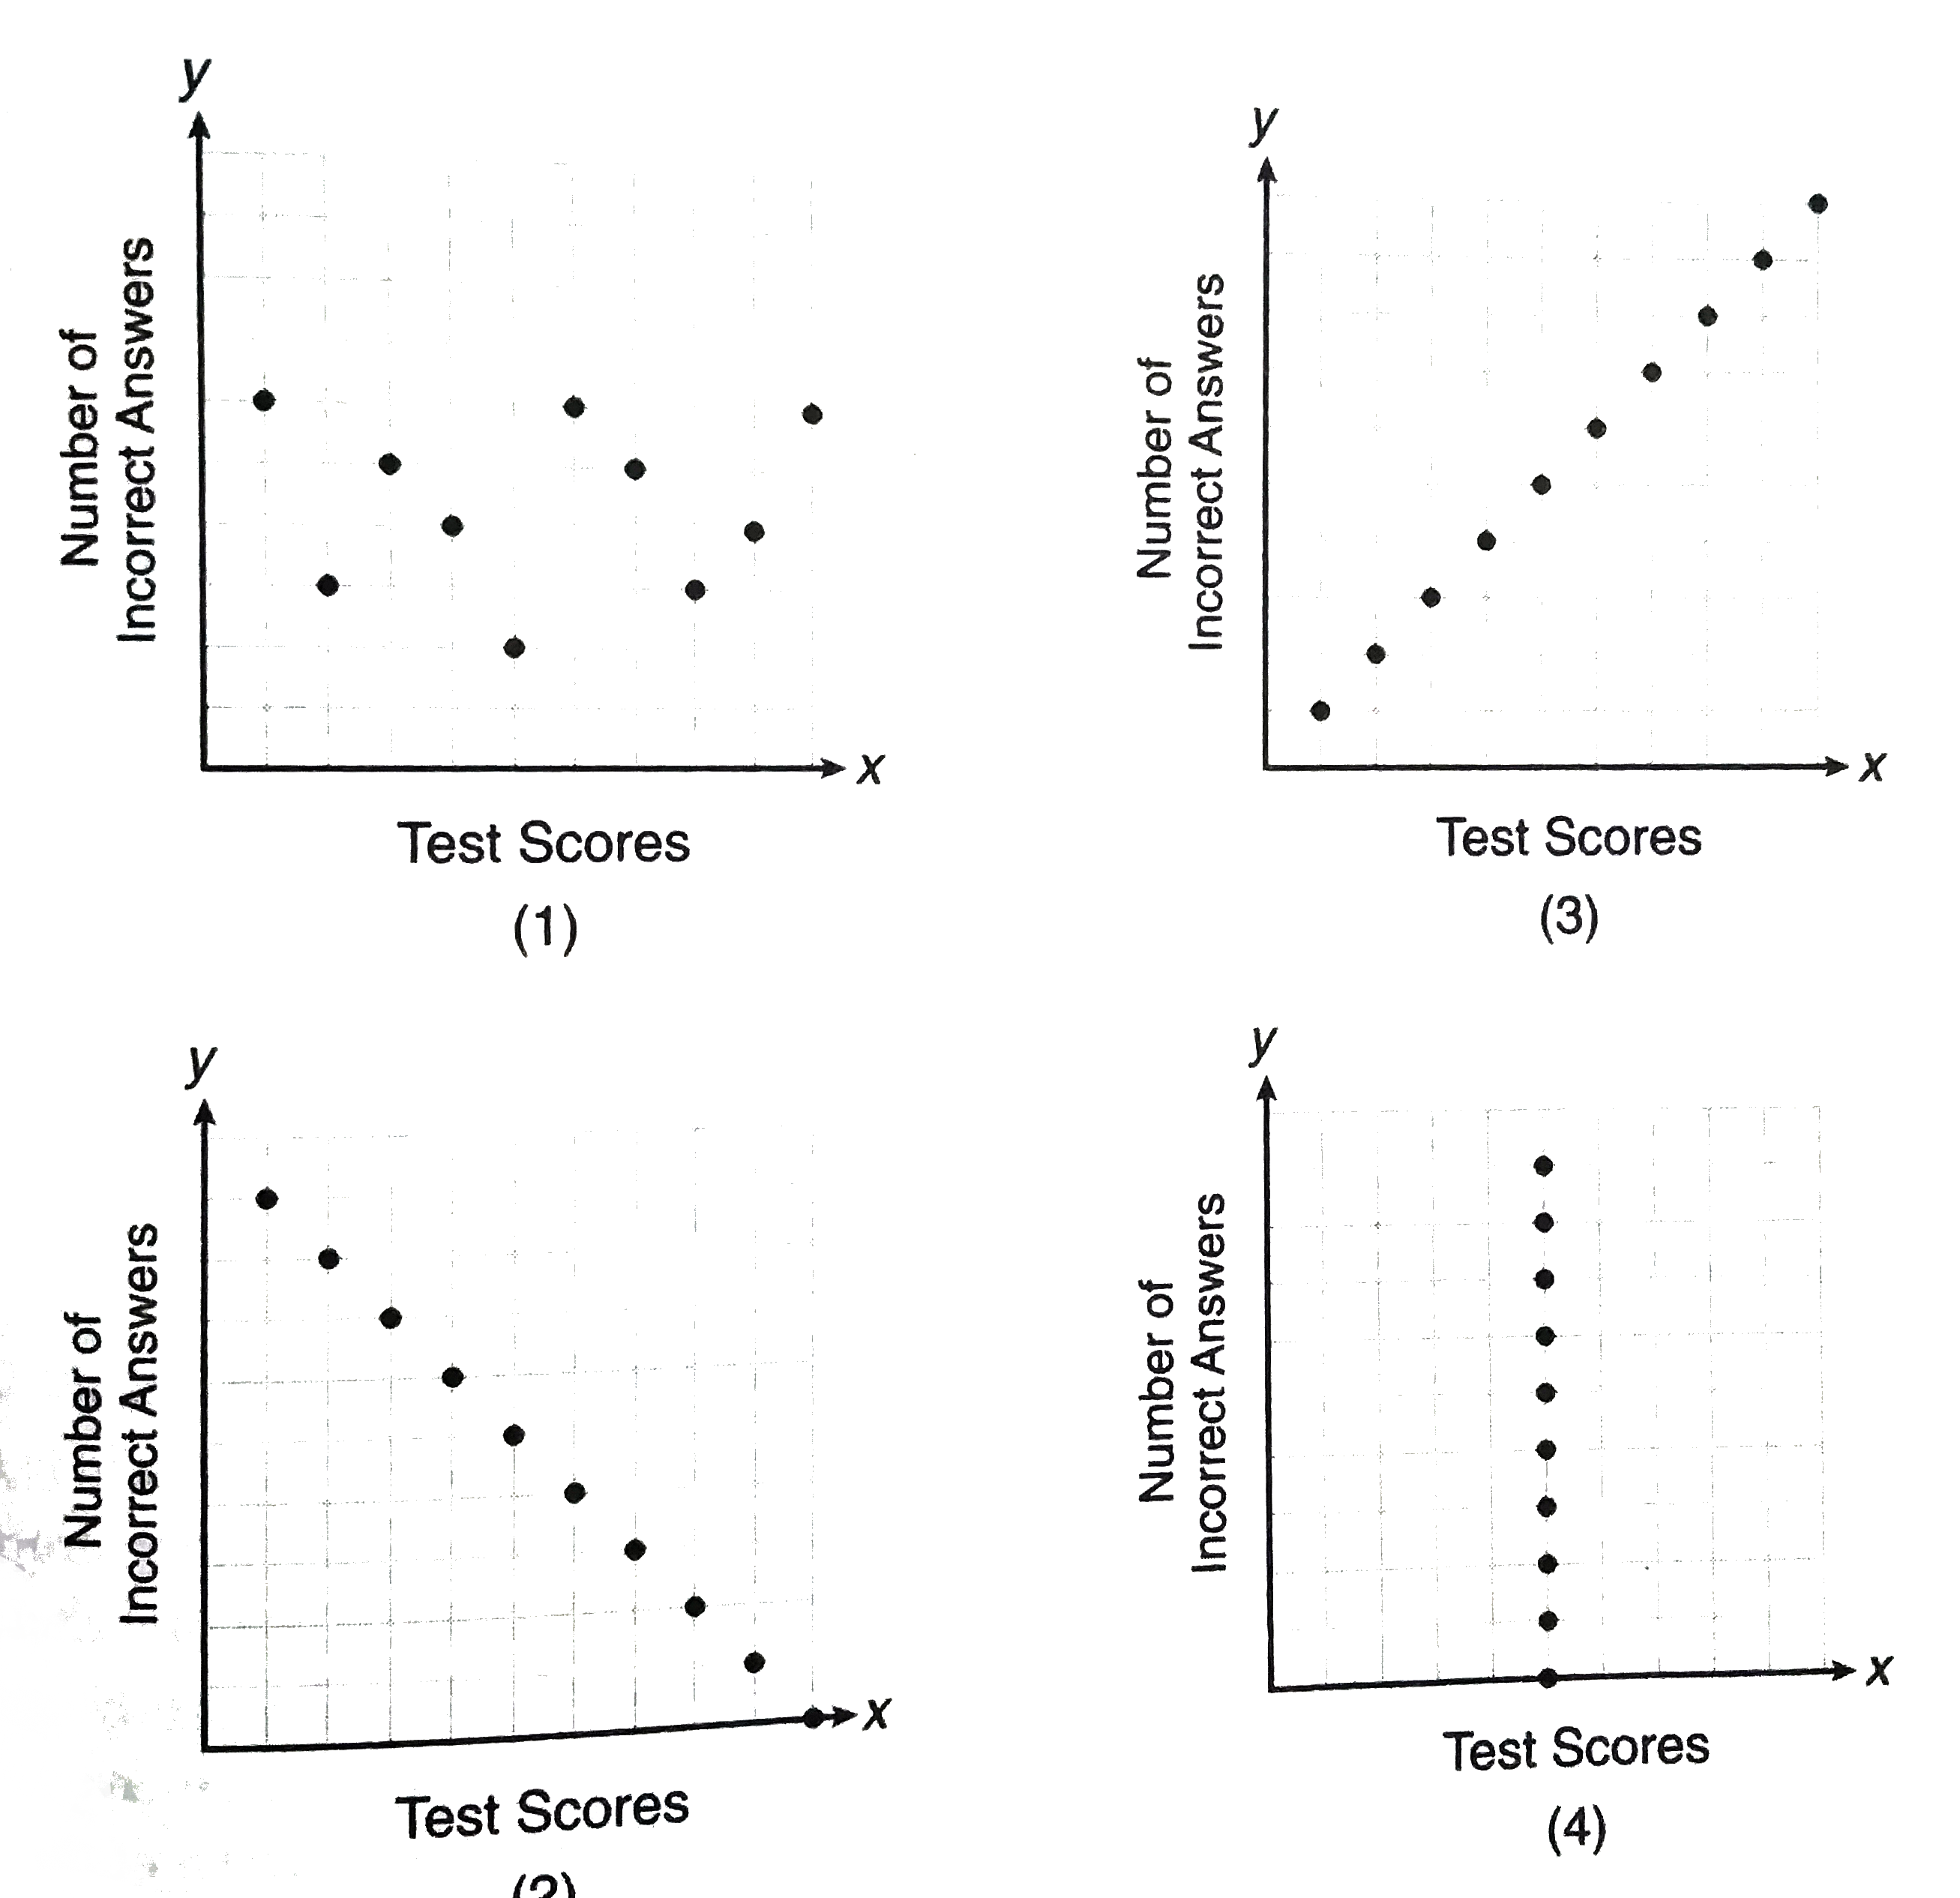
Which of the four graphs above best shows the relationship between x and y if x represents a student score on a test and y represents the number of incorrect answers a student received on the same test?AGraph (1)BGraph (2)CGraph (3)DGraph (4)The phase relationship between current and voltage in a pure resistive circuit is best represented by
A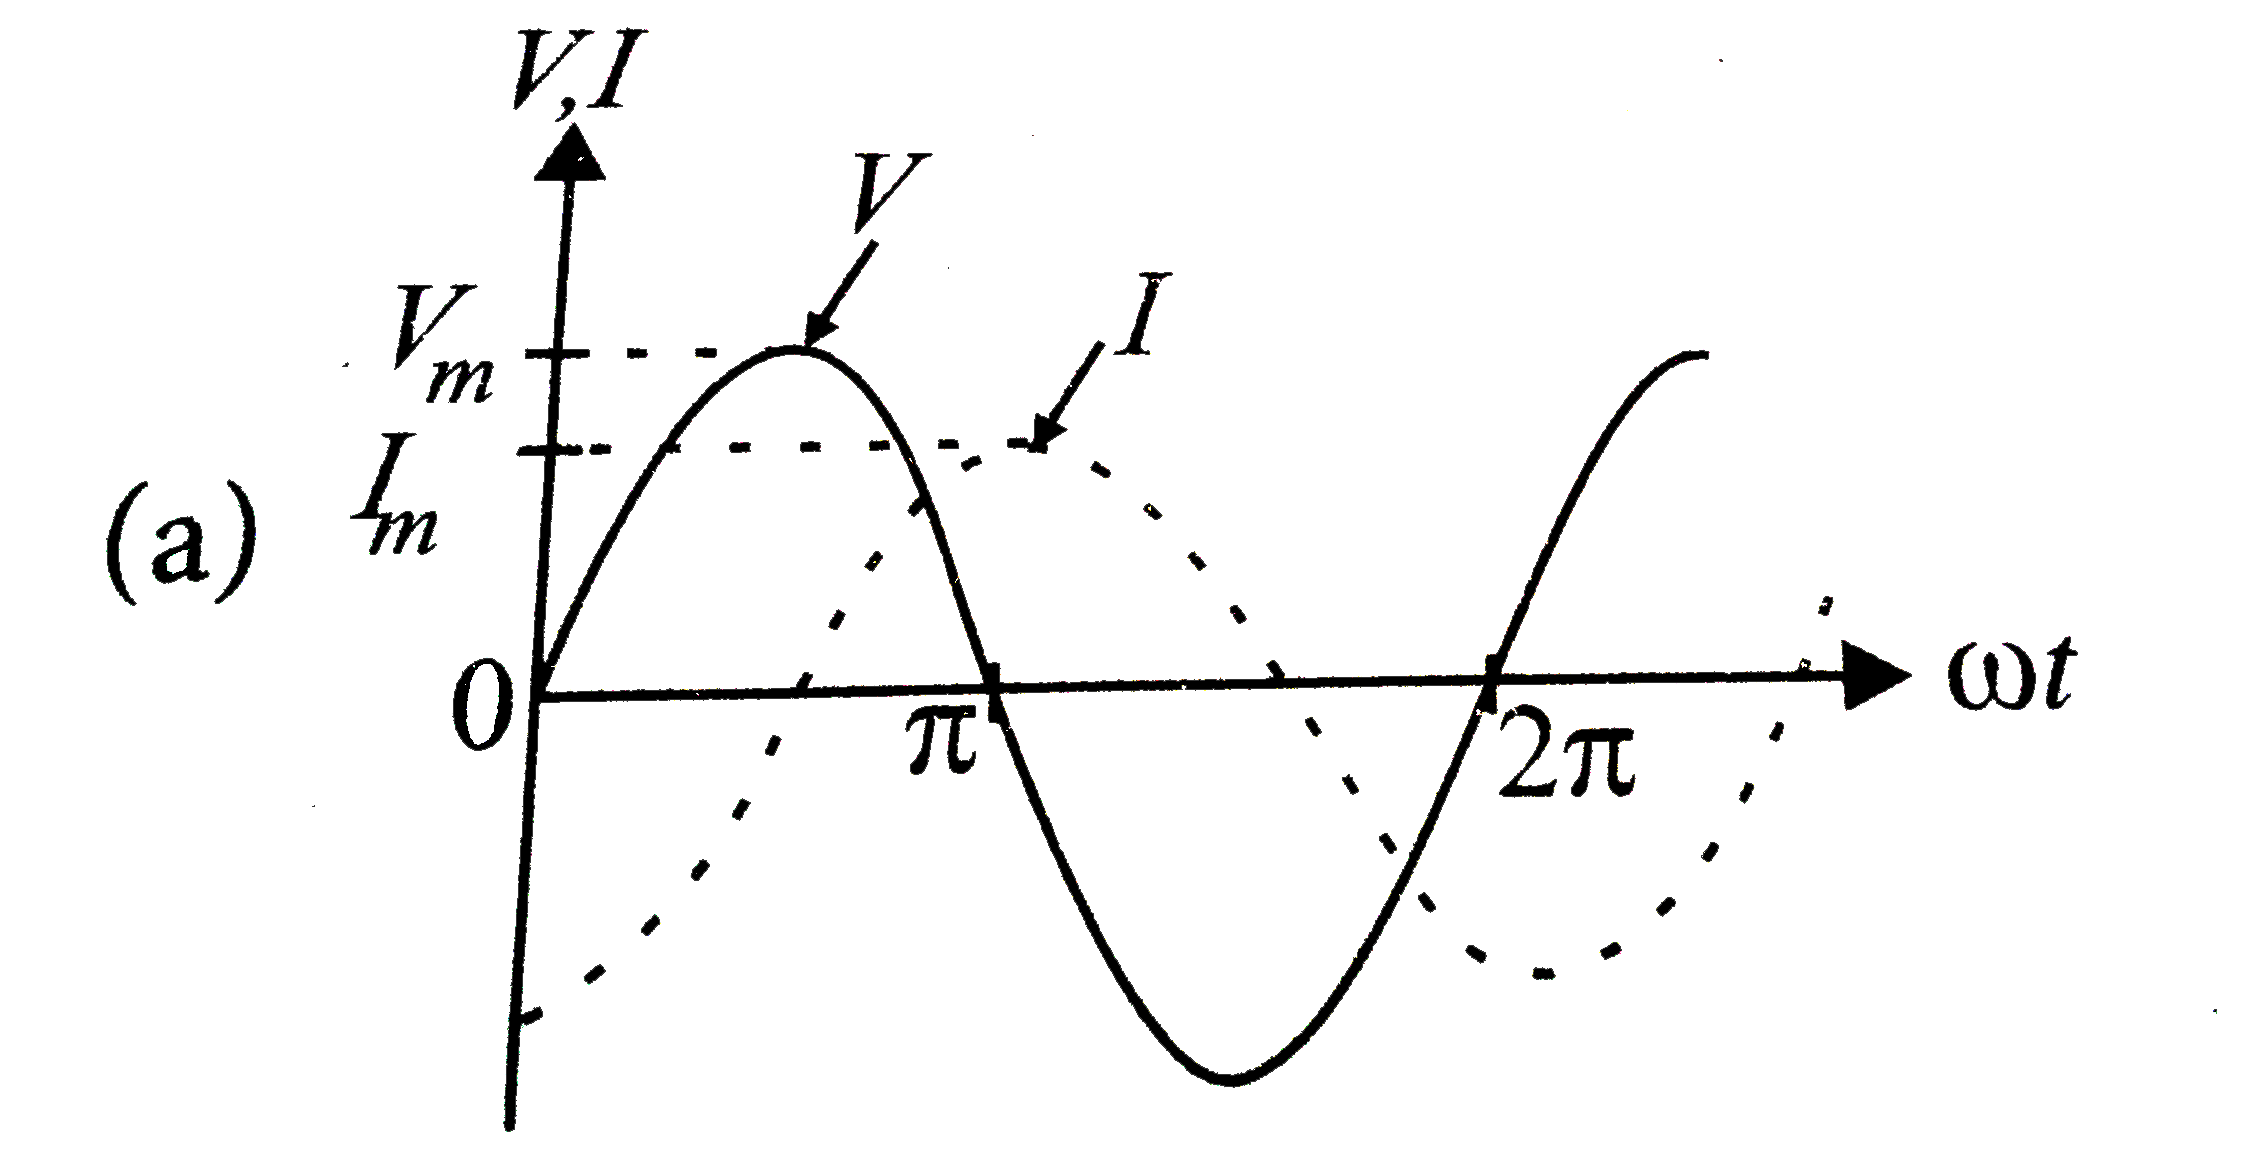 B
B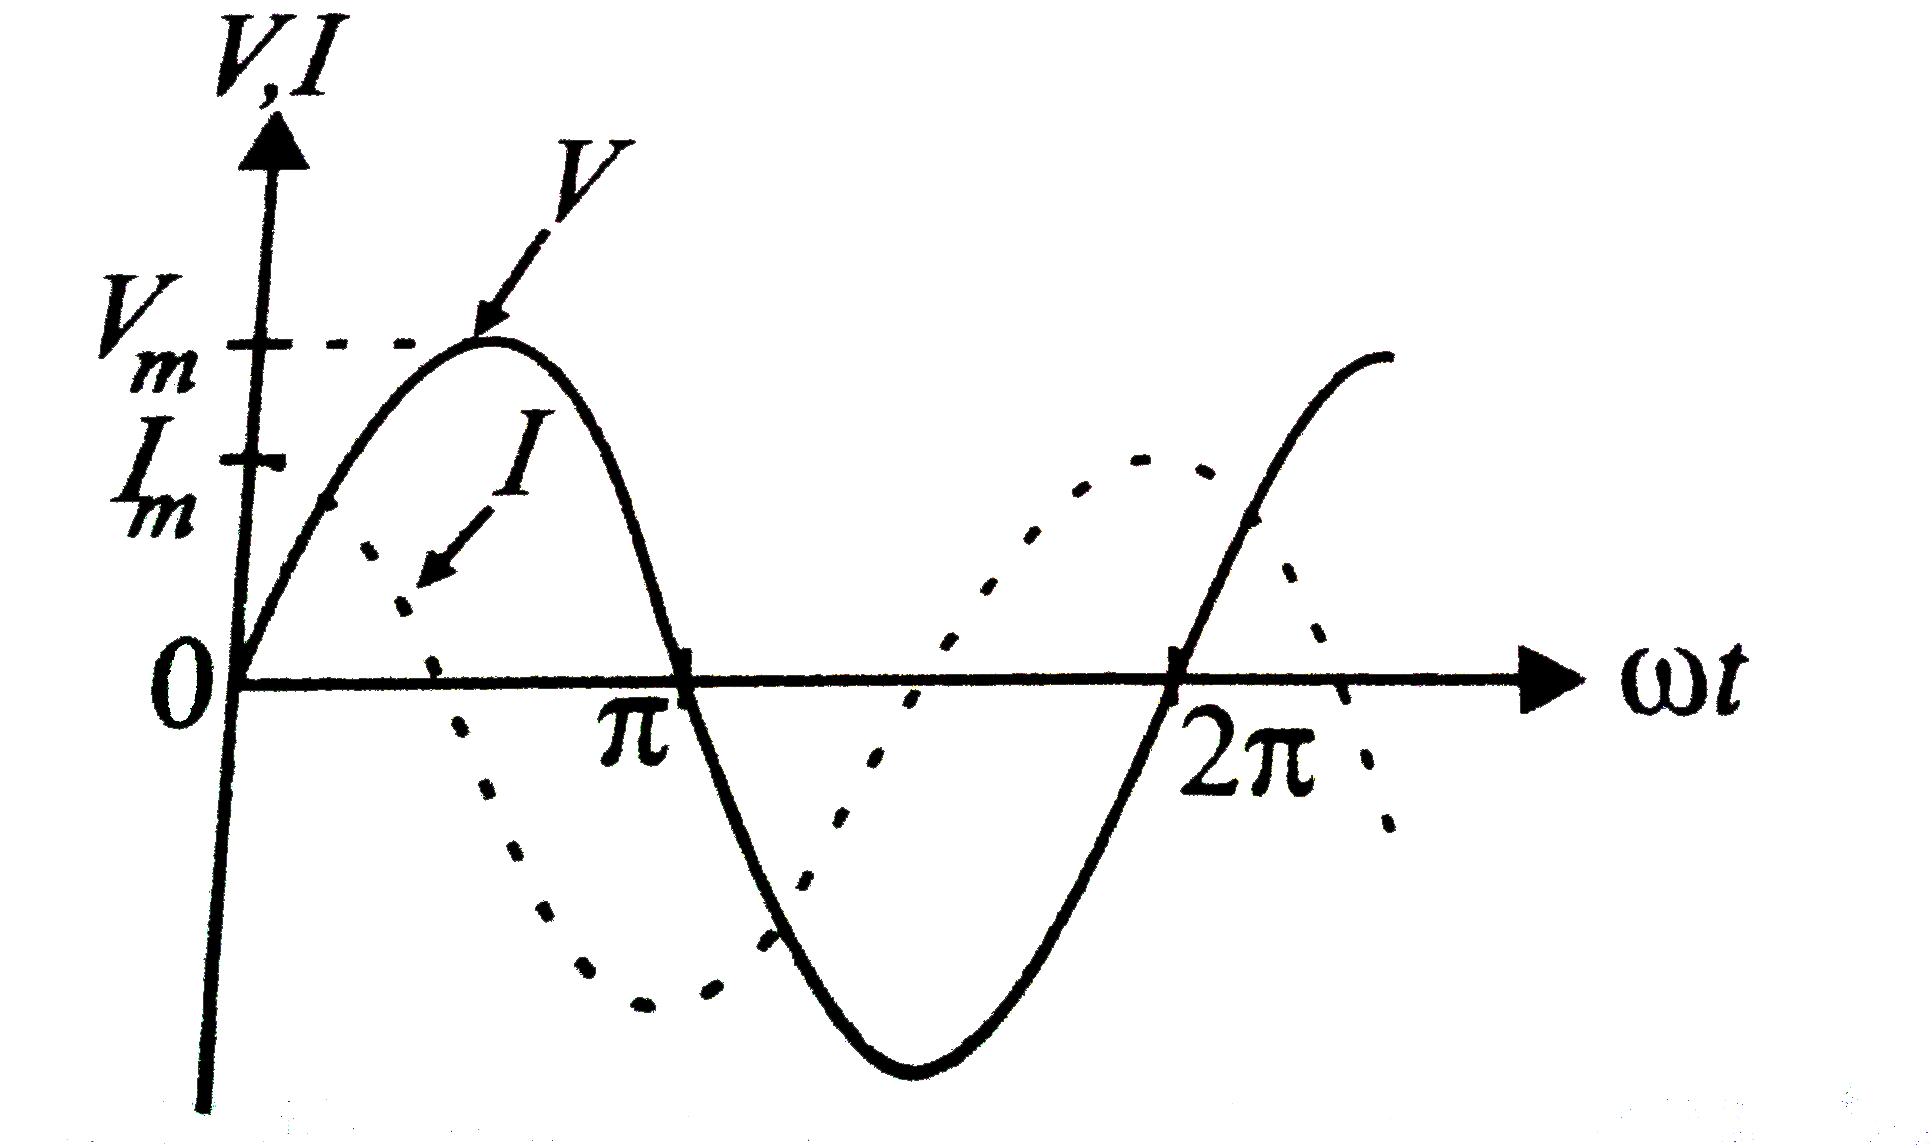 C
C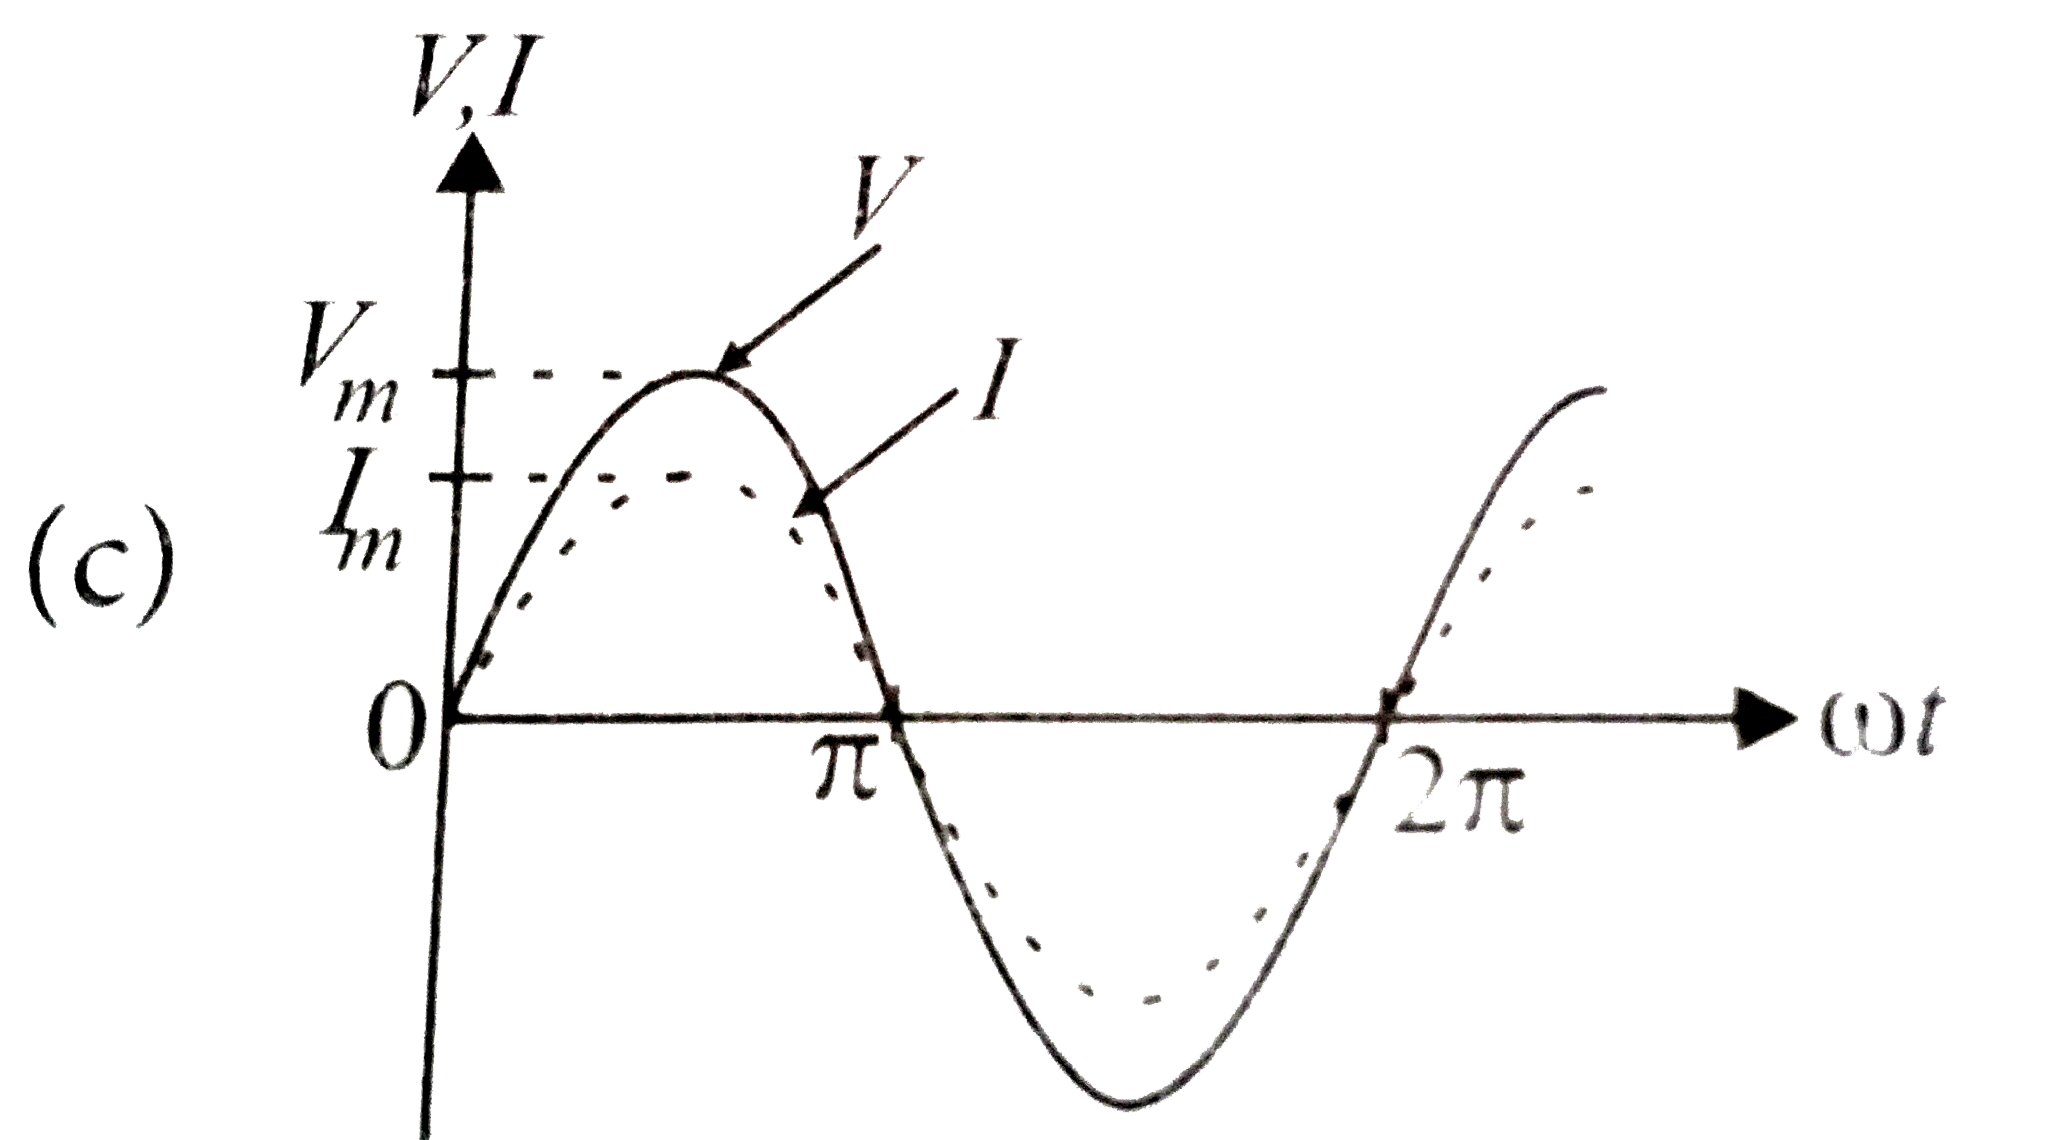 D
D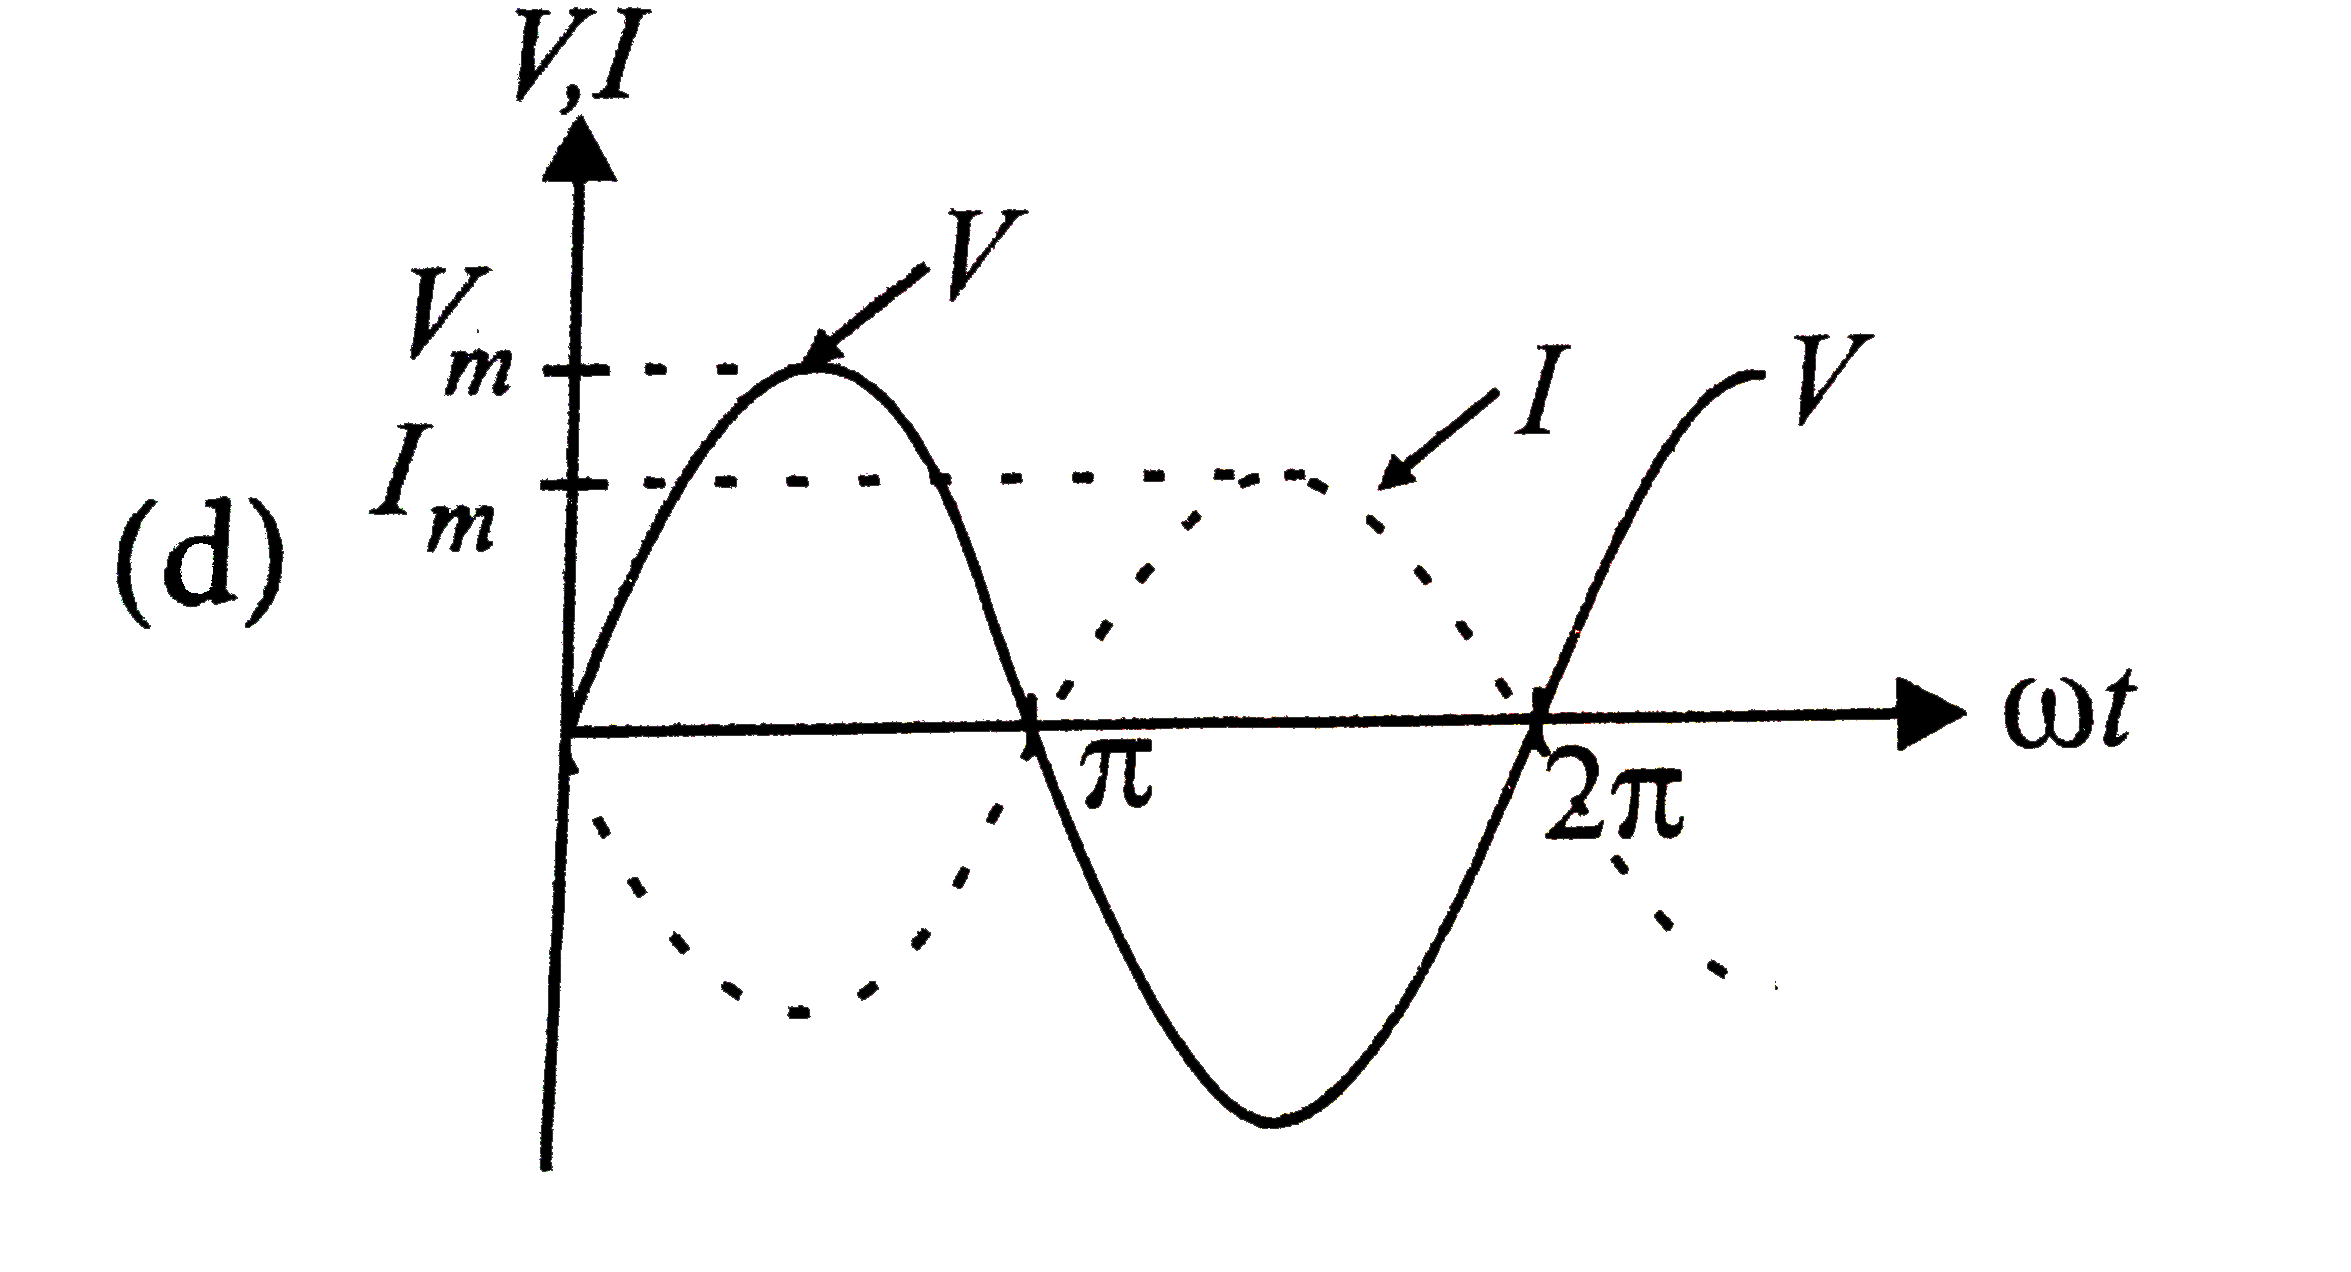
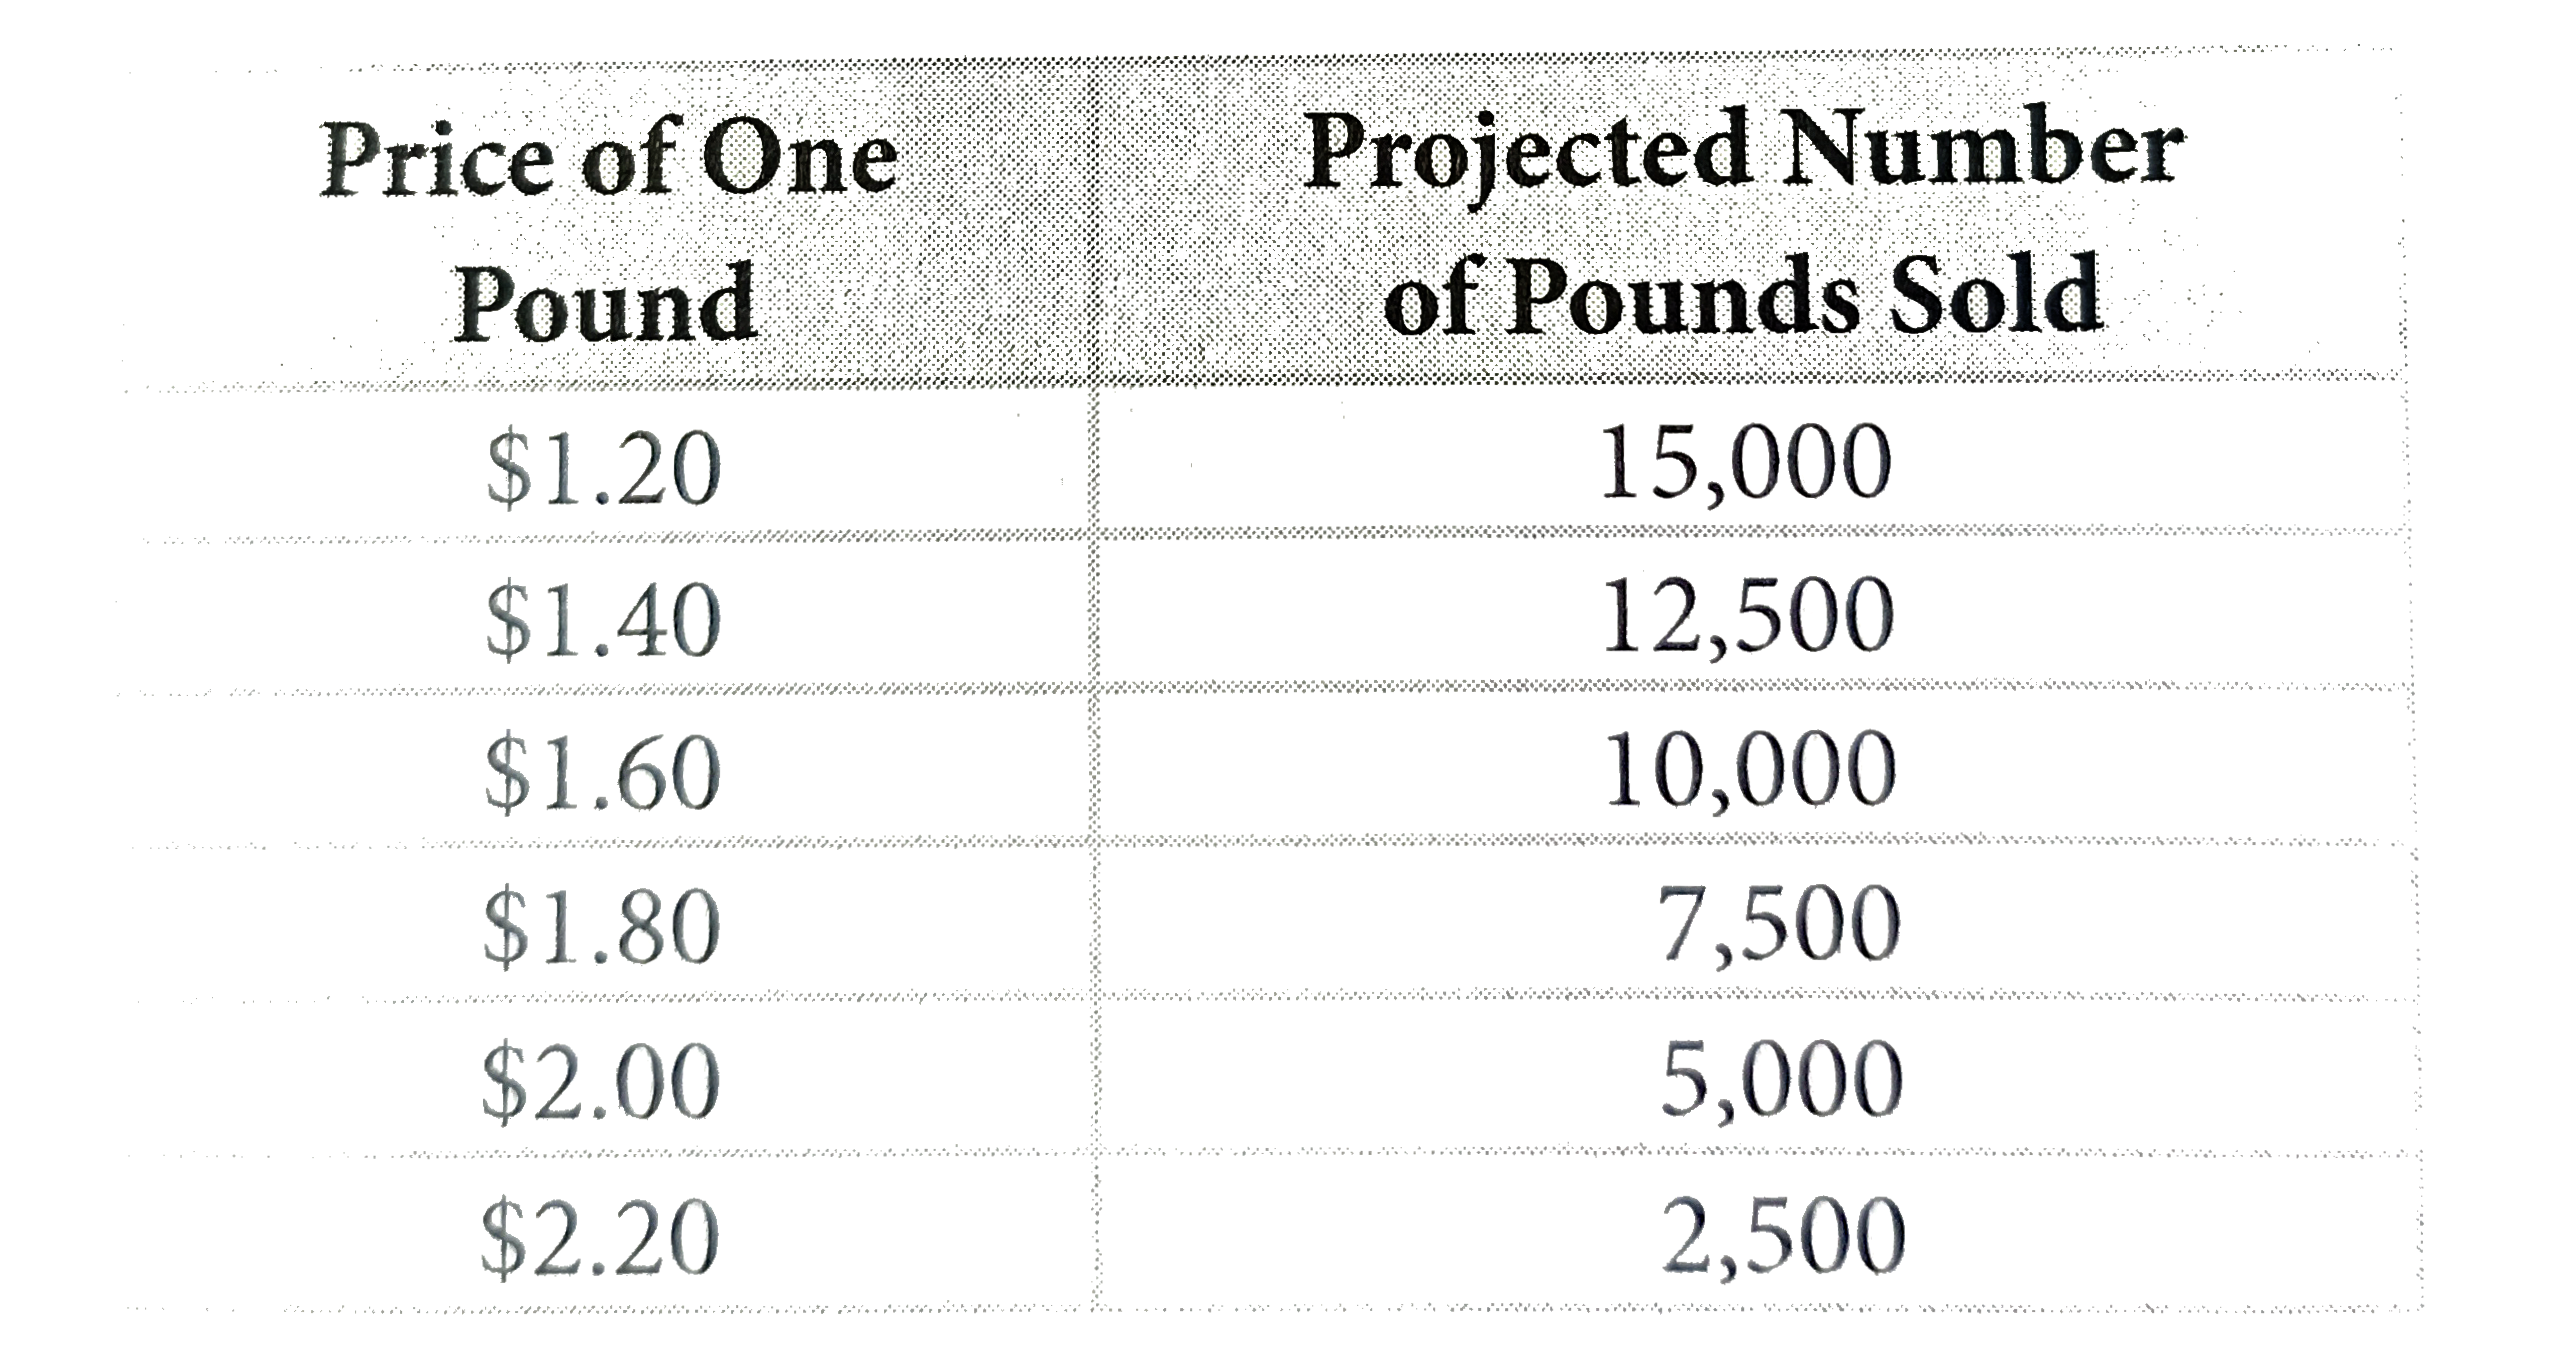
Which of the following equations best, describes the linear relationship shown in the table, where g represents the number of pounds of grain sold and d represnets the price in dollars of one pound of grain ?Ag=1.2d+12.500Bg=12,500d+15,000Cg=−12,500d+17,500Dg=−12,500d+30,000
The H-Bonds in solid HF can be best represented as :
View SolutionThe H-bonds in solid HF can be best represented as :
View SolutionWhich of the following relationship is represented by Mycorrhiza ?
View SolutionFor a body moving with uniform acceleration along straight line, the variation of its velocity (v) with position (x) is best represented by
View SolutionThe relationship between osmotic pressure, turgor pressure and wall pressure is represented by
View Solution
