Variation of resistance with cell constant is given in which of these graphs?

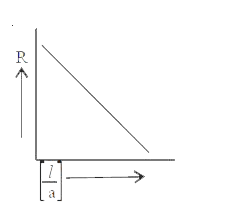
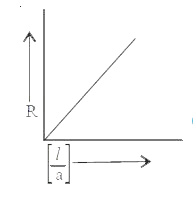
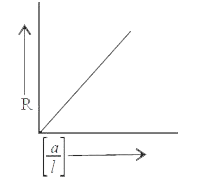
The correct Answer is:C
To determine the variation of resistance with cell constant, we can follow these steps:
Step 1: Understand the relationship between resistance and cell constant
The resistance R of a conductor is given by the formula:
R=ρLA
where:
- R is the resistance,
- ρ is the resistivity of the material,
- L is the length of the conductor,
- A is the cross-sectional area of the conductor.
Step 2: Define the cell constant
The cell constant k is defined as:
k=LA
Thus, we can rewrite the resistance in terms of the cell constant:
R=ρk
Step 3: Analyze the equation
From the equation R=ρk, we can see that resistance R is directly proportional to the cell constant k (which is LA). This means that as the cell constant increases, the resistance also increases.
Step 4: Graphical representation
If we were to plot a graph of resistance R on the y-axis against the cell constant k on the x-axis, the relationship would be linear. The slope of the line would be equal to the resistivity ρ.
Conclusion
The correct graph that represents the variation of resistance with cell constant is a straight line graph, indicating a direct proportionality.
Final Answer
The correct option is the graph that shows a linear relationship between resistance R and the cell constant k (or LA).
---
The resistance R of a conductor is given by the formula:
R=ρLA
where:
- R is the resistance,
- ρ is the resistivity of the material,
- L is the length of the conductor,
- A is the cross-sectional area of the conductor.
The cell constant k is defined as:
k=LA
Thus, we can rewrite the resistance in terms of the cell constant:
R=ρk
From the equation R=ρk, we can see that resistance R is directly proportional to the cell constant k (which is LA). This means that as the cell constant increases, the resistance also increases.
If we were to plot a graph of resistance R on the y-axis against the cell constant k on the x-axis, the relationship would be linear. The slope of the line would be equal to the resistivity ρ.
The correct graph that represents the variation of resistance with cell constant is a straight line graph, indicating a direct proportionality.
The correct option is the graph that shows a linear relationship between resistance R and the cell constant k (or LA).
Topper's Solved these Questions
- ELECTROCHEMISTRYBook:VMC MODULES ENGLISHChapter:ELECTROCHEMISTRYExercise:IMPECCABLE
Explore 50 Videos
- ELECTROCHEMISTRYBook:VMC MODULES ENGLISHChapter:ELECTROCHEMISTRYExercise:ENABLE
Explore 50 Videos
- CLASSIFICATION OF ELEMENTS AND PERIODICITY IN PROPERTIES Book:VMC MODULES ENGLISHChapter:CLASSIFICATION OF ELEMENTS AND PERIODICITY IN PROPERTIES Exercise:JEE ADVANCE (ARCHIVE)
Explore 30 Videos
- ENVIRONMENTAL CHEMISTRYBook:VMC MODULES ENGLISHChapter:ENVIRONMENTAL CHEMISTRYExercise:JEE Main (Archive)
Explore 39 Videos
Similar Questions
The cell constant is given by
View SolutionThe cell constant is the product of resistance and
View SolutionThe correct variation of resistance R with frequency f is given by
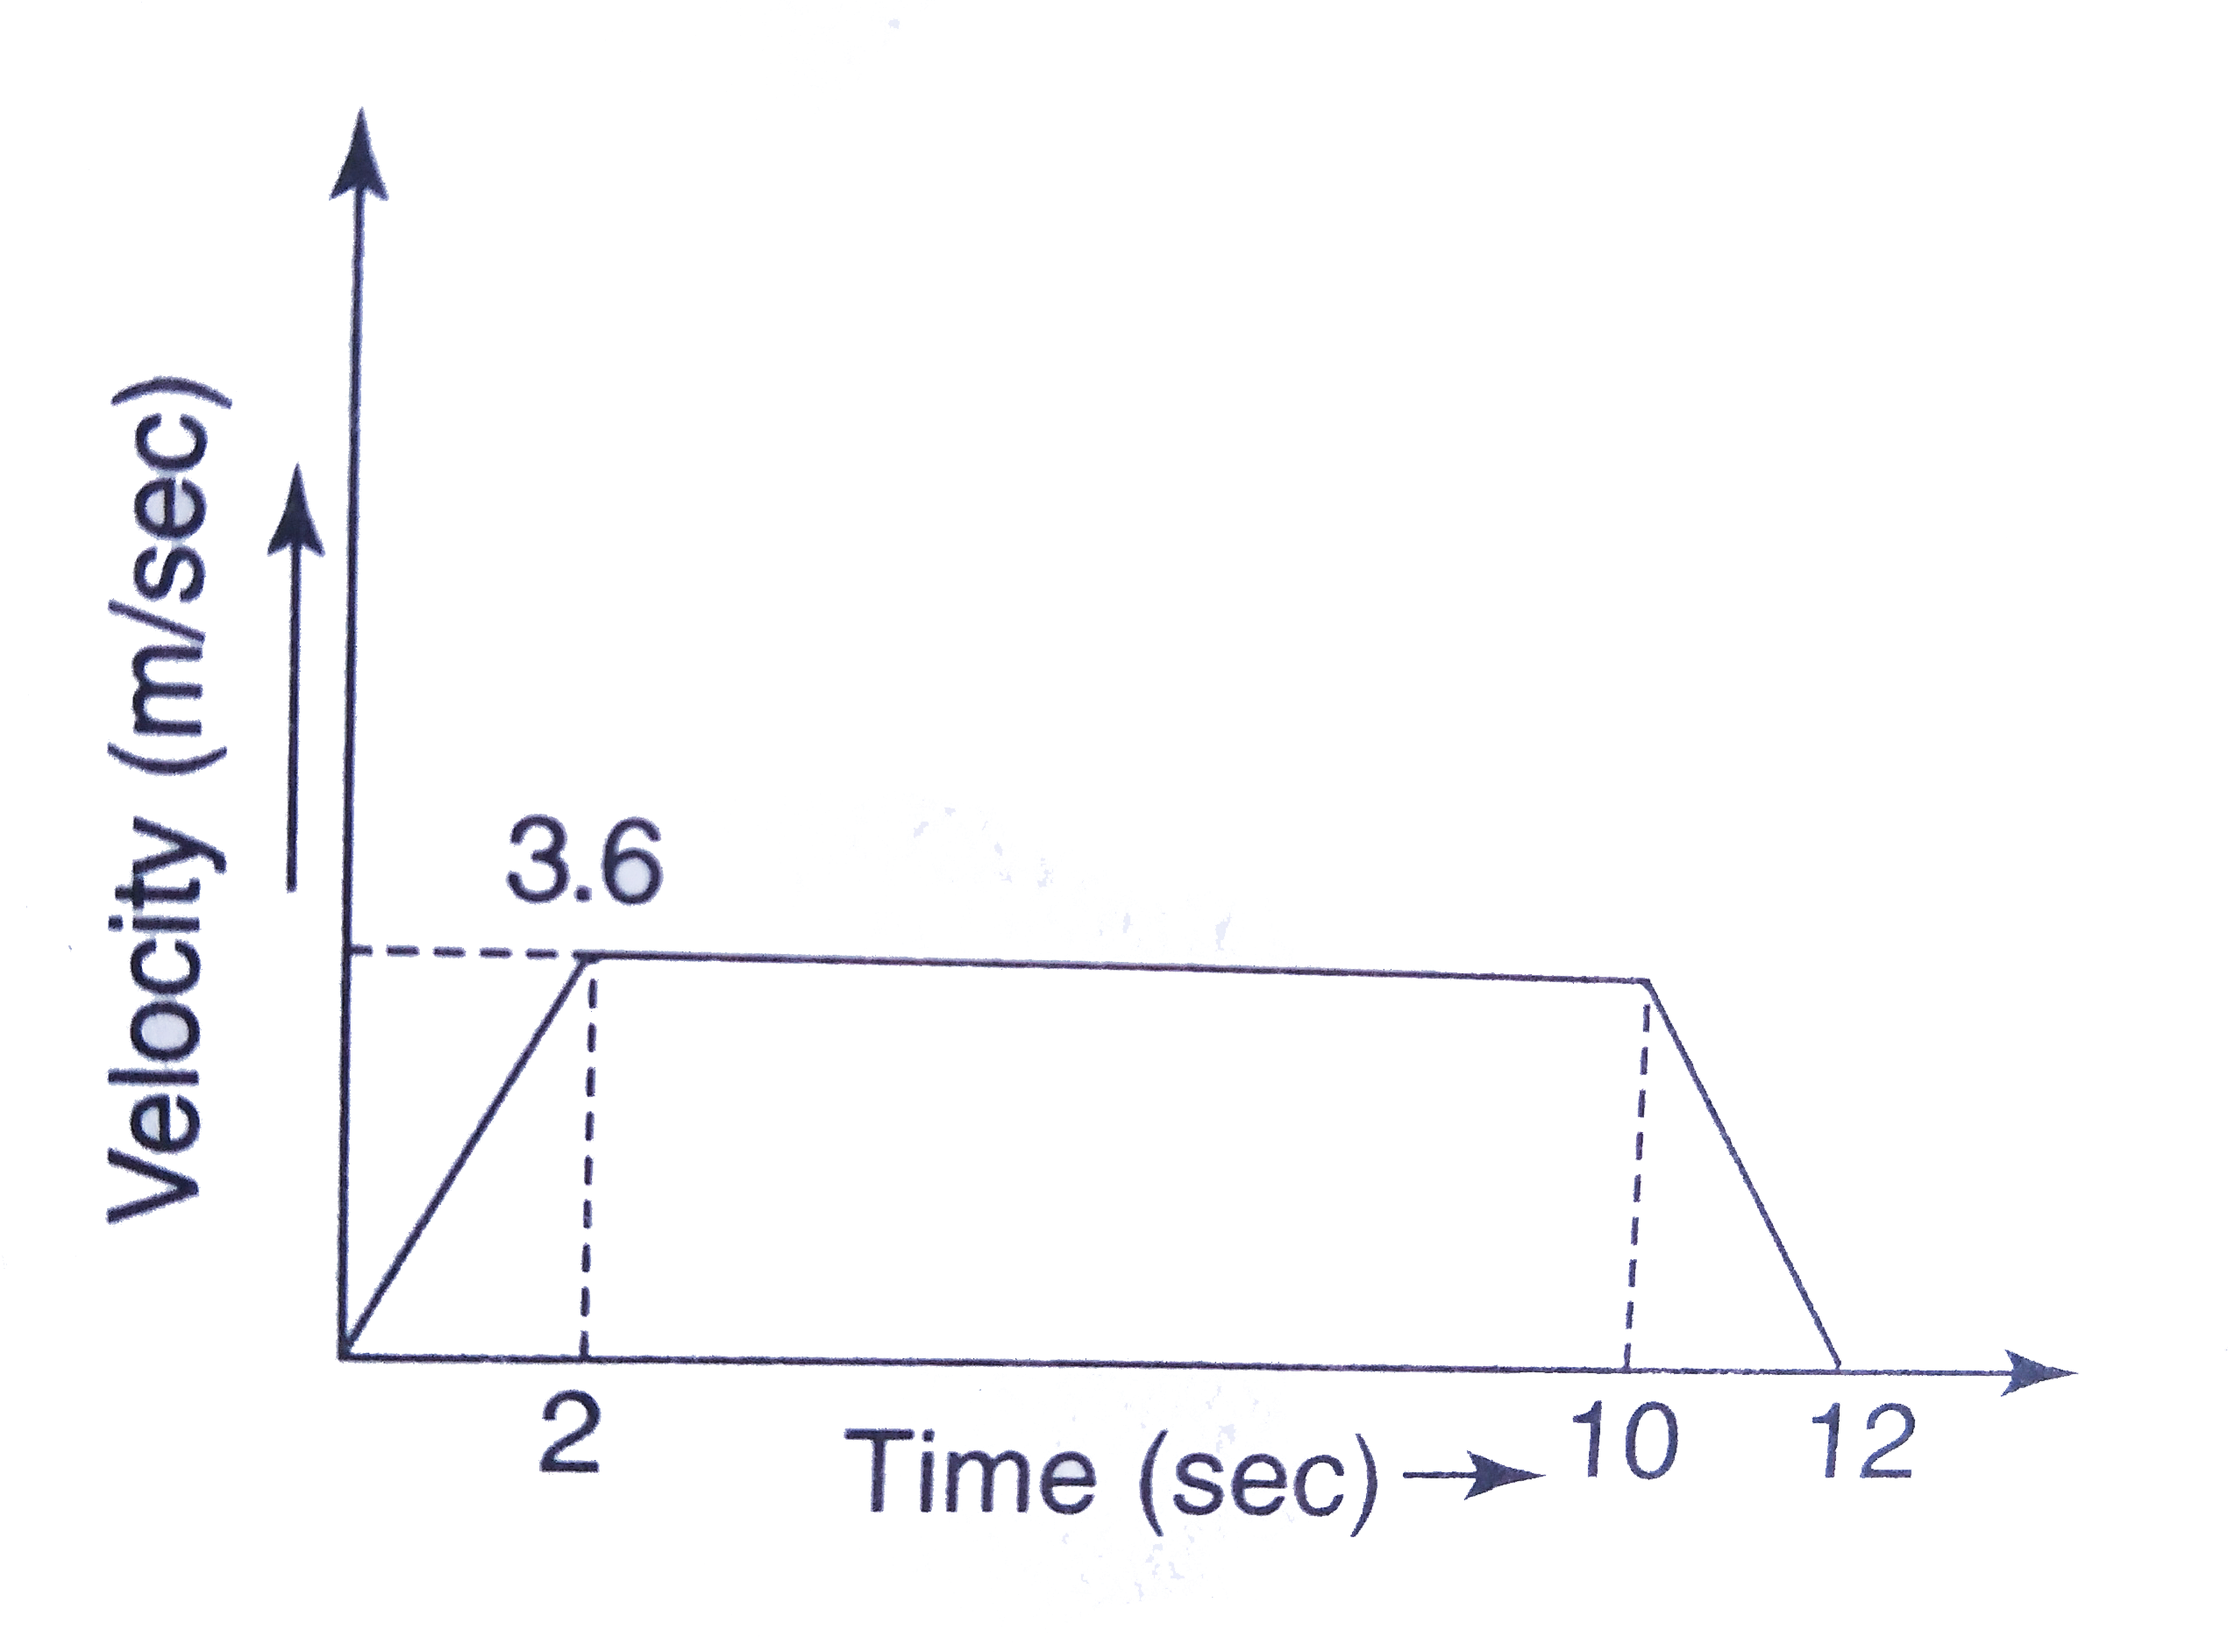
View SolutionA lift is going up. The variation in the speed of the lift is as given in the graph in the graph. What is the height to which the lift takes the passengers ?
View SolutionThe variation of current (I) and voltage (V) is as shown in figure A. The variation of power P with current I is best shown by which of the following graph

View SolutionA constant potential difference is applied across a resistance. Consider variation of resistance with temperature. Which graph represents best the variation of power produced in resistance versus resistance?
View Solution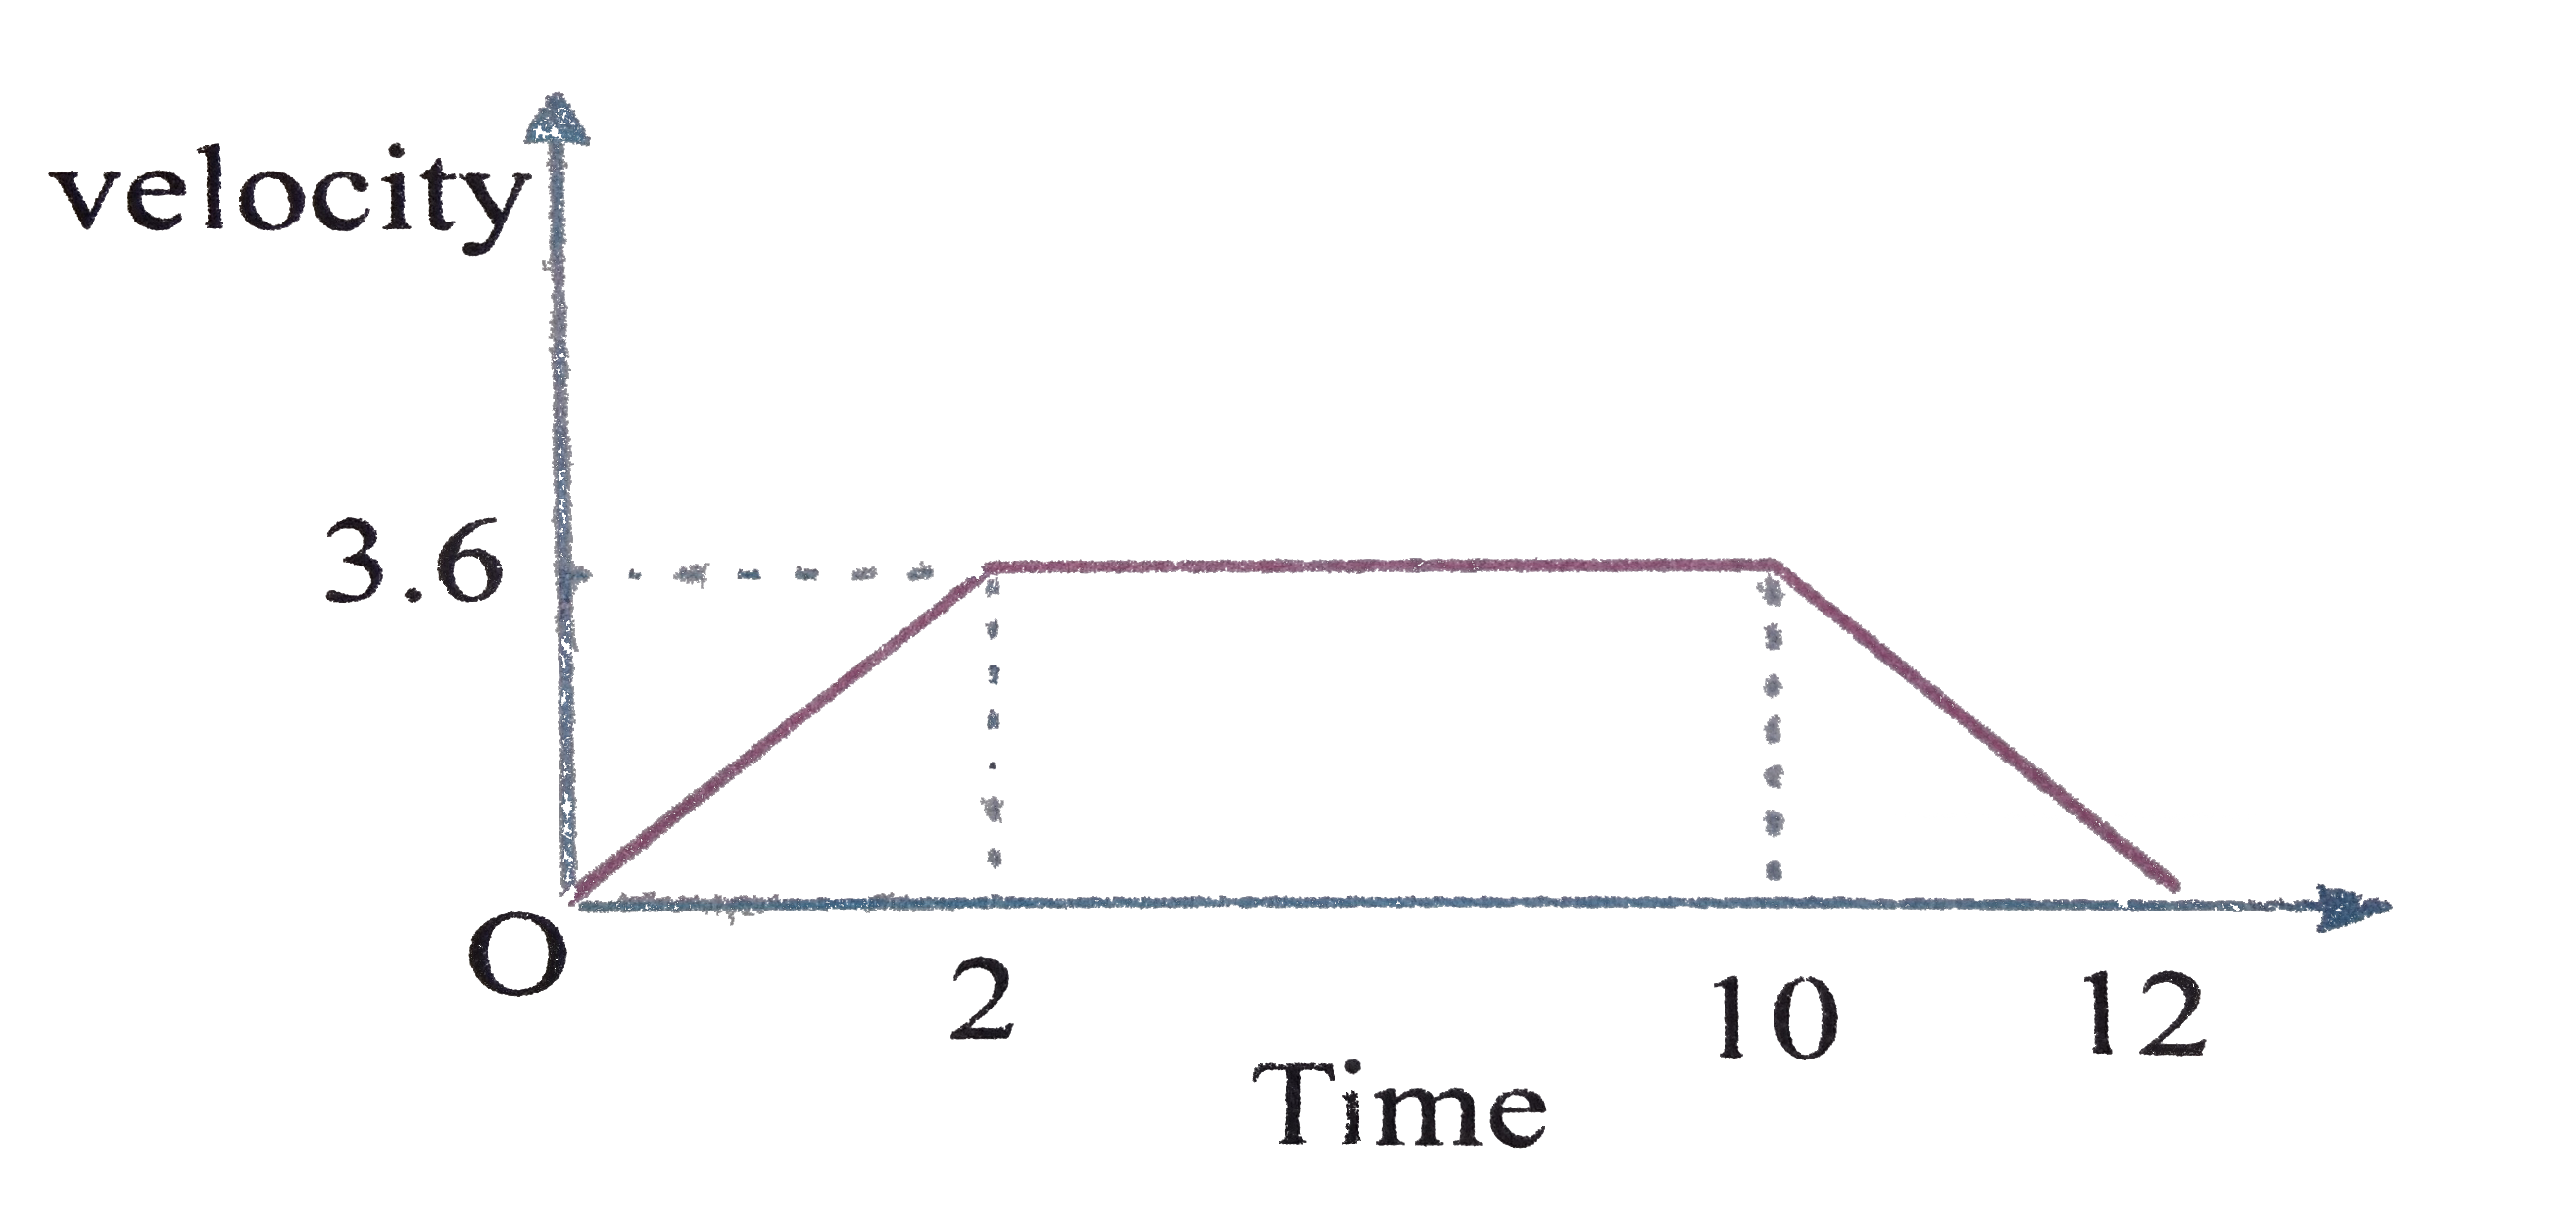
An elevator is going up. The variation in the velocity of the elevator is as given in the graph. What is the height to which the elevator takes the passenger?
View Solution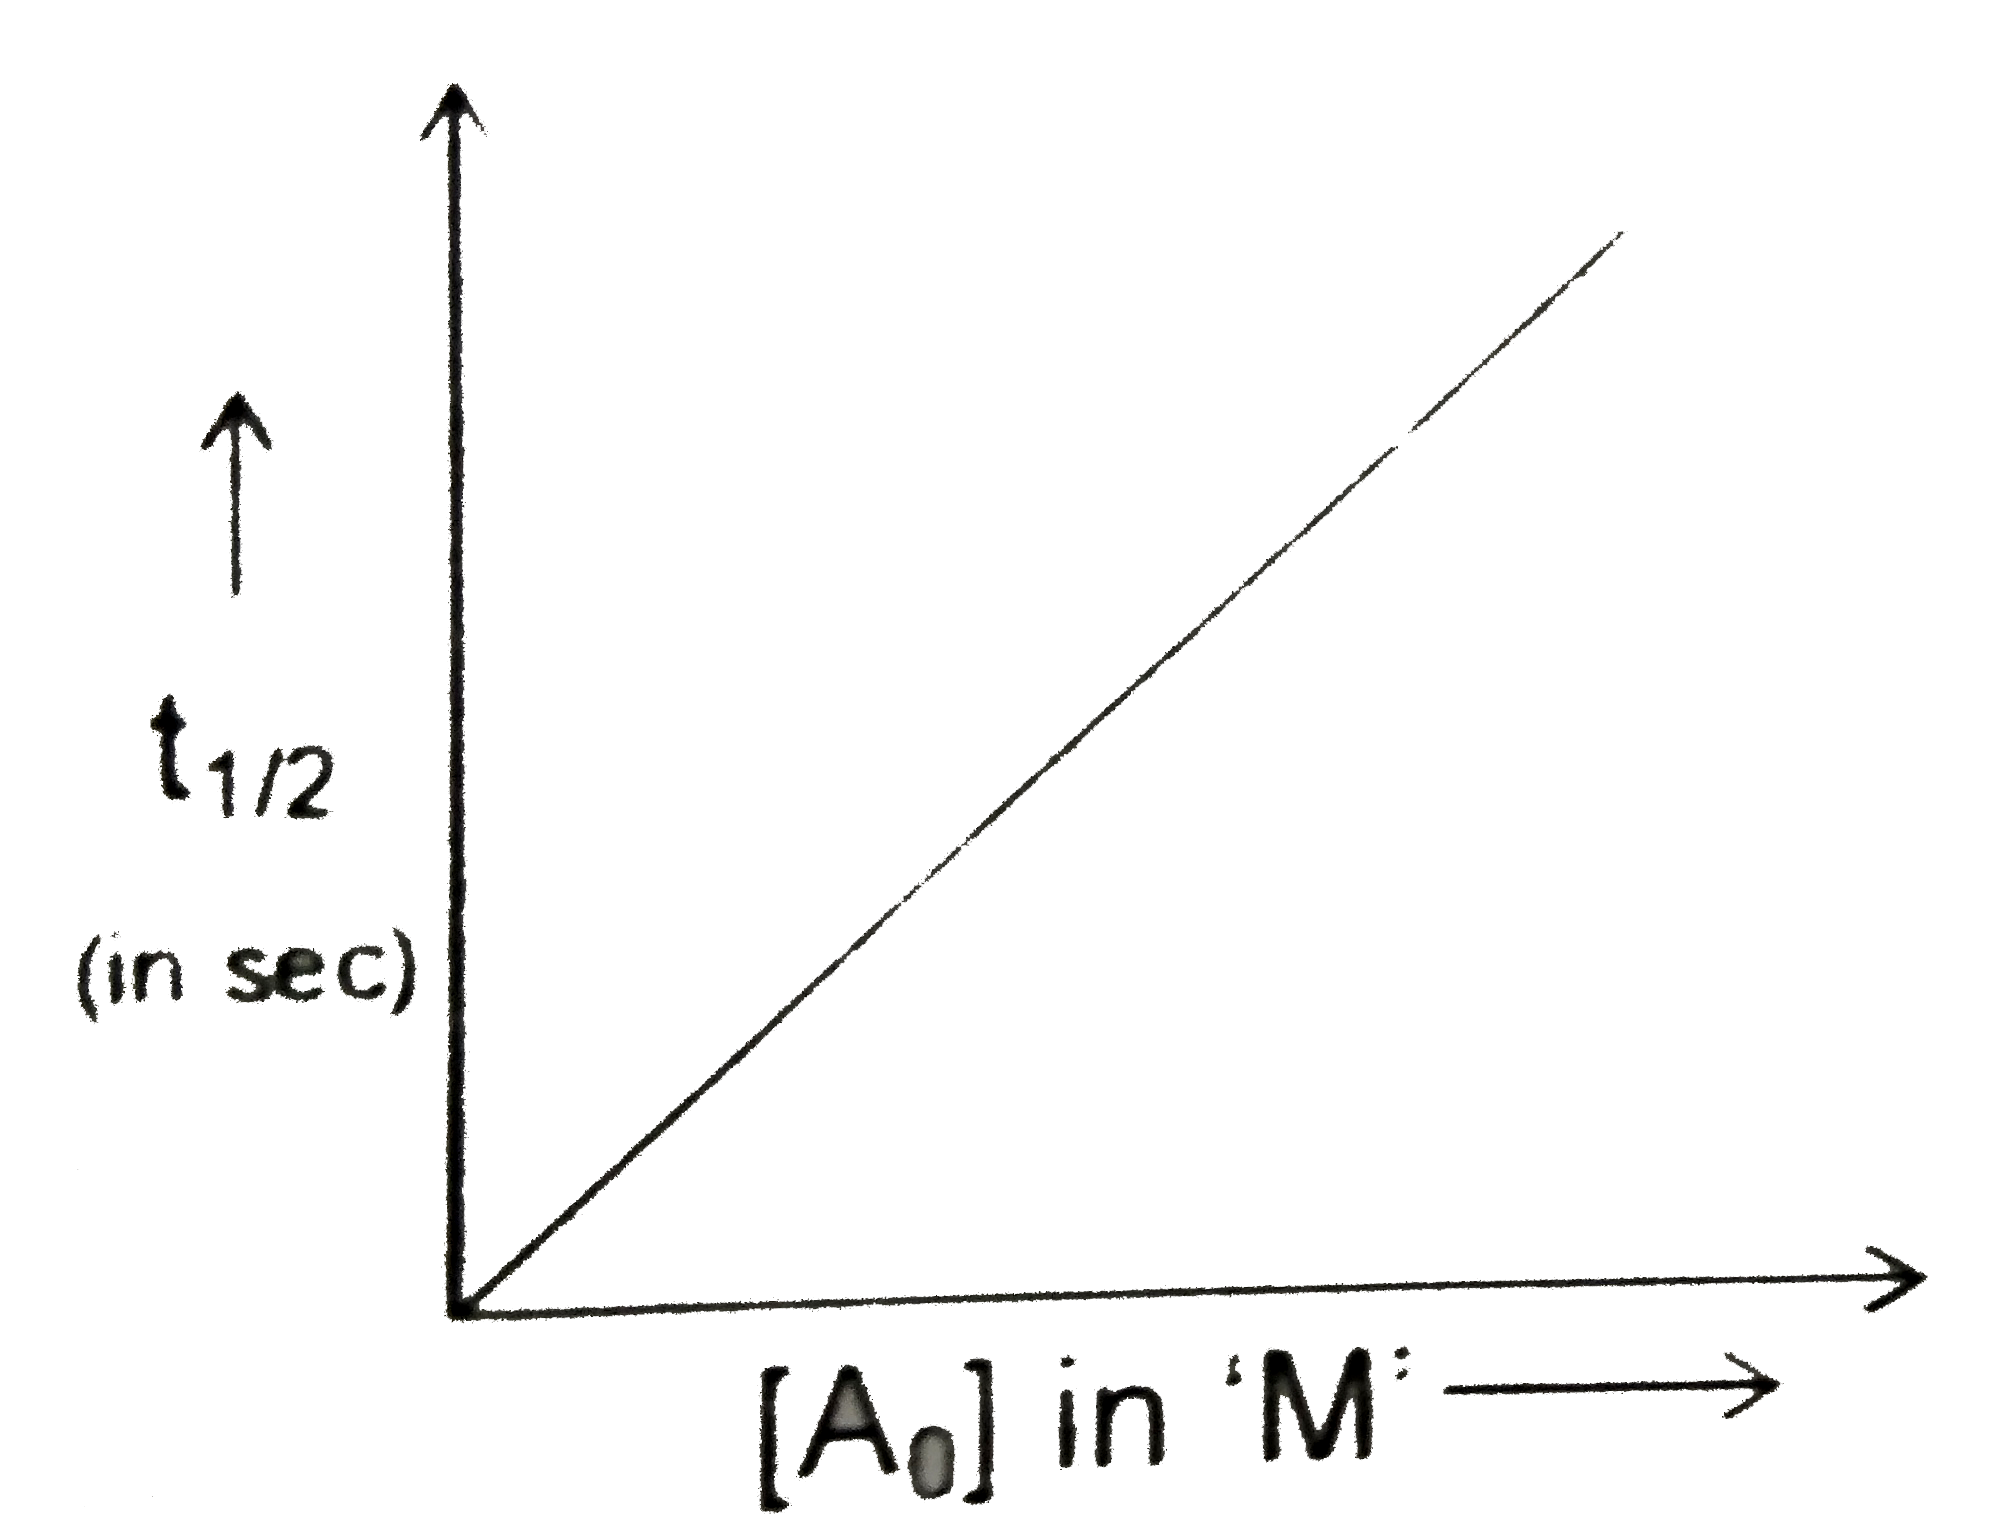
What is the unit of rate constant of the reaction for which the above graph is given?
View SolutionA body moves from rest with a constant acceleration. Which one of the following graphs represents the variation of its kinetic energy K with the distance travelled x?
View SolutionA body moves from rest with a constant acceleration. Which one of the following graphs represents the variation of its kinetic energy K with the distance travelled x?
View Solution
