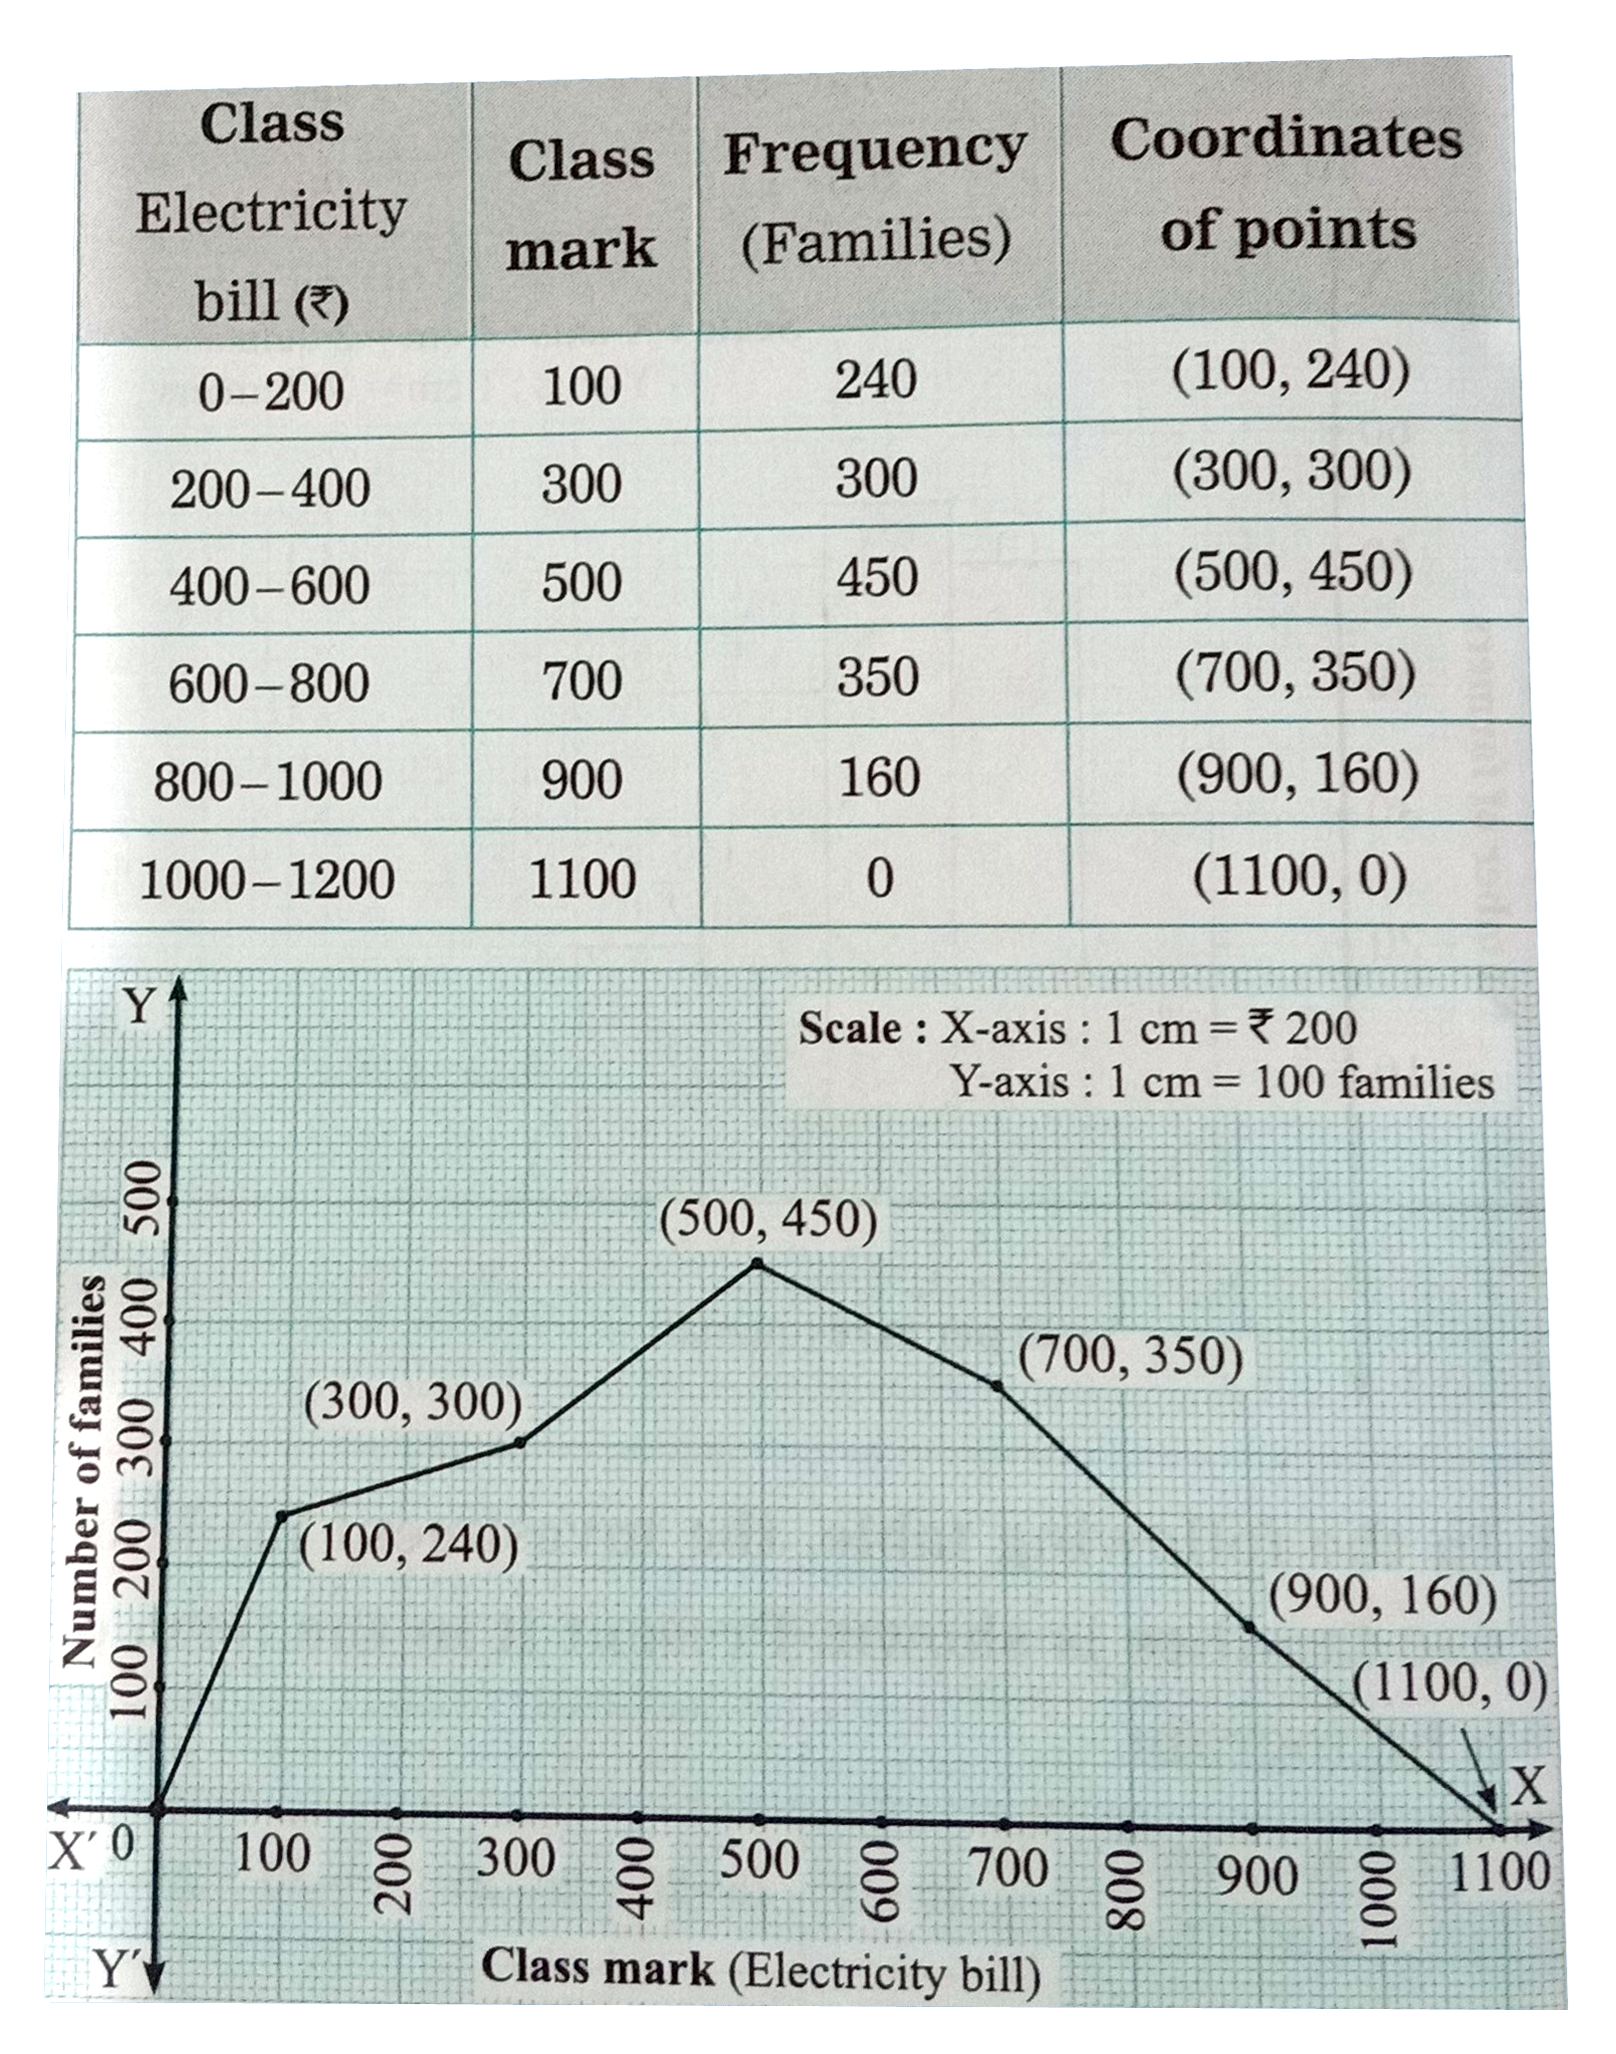
Show the following data by a frequency polygon.

First prepare a table showing coordinates necessary to draw a frequency polygon.

Topper's Solved these Questions
- STATISTICSBOOK - NAVNEET PUBLICATION - MAHARASHTRA BOARDCHAPTER - STATISTICSEXERCISE - PRACTICE SET 6.6
6 Videos
- STATISTICSBOOK - NAVNEET PUBLICATION - MAHARASHTRA BOARDCHAPTER - STATISTICSEXERCISE - Challenging Questions
2 Videos
- STATISTICSBOOK - NAVNEET PUBLICATION - MAHARASHTRA BOARDCHAPTER - STATISTICSEXERCISE - PRACTICE SET 6.4
4 Videos
- SIMILARITYBOOK - NAVNEET PUBLICATION - MAHARASHTRA BOARDCHAPTER - SIMILARITYEXERCISE - SUBJECTIVE TYPE
20 Videos
- THEOREMS BOOK - NAVNEET PUBLICATION - MAHARASHTRA BOARDCHAPTER - THEOREMS EXERCISE - CIRCLE
15 Videos
Similar Questions
Show the following data by a frequency polygen.

View SolutionDefine frequency polygon.
View SolutionThe following table shows the average rainfall in 150 towns. Towns. Show the information by a ferquency polygon.

View SolutionRepresent the following data by frequency curve :

View SolutionExhibit the above data using a frequency polygon.
View SolutionPresent the following data in the form of a frequency polygon :

View SolutionHow is a frequency polygon obtained?
View SolutionFrom the following data, construct frequency histogram, frequency polygon and frequency curve.

View Solution
The above data is to be shown by a frequency polygon. The coordinates of the points to show number of students in the class 4−6 are _______ .
View SolutionFind the correct answer from the alternative given :

The above data is to be shown by a frequency polygon. The coordinates of the points to show number of students in the class 4−6 are ………
View Solution
