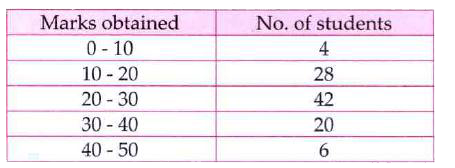
The marks scored by the students in a class test are given in the following frequency distribution.
Marks Number of students 0−6 16−12 412−18 918−24 324−30 3
Find the mean, median and mode of the data.
The correct Answer is:Mean = 15.6 marks, Median = 15.33 marks, Mode = 14.73 marks
Topper's Solved these Questions
- STATISTICSBOOK - KUMAR PRAKASHANCHAPTER - STATISTICSEXERCISE - Objective Questions (Fill in the blanks)
5 Videos
- STATISTICSBOOK - KUMAR PRAKASHANCHAPTER - STATISTICSEXERCISE - Objective Questions (MCQ.s)
10 Videos
- STATISTICSBOOK - KUMAR PRAKASHANCHAPTER - STATISTICSEXERCISE - Test your Skills
18 Videos
- SOME AAPLICATIONS OF TRIGONOMETRYBOOK - KUMAR PRAKASHANCHAPTER - SOME AAPLICATIONS OF TRIGONOMETRYEXERCISE - Objective Questions
24 Videos
- SURFACE AREAS AND VOLUMESBOOK - KUMAR PRAKASHANCHAPTER - SURFACE AREAS AND VOLUMESEXERCISE - TEST YOUR SKILLS
5 Videos
Similar Questions
Knowledge Check
The given below shows the marks obtained by various students.
MarksNumber of students10−12612−14814−16516−18718−204
What is the mean marks (Correct up to two decimal places) of given data ?A13.67B14.67C15.33D13.33If marks scored by students of a class are 1,2,4,......210 with frequency 1,2,3,4......11 then median is
A128B64C32D16
The mean deviation about the median of the following distribution is
Marks obtained1011121415Number of students23834
View SolutionThe mean deviation about the median of the following distribution is
Marks obtained1011121415Number of students23834
View SolutionThe marks obtained by students in a Maths test are given below. Find their mode.
18,19,17,12,20,19,18,17,18,11.
View SolutionIn a class of 40 students, marks obatined by the students in a class test (out of 10) are given below :

Calculate the following for the given distribution :
(i) Median
(ii) Mode
View SolutionThe marks obtained by 7 students in Science test are given below :
24,22,30,28,32,26,34
Find the range, mean. Median and mode.
View SolutionFind the mean of the following frequency distributions: Class interval: 0-6 6-12 12-18 18-24 24-30 Frequency: 7 5 10 12 6
View Solution

