The frequency distribution given below shows the height of 60 students of a class. If the mean of the data is 157 cm, find the missing frequenctes x and y
Height (in cm) Number of students 144−148 x148−152 8152−156 15156−160 y160−164 16164−168 6
The correct Answer is:x=4, y=11
Topper's Solved these Questions
- STATISTICSBOOK - KUMAR PRAKASHANCHAPTER - STATISTICSEXERCISE - Objective Questions (Fill in the blanks)
5 Videos
- STATISTICSBOOK - KUMAR PRAKASHANCHAPTER - STATISTICSEXERCISE - Objective Questions (MCQ.s)
10 Videos
- STATISTICSBOOK - KUMAR PRAKASHANCHAPTER - STATISTICSEXERCISE - Test your Skills
18 Videos
- SOME AAPLICATIONS OF TRIGONOMETRYBOOK - KUMAR PRAKASHANCHAPTER - SOME AAPLICATIONS OF TRIGONOMETRYEXERCISE - Objective Questions
24 Videos
- SURFACE AREAS AND VOLUMESBOOK - KUMAR PRAKASHANCHAPTER - SURFACE AREAS AND VOLUMESEXERCISE - TEST YOUR SKILLS
5 Videos
Similar Questions
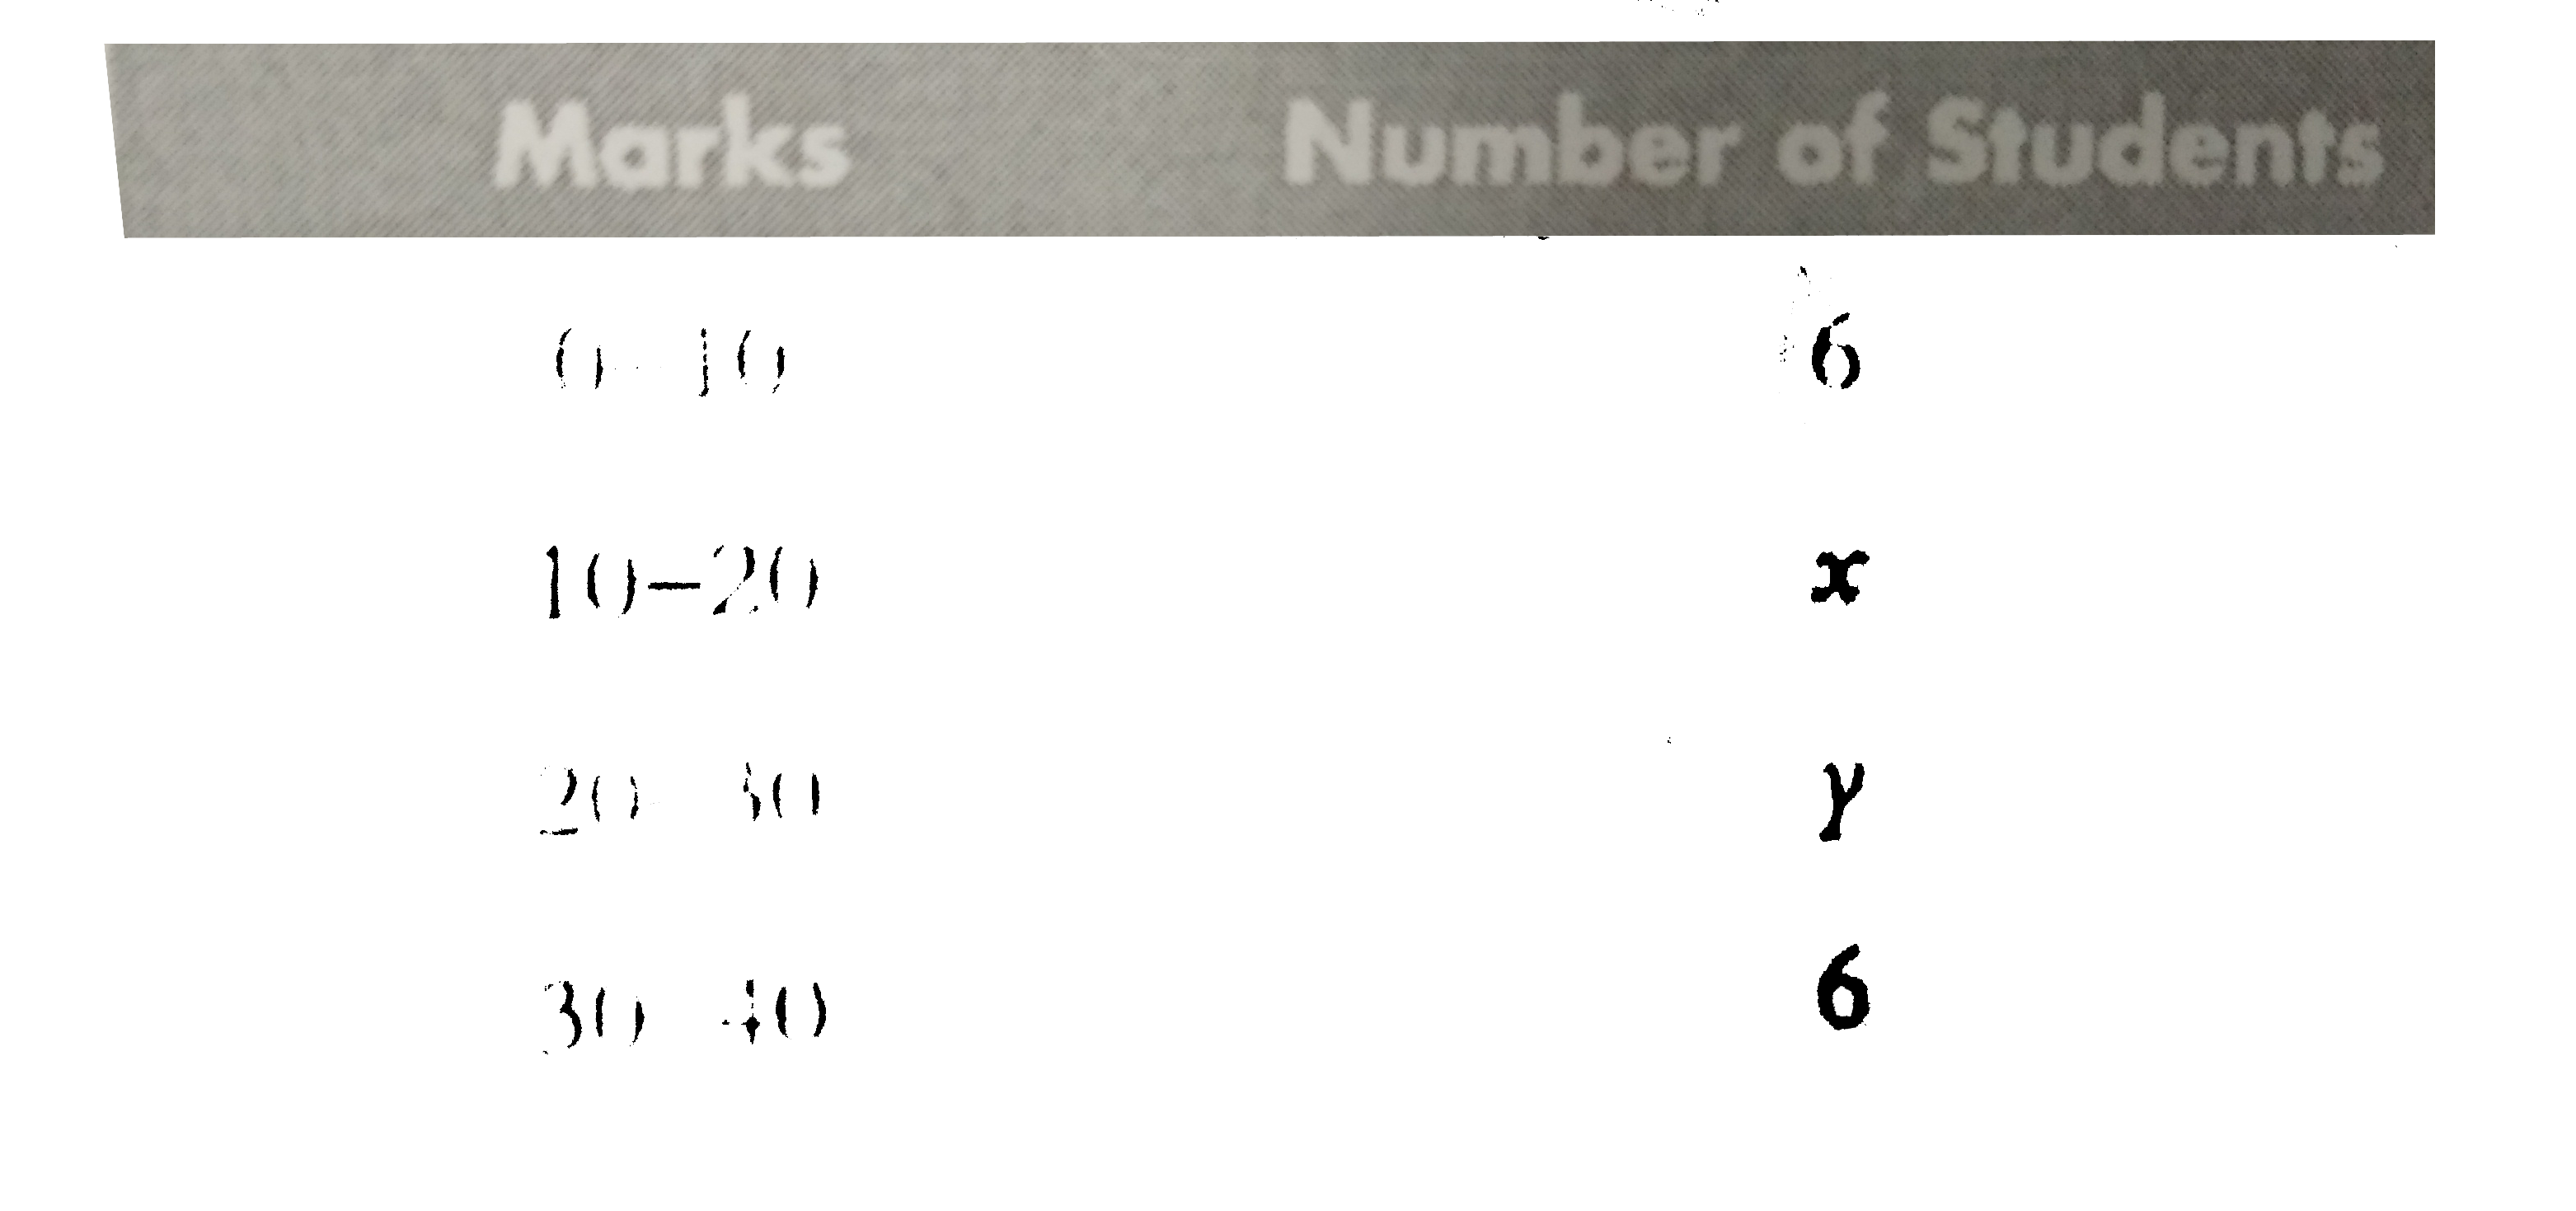
The frequency distribution of the marks obtained by 28 students in a test carrying 40 marks is given below :

If the mean of the above data is 20 , then find the difference between x and y .
View SolutionGiven below is the data showing heights of 50 students in a class. Find its median.
Height(in cm)162164166167168170173175177180Number of Students64512837221
View SolutionThe heights (in cm) of 9 students of a class are
148,144,152,155,160,147,150,149,145.
find the median height.
View SolutionThe heights (in cm) of 9 students of a class are as follows: 155, 160, 145, 149, 150, 147, 152, 144, 148 Find the median of this data.
View SolutionThe heights (in cm) of 35 students of a class are given below :
Height (in cm)157152153154155156Number of students743597
Find the median height.
View SolutionFind the mean height of 65 boys from the following data :
Height (in cm)142144146148150152Number of boys1013127176
View SolutionThe following table shows the distribution of the heights of a group of students:

Use a graph sheet to draw an Ogive for the distribution. Use the Ogive to find:
the number of students whose height is less than 148 cm.
View SolutionFind the median from the following frequency distribution.
Number of students (f)1283214163Marks (x)40185010080160
View SolutionThe heights (in cm) of 9 students of a class are as follows:
150, 160, 140, 140, 150, 140, 150, 144, 148
Find the median of this data.
View SolutionIf the median of the distribution given below is 28.5, find the value of x and y . Class interval: 0-10 10-20 20-30 30-40 40-50 50-60 No. of students: 5 x 20 15 y 5
View Solution
