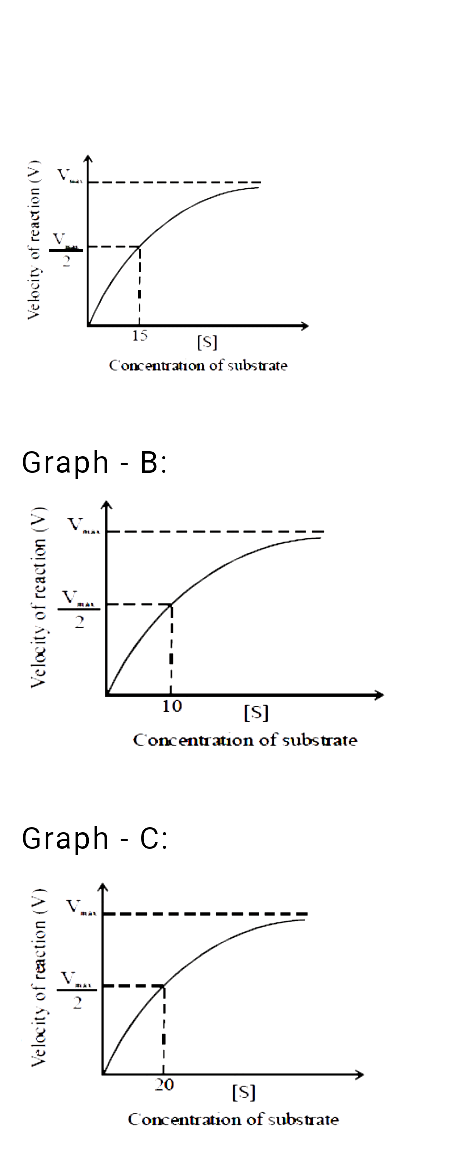
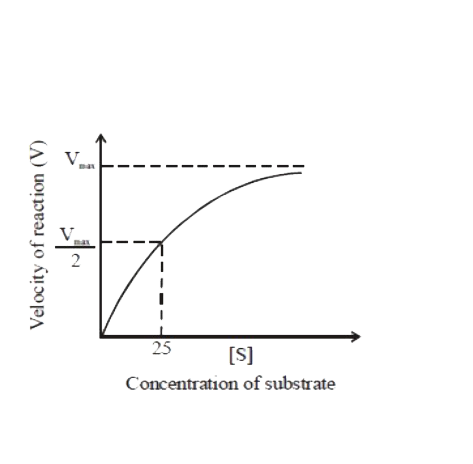
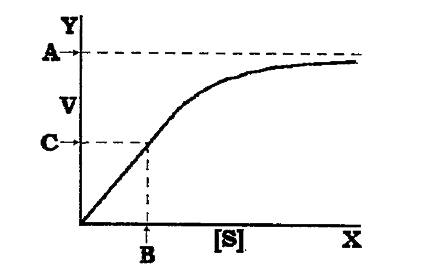
The adjoining graph shows change in conc. of substrate on enzyme activity. Identify A, B and C.
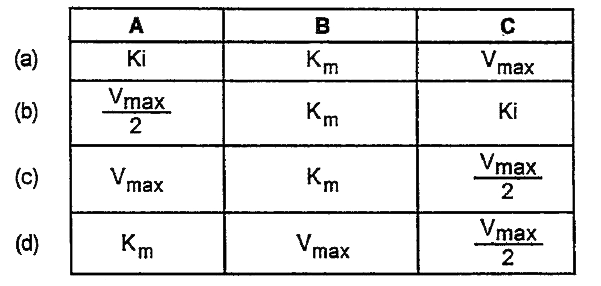
The correct Answer is:C
Step by step video, text & image solution for The adjoining graph shows change in conc. of substrate on enzyme activity. Identify A, B and C. by Biology experts to help you in doubts & scoring excellent marks in Class 12 exams.
Similar Questions
Knowledge Check
- Question 1 - Select One
The given adjacent graph depicts the change in conc. of substrate on enzyme activity. Identify A, B abd C
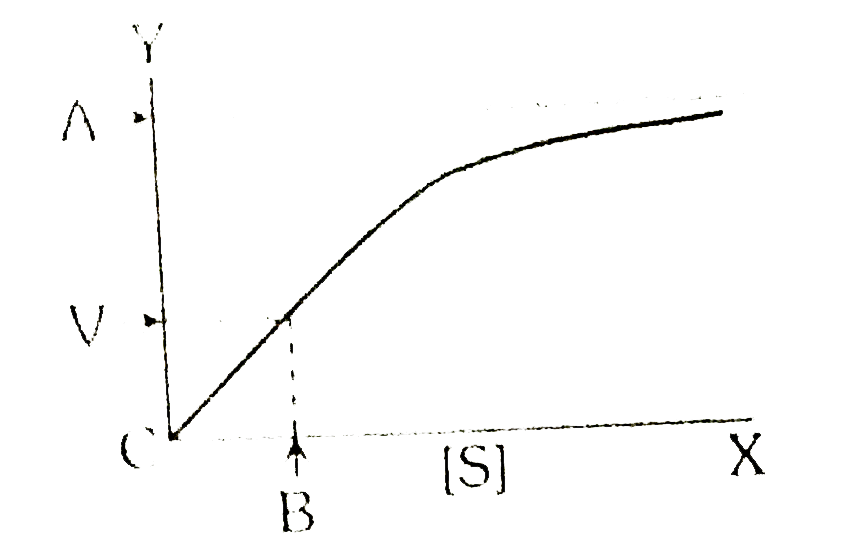 A∣∣∣ABC(a)KmVmaxVmax2∣∣∣B∣∣∣ABC(a)VmaxKmVmax2∣∣∣C∣∣∣ABC(a)Vmax2KmKi∣∣∣D∣∣∣ABC(a)KiKmVmax∣∣∣
 - Question 2 - Select One
Which of the following graphs shows the relationship between the rate of an enzymatic activity and substrate concentration (S) ?
A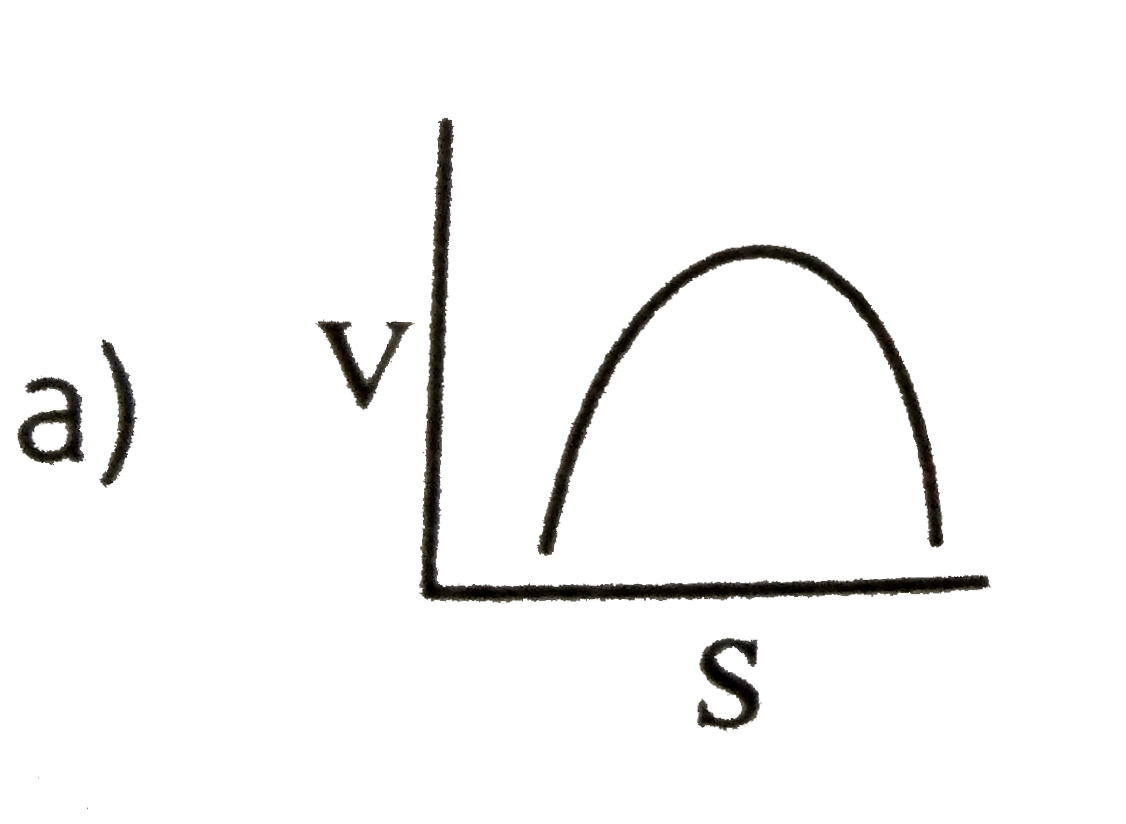 B
B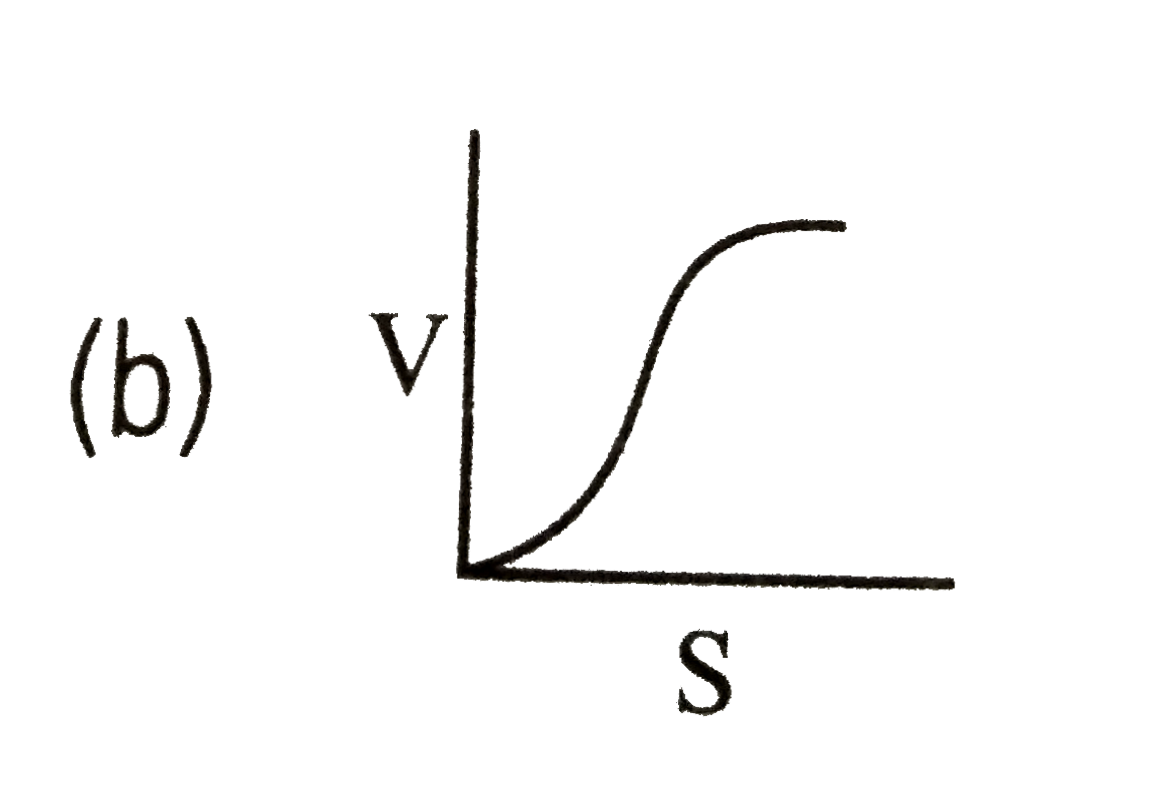 C
C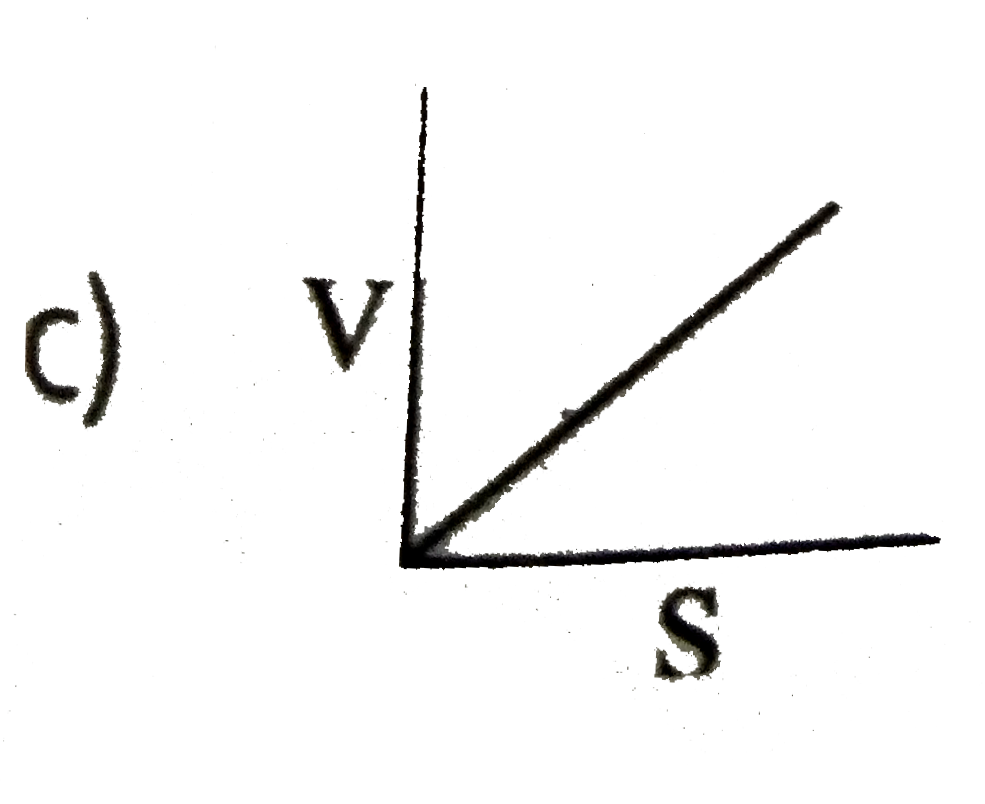 D
D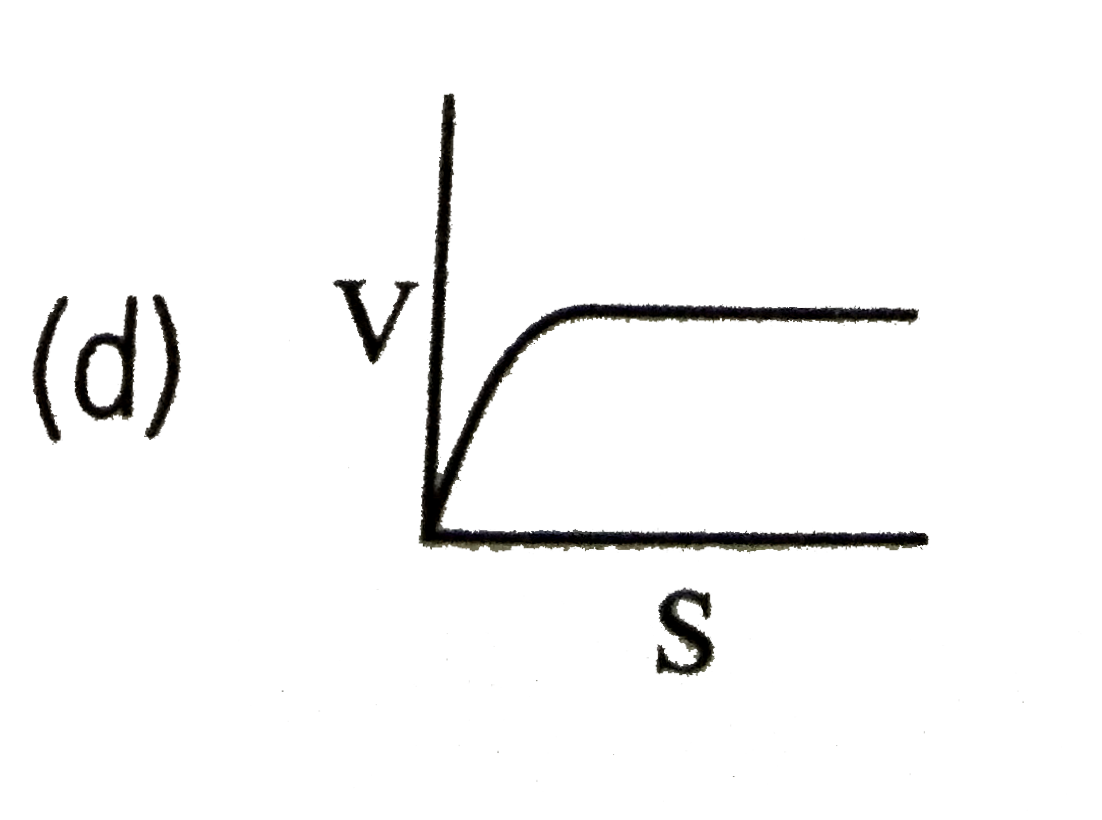
- Question 3 - Select One
Which one of the following graphs show the relationship between the rate of an enzymatic activity and substrate conc(S) -
A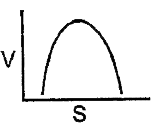 B
B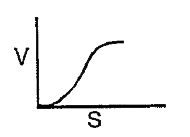 C
C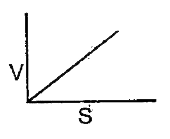 D
D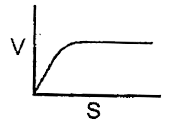
The adjoining graph of y=ax2+bx+c shows that
 View Solution
Describe the effect of substrate concerntration on enzyme activity.
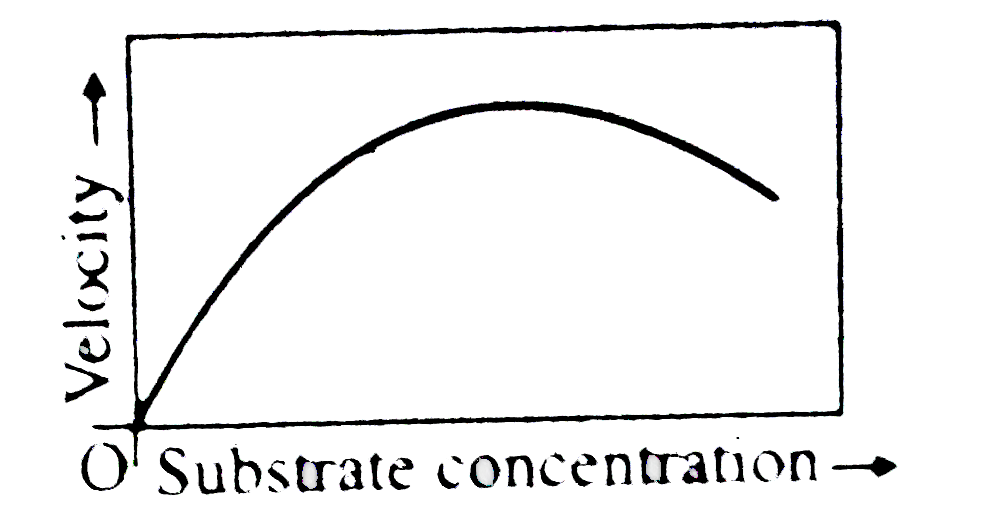
View SolutionThe given graph shows the effect of substrate concentration on the rate of reaction of the enzyme green-gram-phosphatase What does the graph indicate?
View SolutionThe given graph shows the effect of substrate concentration on the rate of reaction of the enzymes green gram-phosphatase. What does the graph indicate ?
 View Solution
The given graph shows the effect of substrate concentration on the rate of reaction of the enzyme green gram-phosphatase

What dose the graph indicateView Solution


