The following graph represents enzyme activity with changing

pH
temperature
either (a) or (b)
neither (A) nor (B)
The correct Answer is:C
Step by step video & image solution for The following graph represents enzyme activity with changing by Biology experts to help you in doubts & scoring excellent marks in Class 12 exams.
Updated on:21/07/2023Topper's Solved these Questions
Similar Questions
Solid and dotted lines represent the activities of pepsin and salivary amylase enzymes of the digestive tract, respectively. Which one of the following graphs best represents their activity vs pH?
View SolutionThe following figure represents the velocity-time graph of a moving car on a road:
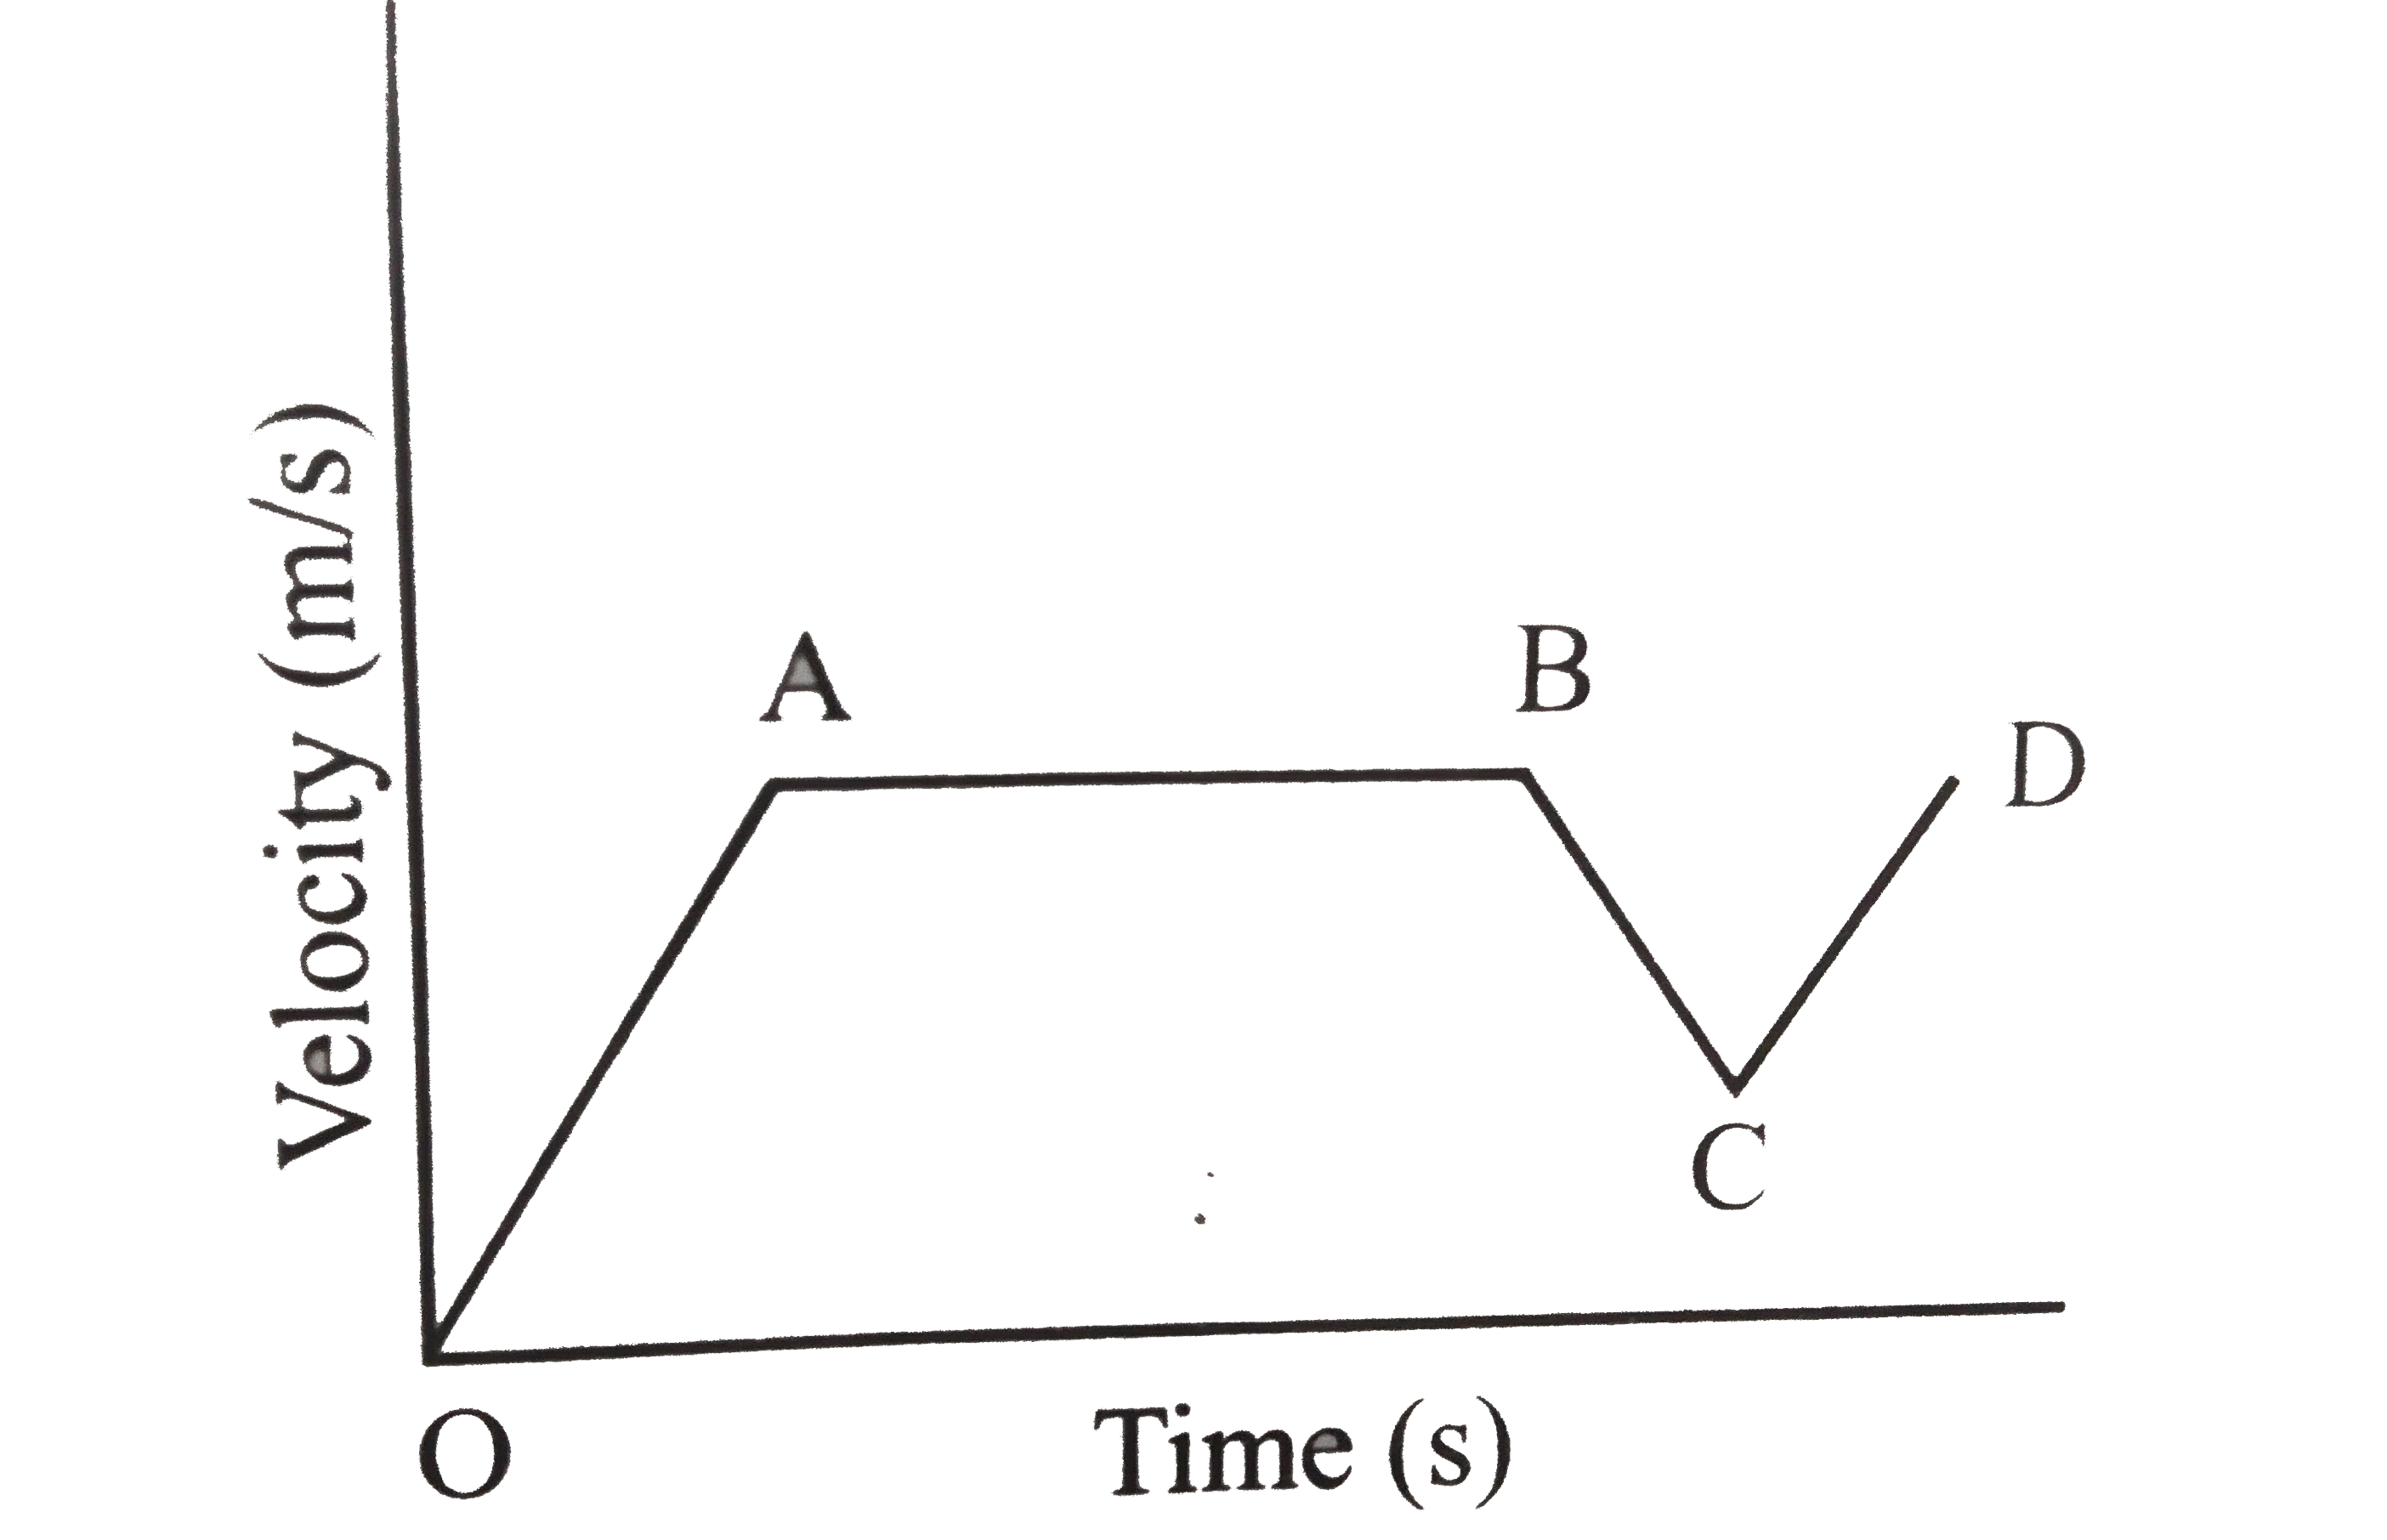
Which segment of the graph represents the retardation?
View Solution
Knowledge Check
Which of the following graphs represents the variation of activity (A) of a radioactive substance with time (t).
A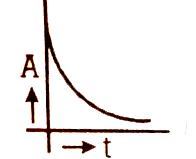 B
B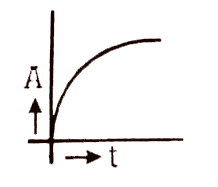 C
C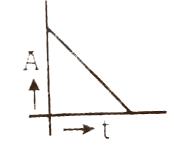 D
D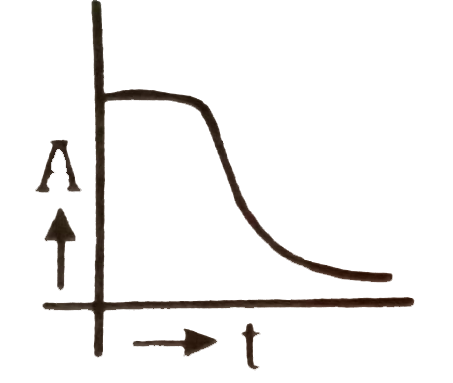
Enzyme activity is maximum at
A300KB310KC320 KD330 KWhich of the following correctly represents the same reaction in which no enzyme is used? Broken line represents the enzyme catalysed reaction for comparison.
A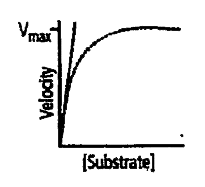 B
B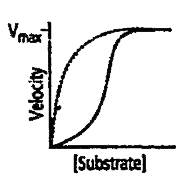 C
C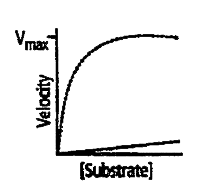 D
D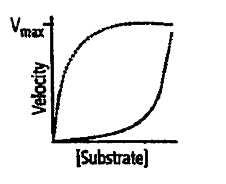
How many of the following are enzymes that act as enzyme activators in alkaline medium Enterokinase,HCl,Bile,Pepsin, Trypsin
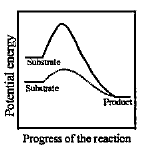
View SolutionThe following graphs with the solid and dotted lines correspond to the reactions without and with enzyme,respectively.Which of the following graph(s) correctly represents the concept of activation energy?
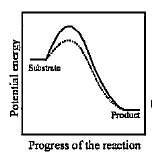
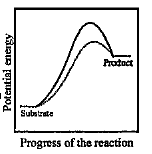
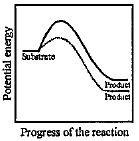
View SolutionWhich one of the following graphs represent the realationship of emperature (in degree centigrade) and enzyme activity in bacteria found in hot springs?
View SolutionWhich of the following graph is correct for the enzyme catalysis ?
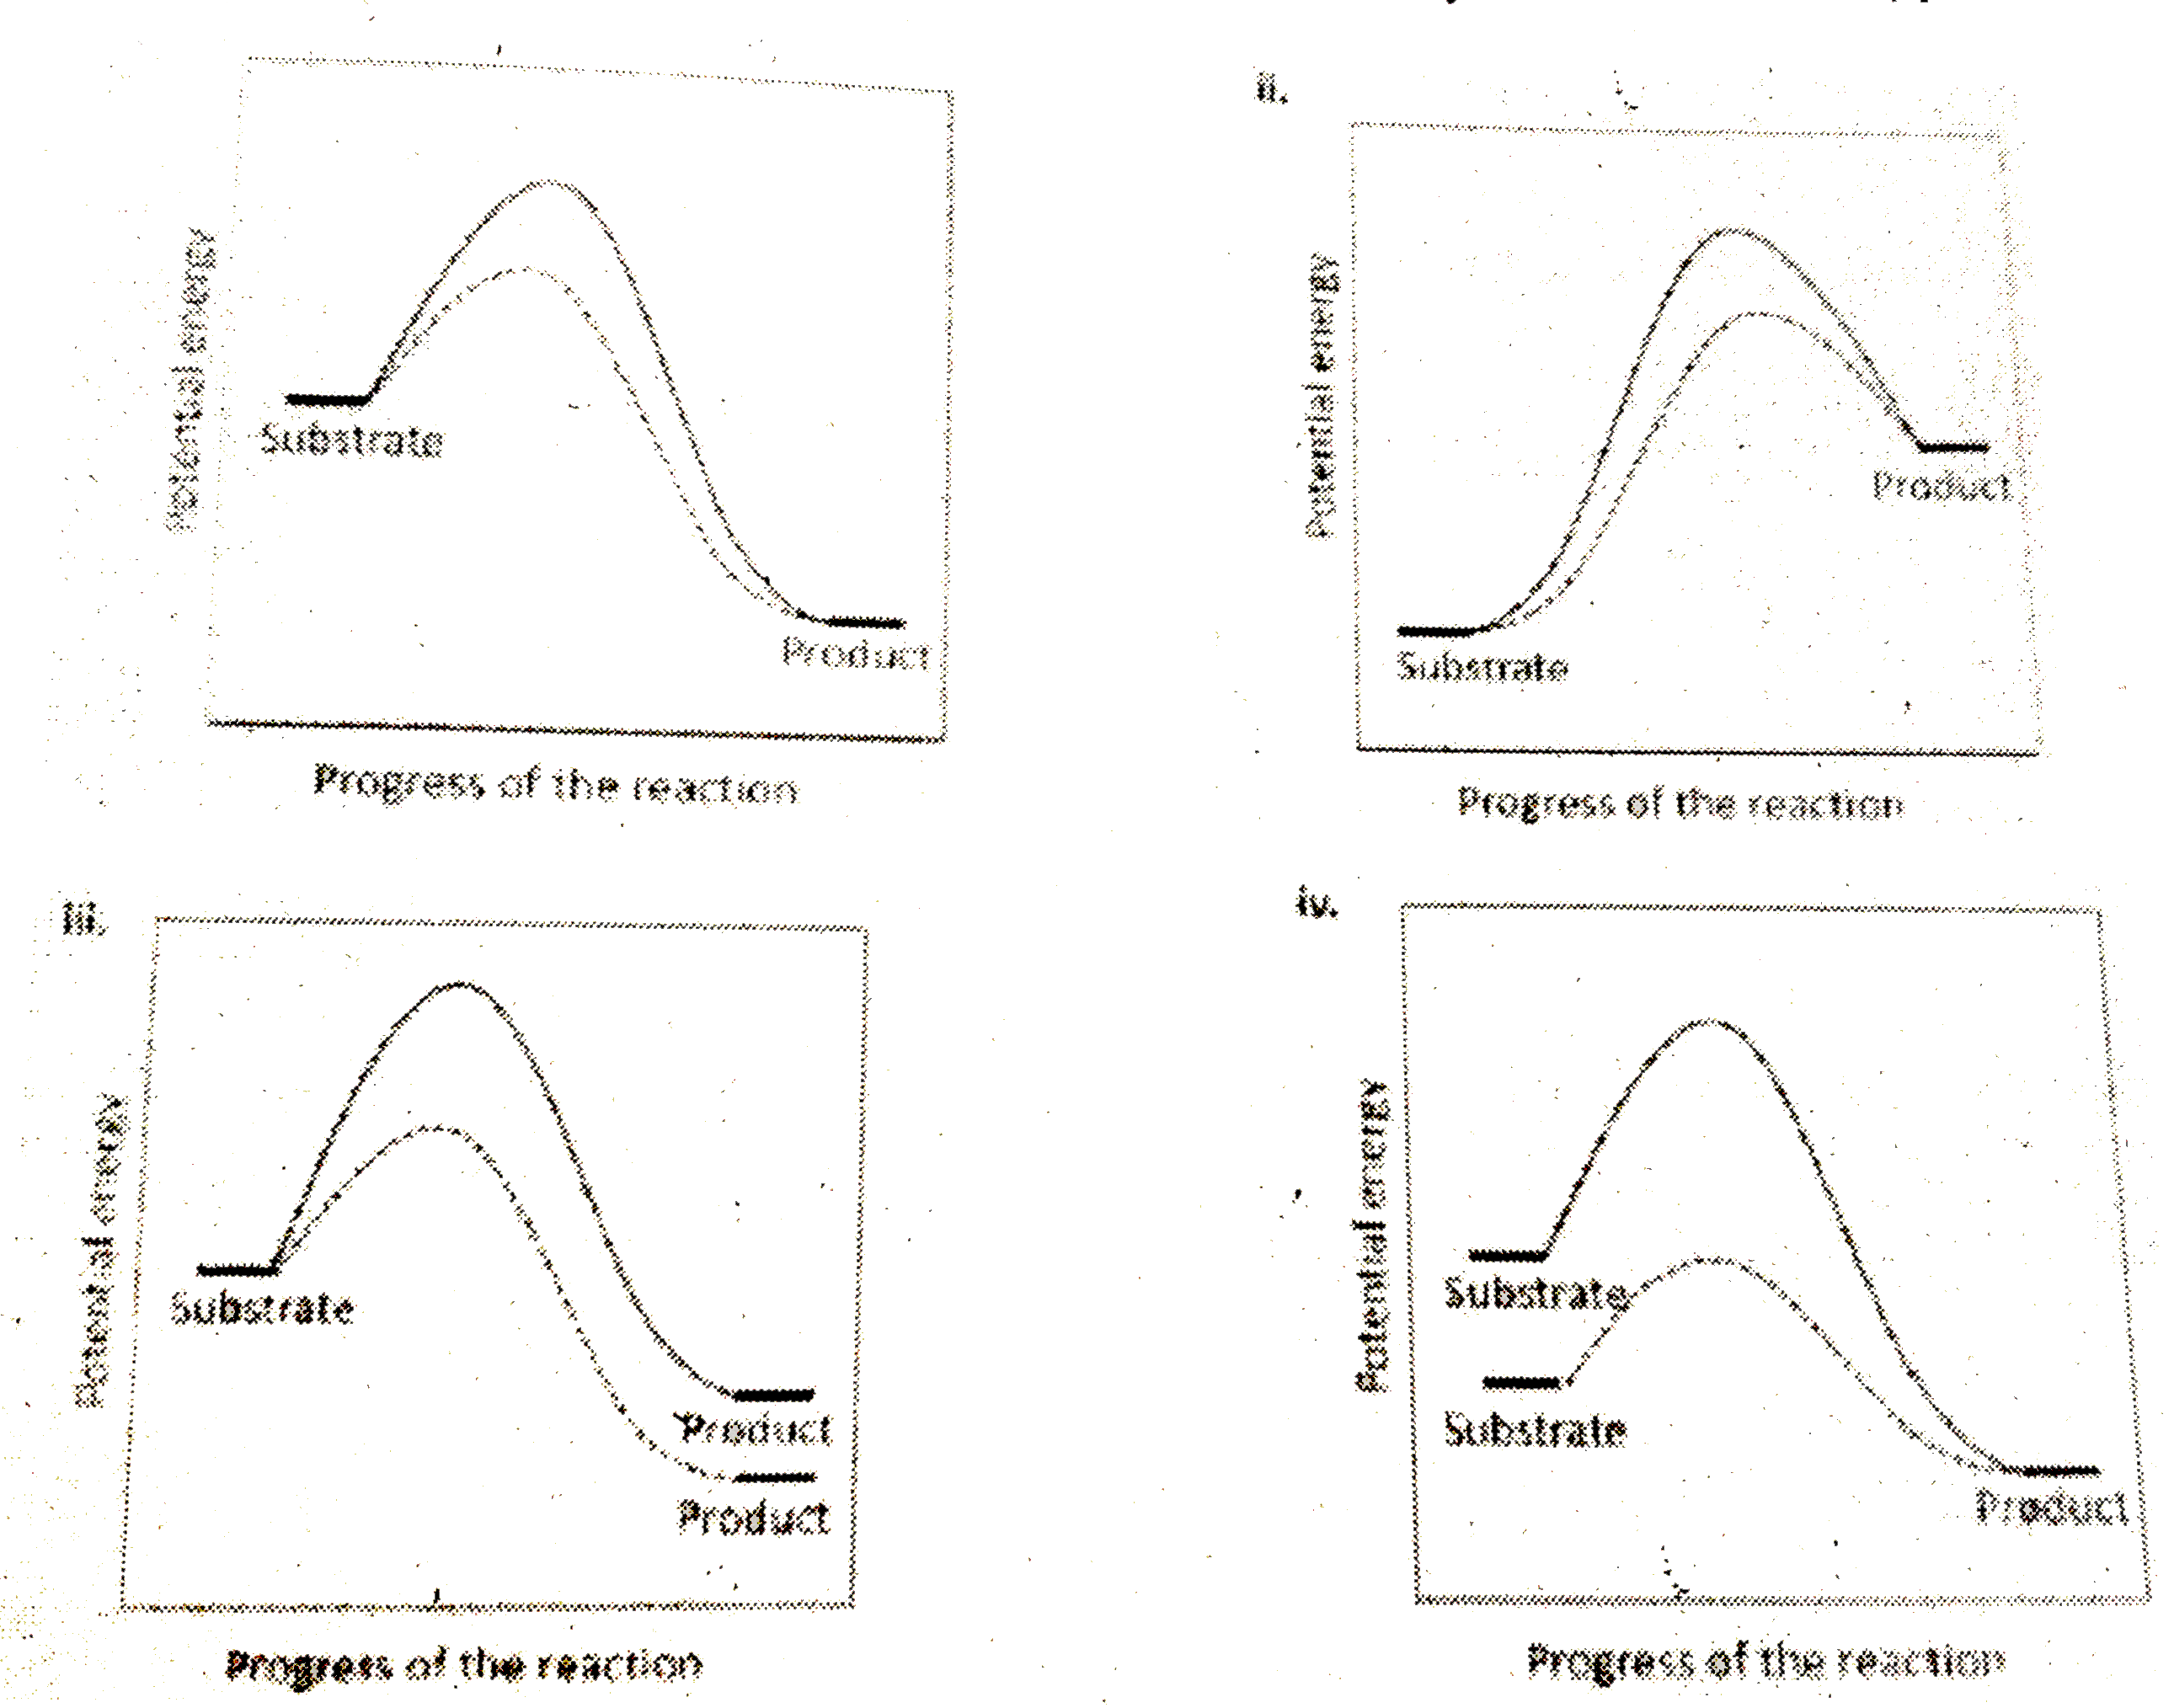
View SolutionThe following graphs with the solid and dotted lines correspond to the reactions without and with enzyme , respectively . Which of the following graph(s) correctly represent the concept of activation energy ?
View Solution
