The curve given show enzymatic activity with relation to three conditions (pH, temp: and substrate conc.). What do the two axises (x and y) represent?
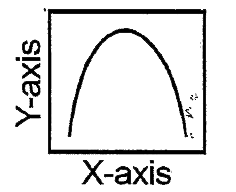
x-axis - Enzymatic activity, y-axis - pH
x-axis - Temperature, y-axis - Enzyme activity
x-axis - Substrate conc., y-axis - Enzymatic activity
x-axis - enzymatic activity, y-axis - temperature
The correct Answer is:B
Step by step video, text & image solution for The curve given show enzymatic activity with relation to three conditions (pH, temp: and substrate conc.). What do the two axises (x and y) represent? by Biology experts to help you in doubts & scoring excellent marks in Class 12 exams.
Updated on:21/07/2023Similar Questions
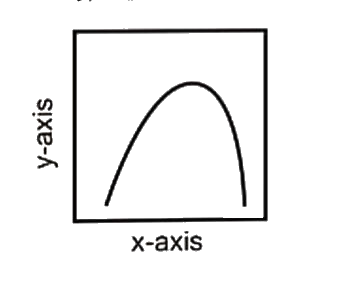
The curve given below shows enzymatic activity with relation to three conditions (pH, temperature and substrate concentration). What does the two axis (x and y) represent ?
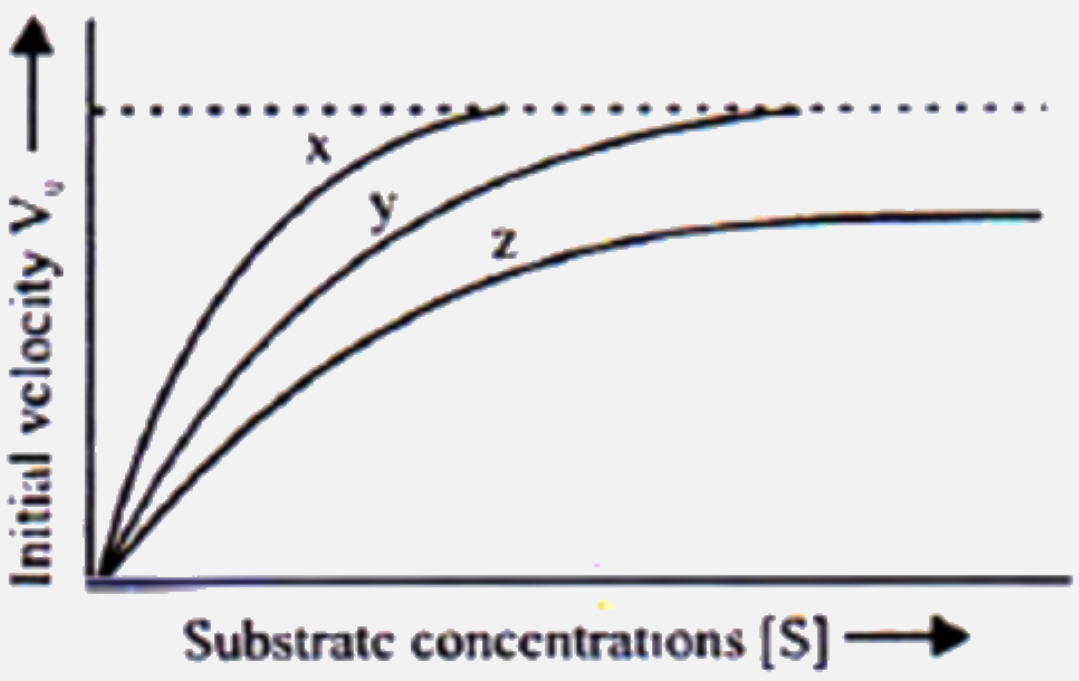
View SolutionThe Given figure shows three velocity-substrate concentration curves of an enzyme reaction. What do the curves X Y and Z depict respectively ?
View Solution
Knowledge Check
The curve given below shows enzymatic activity with relation to three conditions (pH, temperature and substrate concentration). What does the two axis (x and y) represent ?
 AX-axis: Enzymatic activity, Y-axis: pHBX-axis: Temperature, Y-axis: Enzyme activityCX-axis: Substrate concentration, Y-axis: Enzymatic activityDX-axis: Enzymatic activity, Y-axis: Temperature
the curve given below shows wnzymatic acitvity with relation to three conditions (pH , temperature and substrate concentration ).
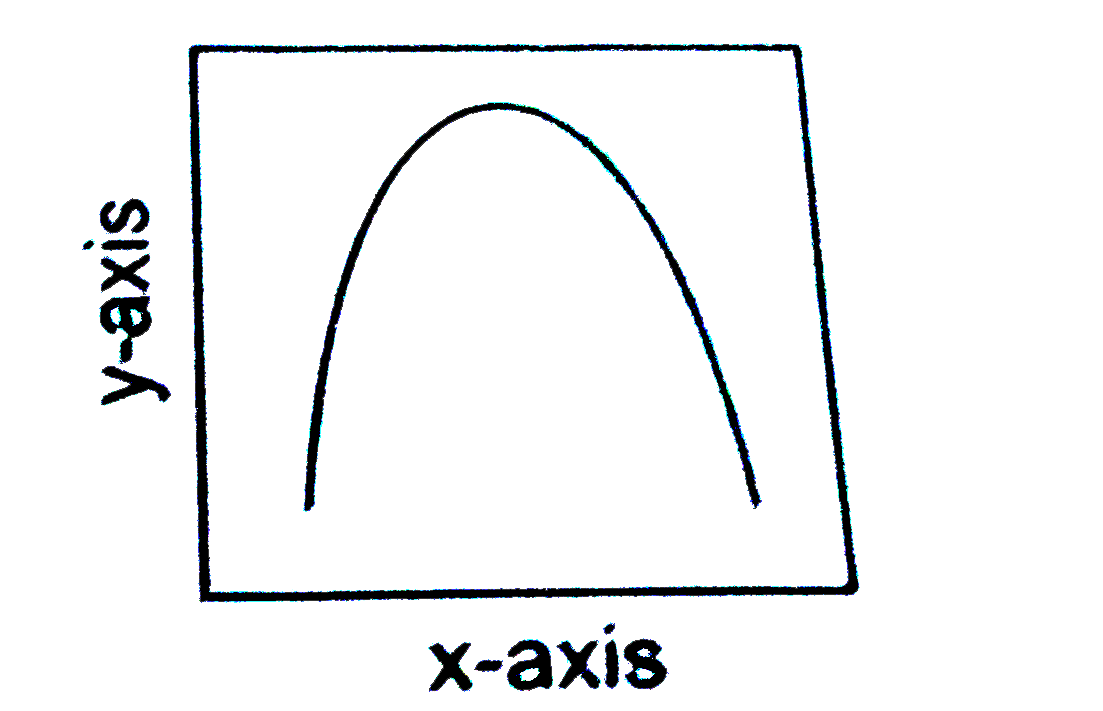
what do the two axes ( x and y) represent ?AEnzymatic acticity , temperatureBEnzymatic activity ,pHCTemperature enzye activityDSubstrate concentration enzymatic activityThe curve is given by x=cos2t,y=sint represents
AA parabolaBCircleCPart of a parabolaDA pair of straight lines
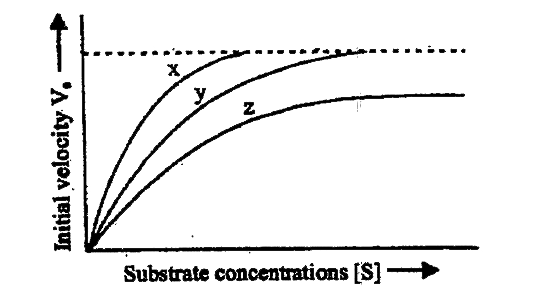
The given figure shows three velocity-substrate concentration curves for an enzyme reaction. What do the curves x, y and z depict respectively?
View SolutionThe curve is given by x=cos2t,y=sint represents
View SolutionThrough any point (x, y) of a curve which passes through the origin, lines are drawn parallel to the coordinate axes. The curve, given that it divides the rectangle formed by the two lines and the axes into two areas, one of which is twice the other, represents a family of
View SolutionThrough any point (x, y) of a curve which passes through the origin, lines are drawn parallel to the coordinate axes. The curve, given that it divides the rectangle formed by the two lines and the axis into two areas, one of which is twice the other, represent a family of
View SolutionTrees showing seasonal activities represents what kind of growth curve?
View Solution
