The accompanying graph indicates digestion of food. 1, 2 and 3 indicate:

A
1 and 2-mouth, 3-stomach
B
1-mouth, 2-stomach, 3-small intestine
C
1-mouth, 2-oesophagus, 3-stomach
D
1-stomach, 2-small intestine, 3-large intestine
Text Solution
The correct Answer is:D
|
Similar Questions
Knowledge Check
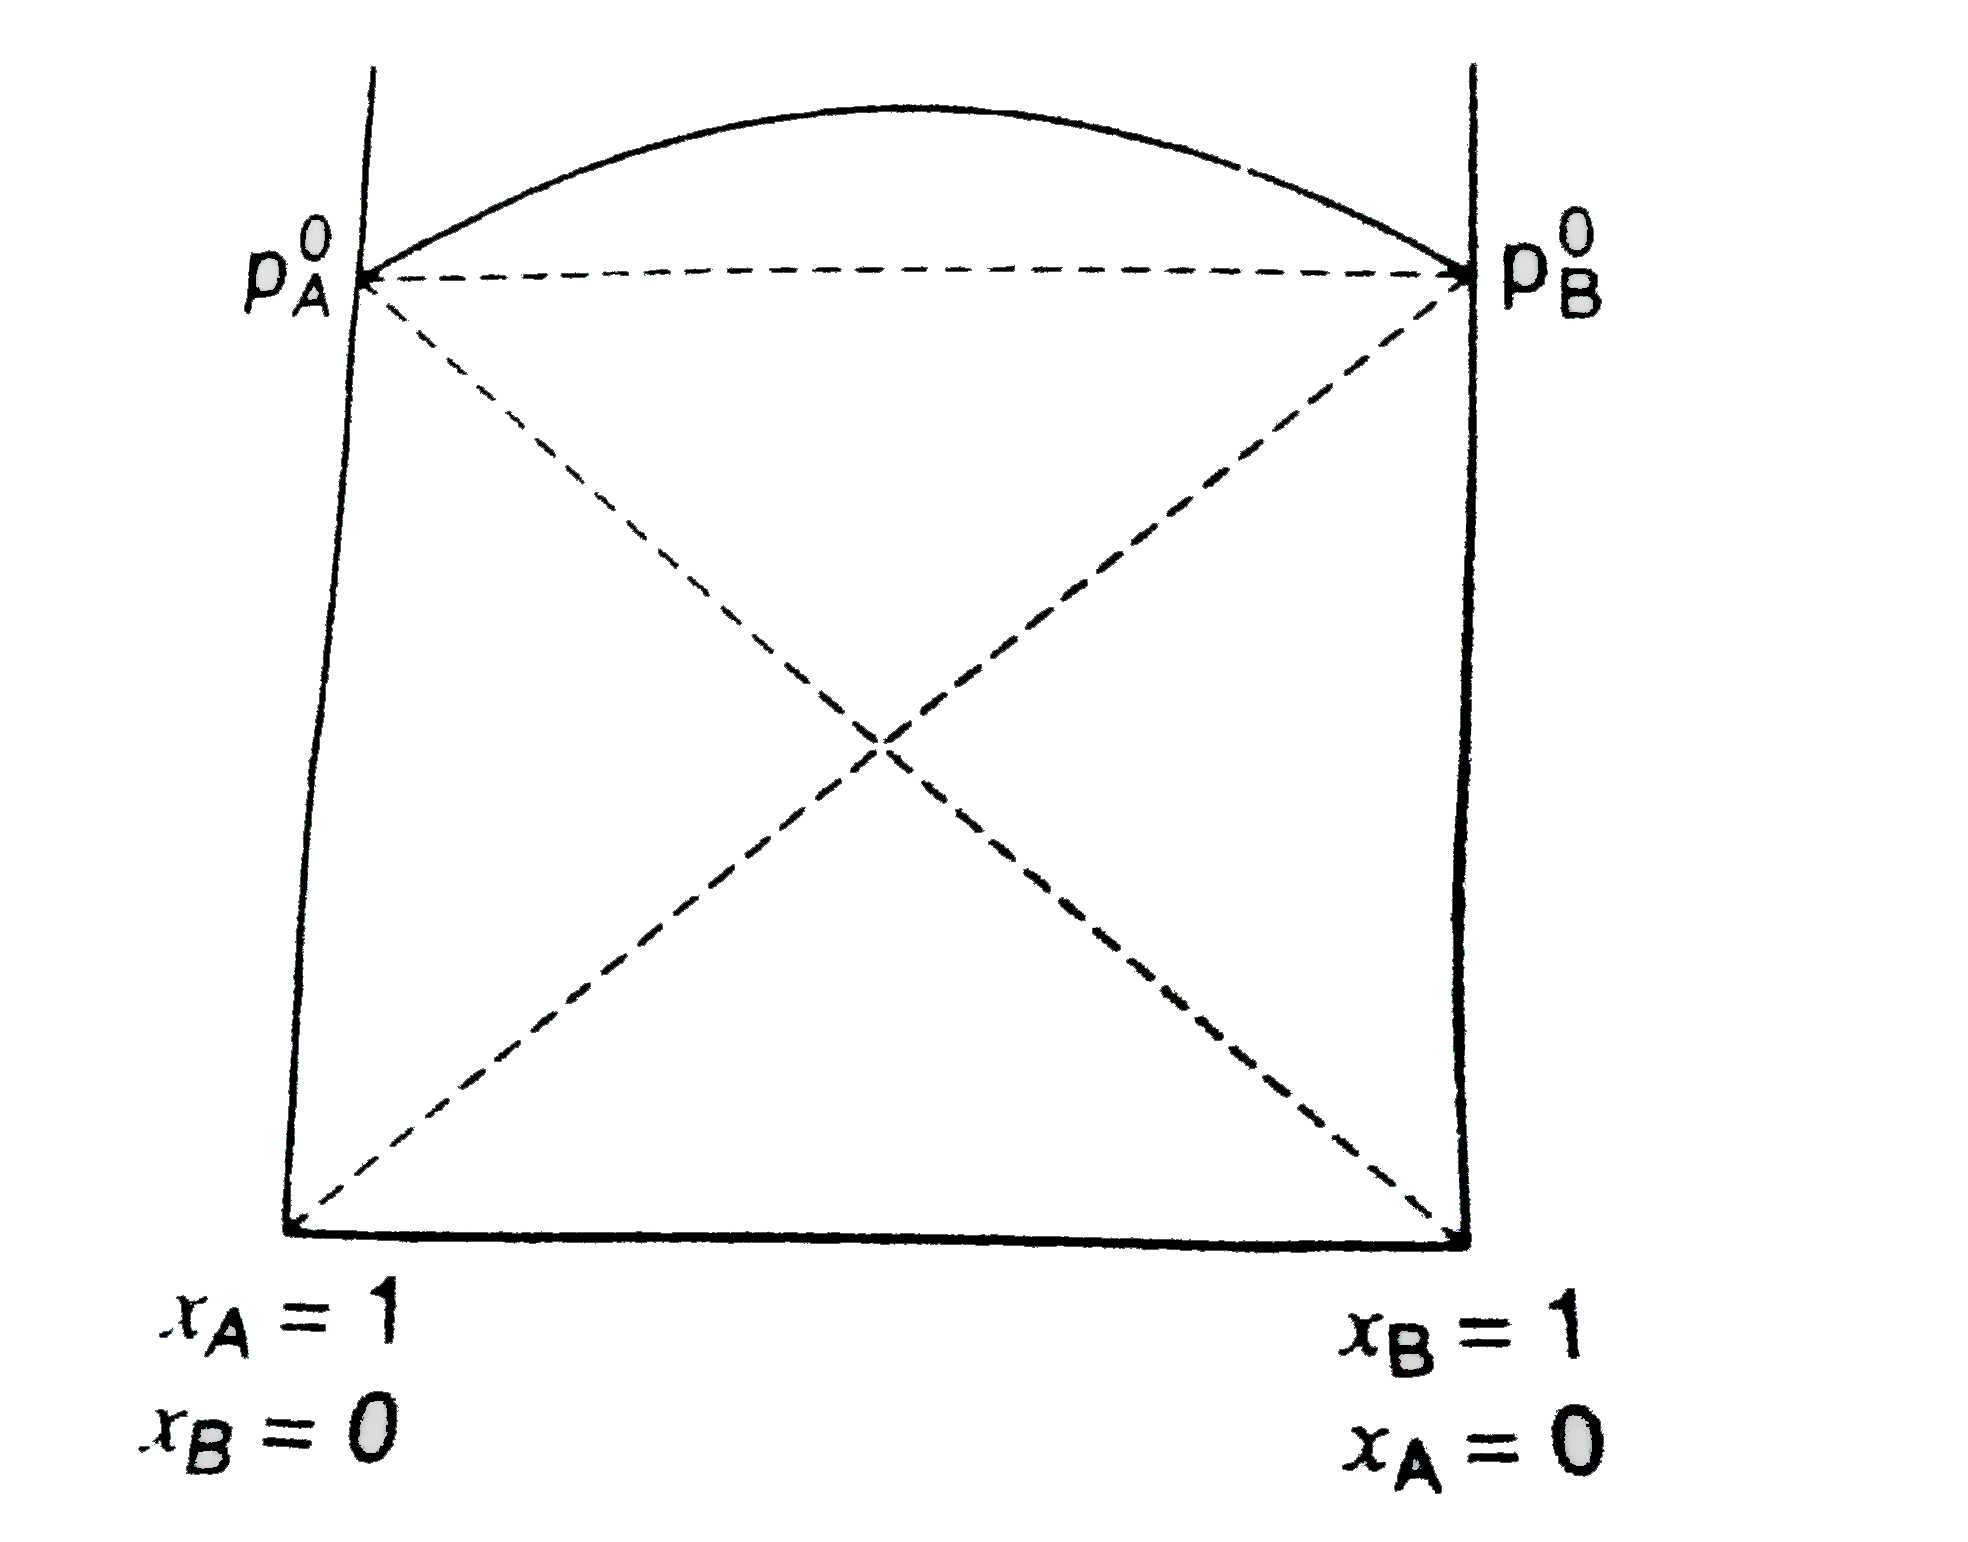
The given graph indicates :
 A(+) deviationB(-) deviationCno deviationDnone of these
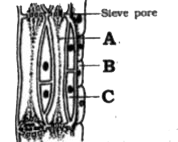
Refer to the accompanying figures and identify the types of simple tissue indicated by A, B and C
 AA-Sieve tube, B - Phloem parenchyma, Ċ - Companion cellBA-Vessel, B-Xylem parenchyma, C- Companion cellCA- Sieve tube, B - Phloem parenchyma, C-Phloem fibreDA-Sieve tube, B - Companion cell, C-Phloem parenchyma
In the above graph, point D indicates
ALimiting PoointBYield pointCBreaking pointDElastic limit
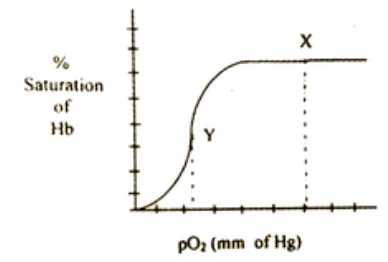
The accompanying graph depicts the % saturation of vertebrate haemoglobin with oxygen what does x and y indicate ?

View SolutionIn the above graph, point B indicates
View SolutionThe statement ''Tiger is the apex of food chain'' indicates
View SolutionRefer to the accompanying figures and identify the types of simple tissue indicated by A, B, C and D

View SolutionIn the above graph, point B indicates.
View Solution

