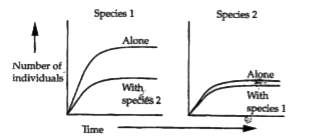
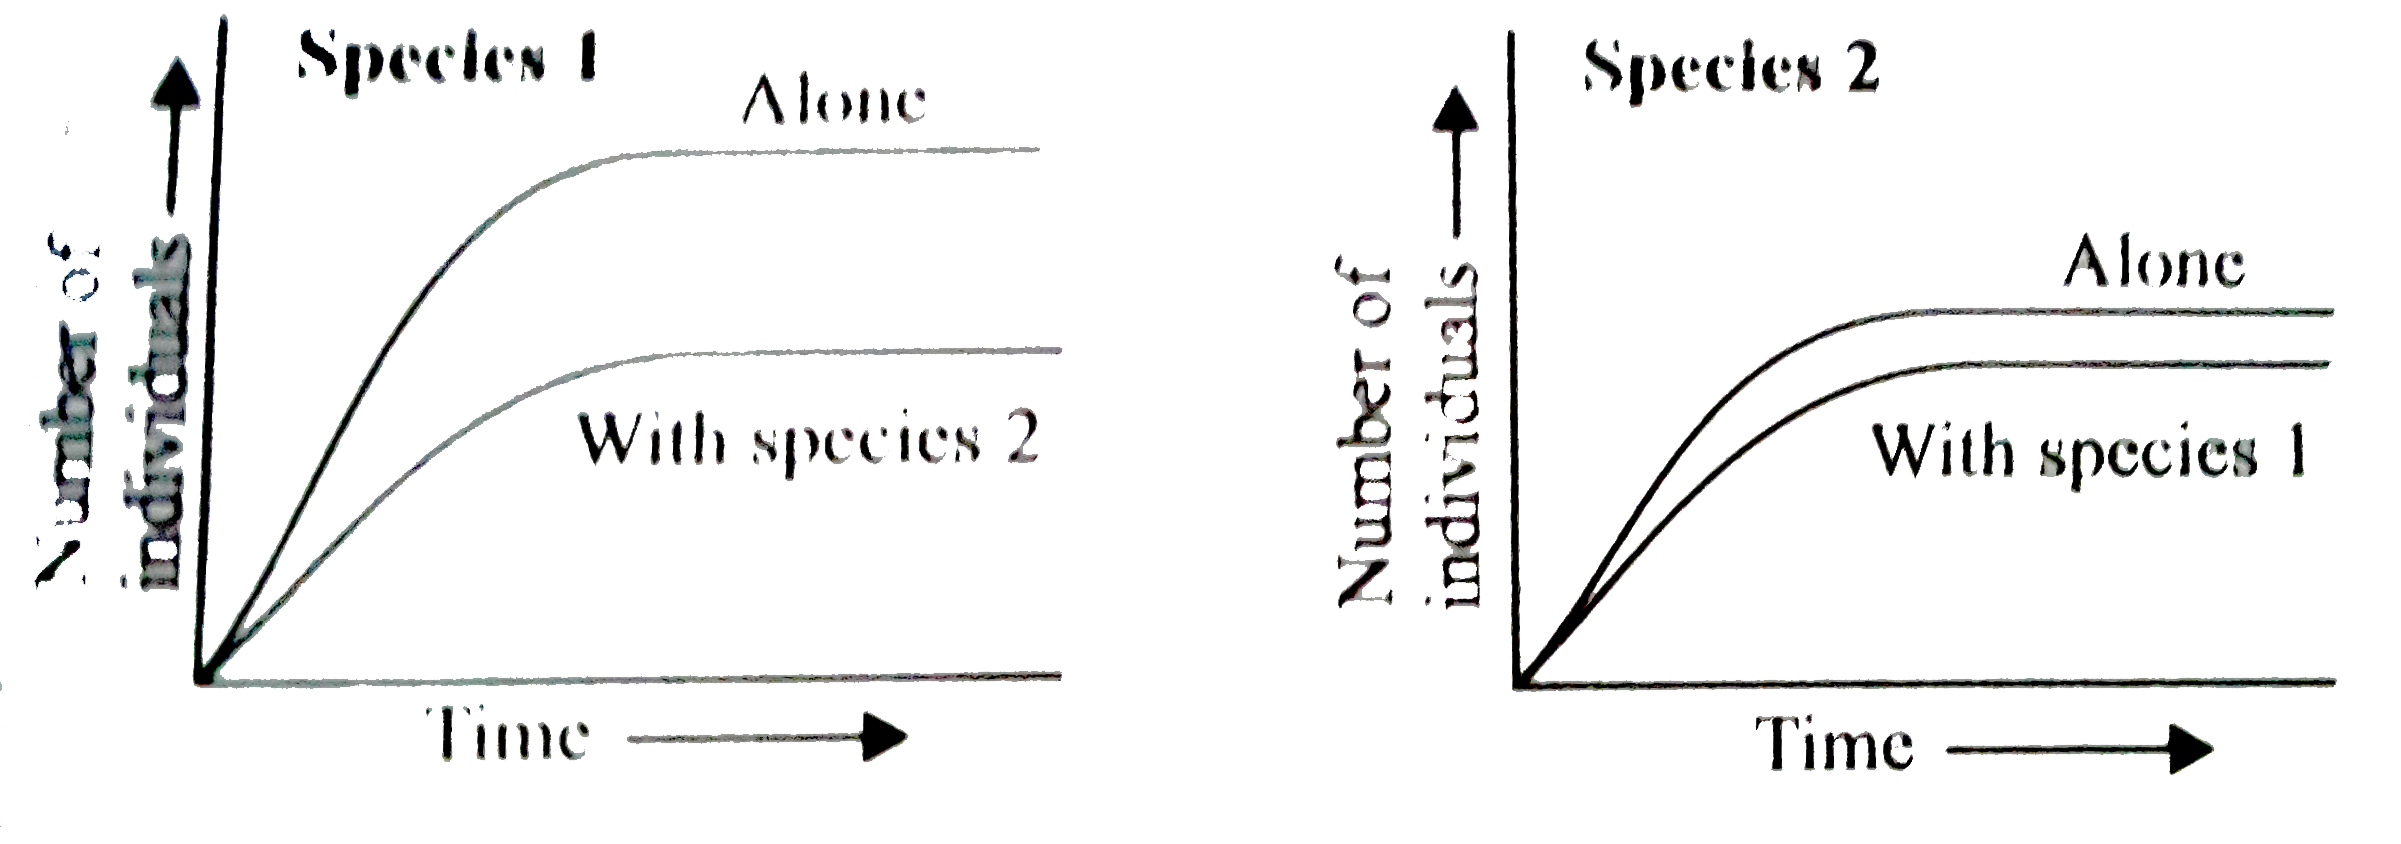
In laboratory experiments, two species of the protist Paramecium were grown alone and in the presence of the other species. The following graphs show growth of species 1 (left nd species 2 (right), both alone and when in mixed culture.

Interpretation of these graphs shows that -
competitive exclusion occurred in these experiments.
both species are affected by interspecific competition but species 1 is affected less.
both species are affected by interspecific competition but species 2 is affected less.
both species are affected equally by interspecific competition.
The correct Answer is:C
Similar Questions
Which one of the following plants shows a very close relationship with a species of moth, where none of the two can complete its life cycle without the other
View SolutionWhich one of the following plants shows a very close relationship with a species of moth, where none of the two can complete its life cycle without the other
View Solution
Knowledge Check
In laboratory experiments, two species of the protist Paramecium (species 1 and 2) were grown alond and in the presence of the other species. The following graphs show growth of species 1 and species 2, both alone and when in mixed culture with the other species.
 Which of the following conclusions can be drawn from the graphs ? ACompetitive exclusion occurred in these experiments.BBoth species are affected by interspecific competition but species 1 is affected less.CBoth species are affected by interspecific competition but species 2 is affected less.DBoth species are affected equally by interspecific competition.
In laboratory experiments, two species of the protist Paramecium (species 1 and 2) were grown alond and in the presence of the other species. The following graphs show growth of species 1 and species 2, both alone and when in mixed culture with the other species.
 Which of the following conclusions can be drawn from the graphs ? ACompetitive exclusion occurred in these experiments.BBoth species are affected by interspecific competition but species 1 is affected less.CBoth species are affected by interspecific competition but species 2 is affected less.DBoth species are affected equally by interspecific competition.
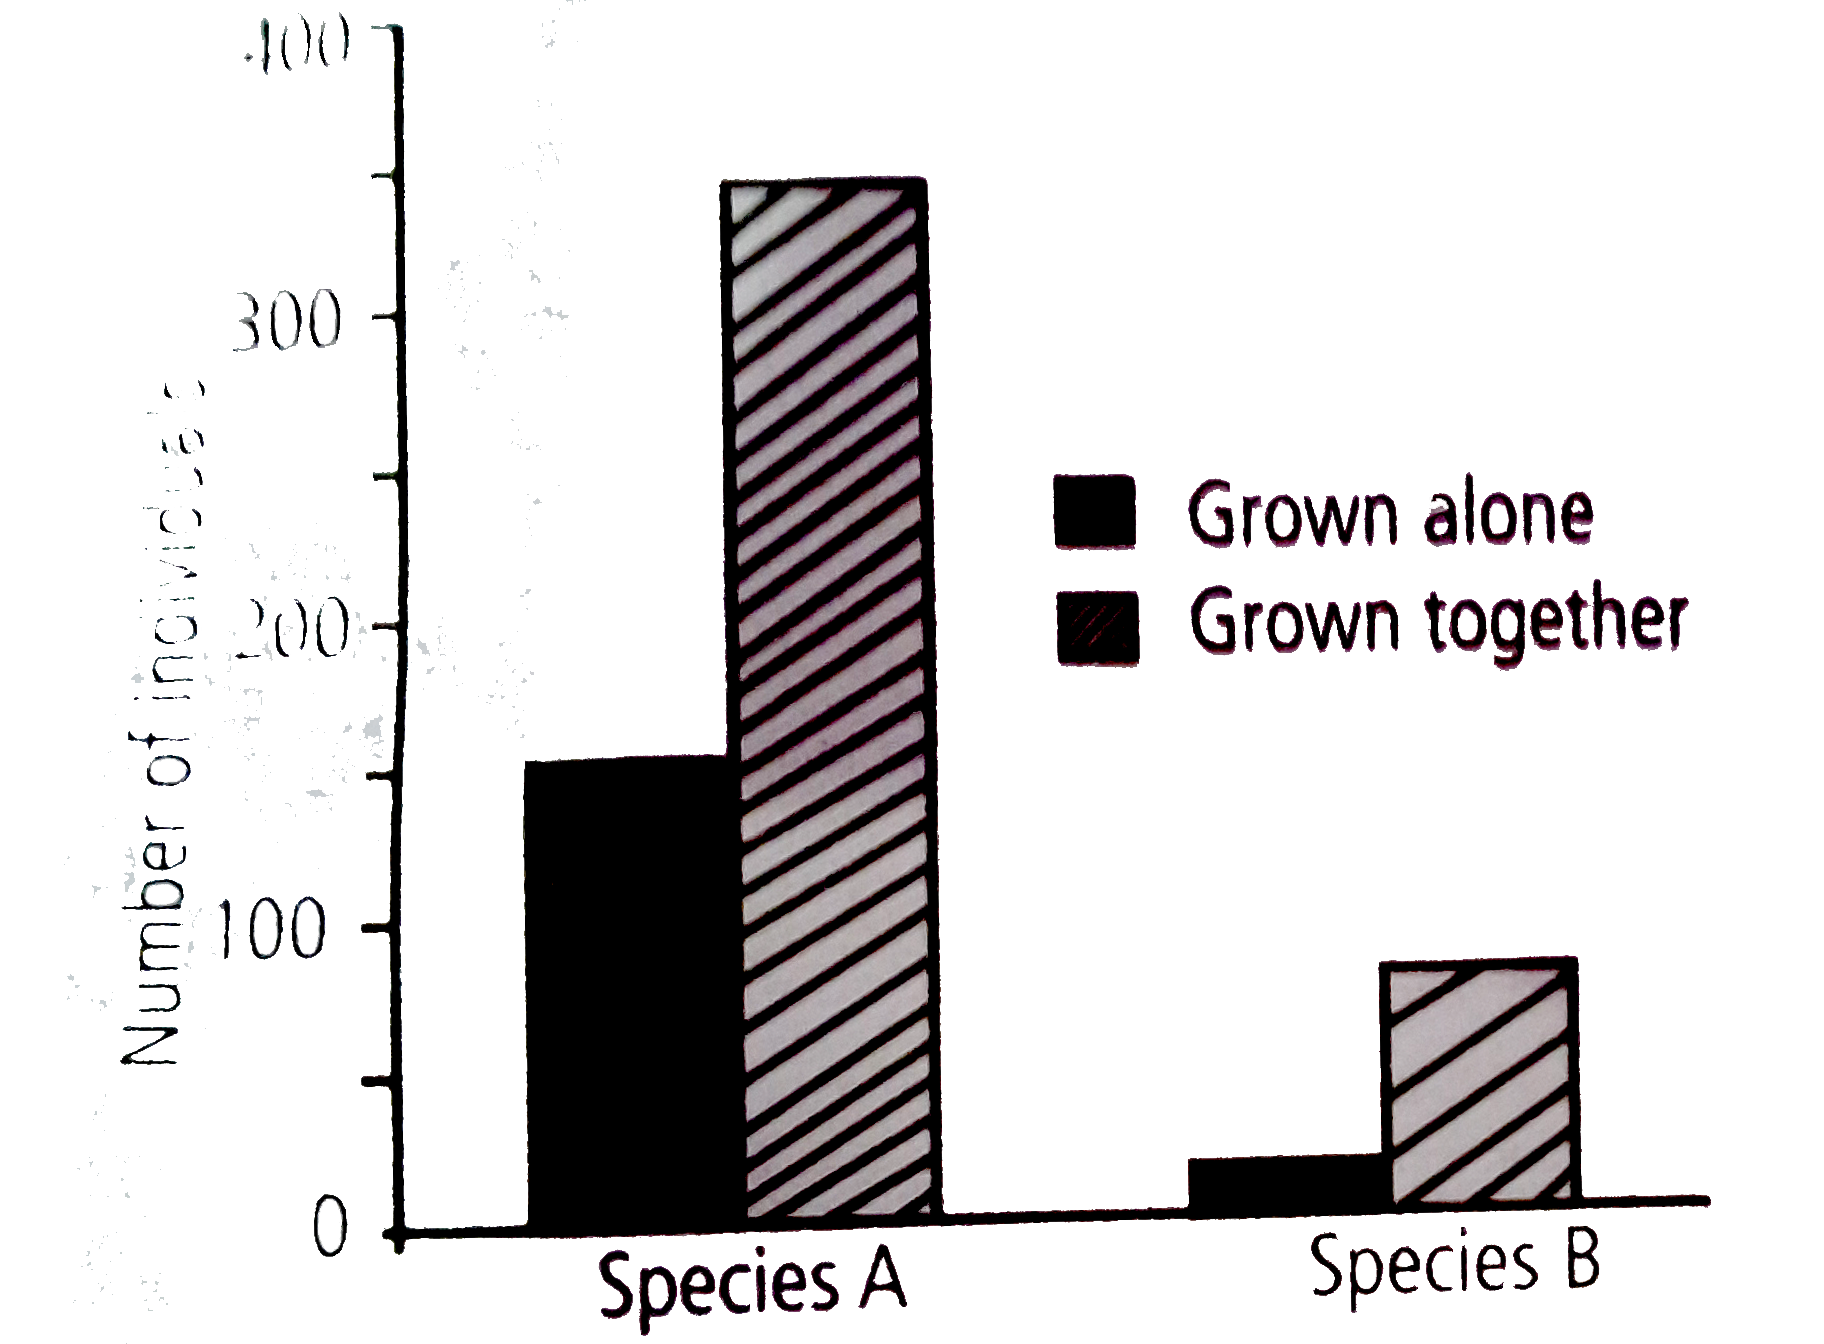
Two insect species were used in a laboratory experiment. For one treatment, both species were grown by themselves (in separate chambers) on a suitable food source. For the second treatment, the two species were grown together (in the same chamber) on the same type and amount of food as in the first treatment. The given figure showns the results (the number of individuals of each species in the two treatments) at the end of the experiment. Based on these results the two species should be classified as
 AcompetitorsBmutualistsCpredators of pathogensDcommensalists
Two insect species were used in a laboratory experiment. For one treatment, both species were grown by themselves (in separate chambers) on a suitable food source. For the second treatment, the two species were grown together (in the same chamber) on the same type and amount of food as in the first treatment. The given figure showns the results (the number of individuals of each species in the two treatments) at the end of the experiment. Based on these results the two species should be classified as

View SolutionWhich one of the following plants shows a very close relationship with a species of moth, where none of the two can complete its life cycle without the other
View SolutionWhich one of the following plants shows a very close relationship with a species of moth, where none of the two can complete its life cycle without the other
View SolutionWhich one of the following plants shows a very close relationship with a species of moth, where none of the two can complete its life cycle without the other
View Solution
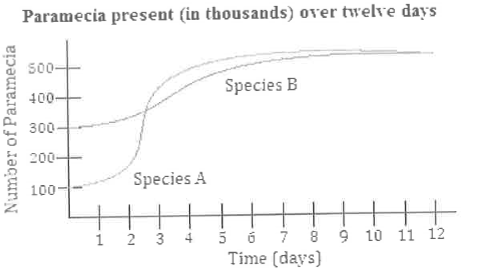
A small puddle is monitored by scientists for the number of paramecia present. The scientists are in two distinct species, let's call them ''species A'' and ''species B''. At time t = 0, the scientists measure and estimate the amount of species A and species B present in the puddle. They then proceed to measure and record the number of each species of paramecium present every hour for 12 days. the data for each species were then fit by a smooth curve, as shown in the graph above. Which of the following is a correct statement about the data above?
View Solution
