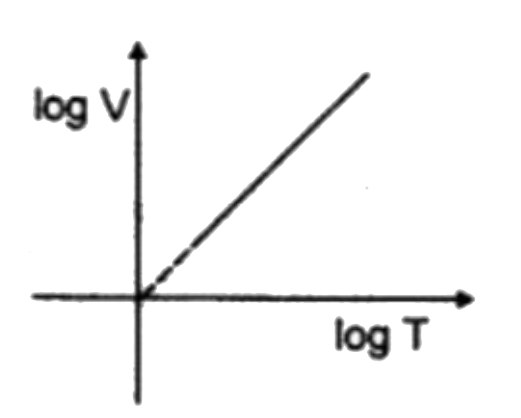
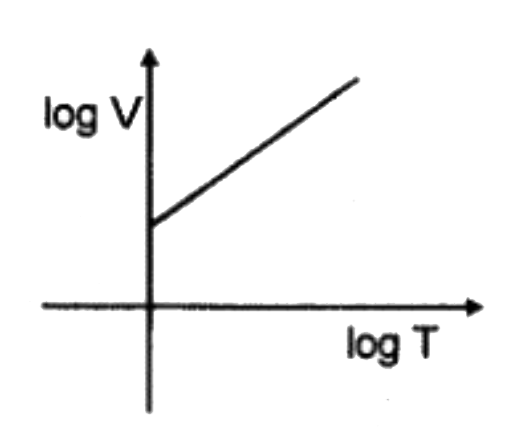
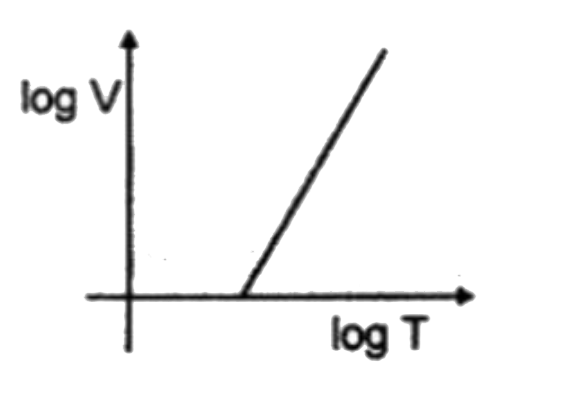
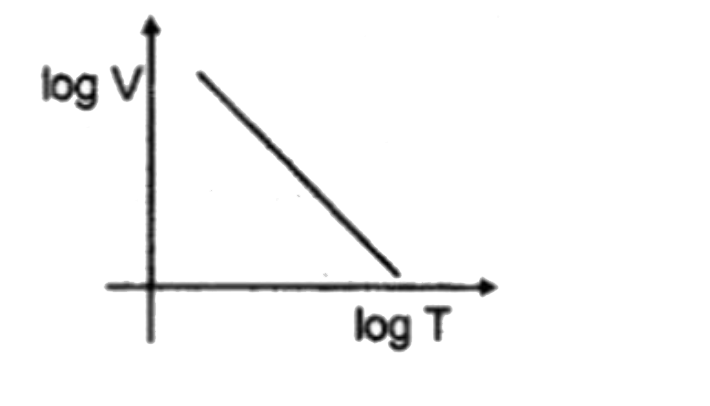
Which of the following sketches is an isobars (Given : nRP>1 )


The correct Answer is:B
To solve the question regarding which of the provided sketches represents isobars, given the condition nRP>1, we can follow these steps:
Step 1: Understand the Ideal Gas Law
The ideal gas law is given by the equation:
PV=nRT
From this, we can express the volume V in terms of pressure P and temperature T:
V=nRTP
Step 2: Analyze the Given Condition
We are given the condition:
nRP>1
This implies:
V>T
This means that for the isobars we are looking for, the volume must be greater than the temperature.
Step 3: Rewrite the Condition in Logarithmic Form
To find the appropriate graph, we can express the condition in logarithmic terms:
logV>logT
This means we need to find a graph where the logarithm of volume is greater than the logarithm of temperature.
Step 4: Evaluate Each Graph
We have four graphs to evaluate:
1. Graph 1: V=T (This means logV=logT)
- This does not satisfy our condition since logV is not greater than logT.
2. Graph 2: V>T (This means logV>logT)
- This satisfies our condition, making this a valid representation of isobars.
3. Graph 3: T>V (This means logT>logV)
- This does not satisfy our condition since logT is not greater than logV.
4. Graph 4: Mixed conditions where V>T at one point and T>V at another.
- This does not consistently satisfy our condition.
Conclusion
Based on the evaluation of the graphs, the correct answer is Graph 2, where logV>logT.
The ideal gas law is given by the equation:
PV=nRT
From this, we can express the volume V in terms of pressure P and temperature T:
V=nRTP
We are given the condition:
nRP>1
This implies:
V>T
This means that for the isobars we are looking for, the volume must be greater than the temperature.
To find the appropriate graph, we can express the condition in logarithmic terms:
logV>logT
This means we need to find a graph where the logarithm of volume is greater than the logarithm of temperature.
We have four graphs to evaluate:
- This does not satisfy our condition since logV is not greater than logT.
- This satisfies our condition, making this a valid representation of isobars.
- This does not satisfy our condition since logT is not greater than logV.
- This does not consistently satisfy our condition.
Based on the evaluation of the graphs, the correct answer is Graph 2, where logV>logT.
Similar Questions
Which of the following pairs represents isobars?
View SolutionWhich of the following process lead to formation of isobars ?
View SolutionWhich of the following is a V-T curve for isobaric process?
View SolutionWhich of the following process not lead to formation of isobars?
View SolutionIn which of the following reaction Kp>Kc
View SolutionIn which of the following reaction Kp>Kc
View SolutionIn which of the following reaction Kp>Kc
View SolutionWhich of the following when mixed, will given a solution with pH>7.
View SolutionWhich of the following could be the sketch graph of y=d(xlnx)dx
View SolutionWhich of these are a pair of Isotones and Isobars?
View Solution

