In an experiment , to find the loss of energy with respect to time in case of swinging simple pendulum , the graph between (amplitude)2 and time is


The correct Answer is:A
To solve the problem of finding the graph that represents the relationship between the square of the amplitude and time for a swinging simple pendulum, we can follow these steps:
1. Understand the Pendulum Motion: A simple pendulum swings back and forth, and as it does so, it gradually loses energy due to air resistance and friction. This loss of energy leads to a decrease in the amplitude of the pendulum's swing over time.
2. Identify the Relationship: As the pendulum loses energy, the amplitude (A) of the swing decreases. Since we are interested in the square of the amplitude (A²), we can say that A² will also decrease as time increases.
3. Graphical Representation: We need to find a graph that shows a decrease in A² with respect to time. This means that as time increases, A² should decrease.
4. Analyze the Options:
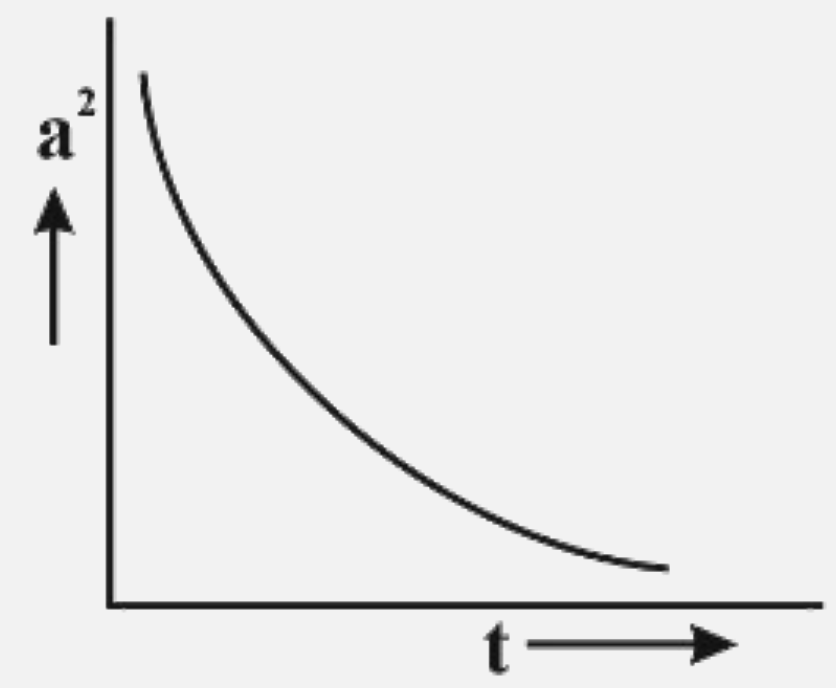
- Graph A: This graph shows a hyperbolic curve that decreases as time increases. This indicates that A² is decreasing, which is consistent with our understanding of a pendulum losing energy.
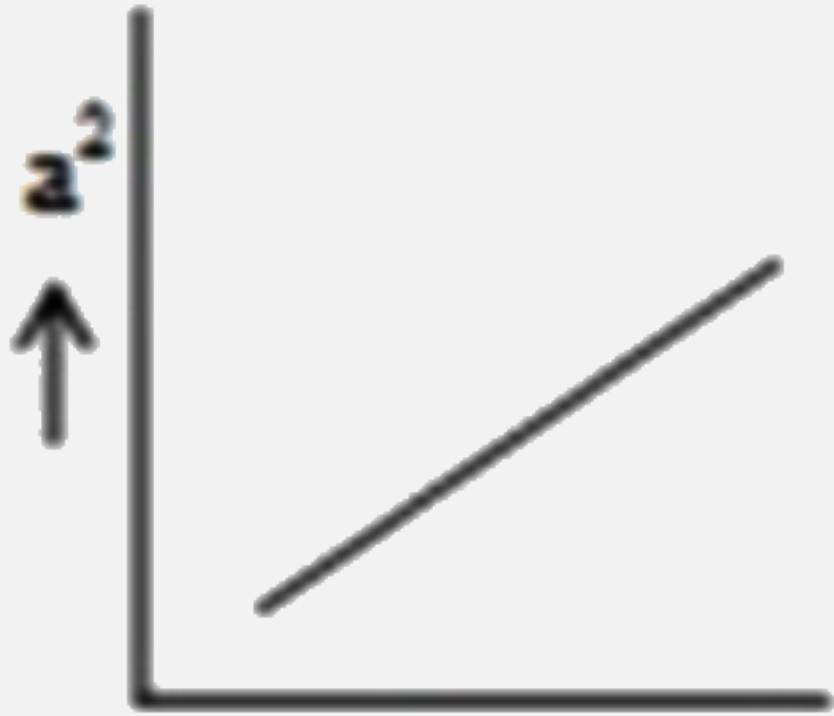
- Graph B: This graph shows a straight line that increases with time, which is incorrect as it suggests that A² is increasing.
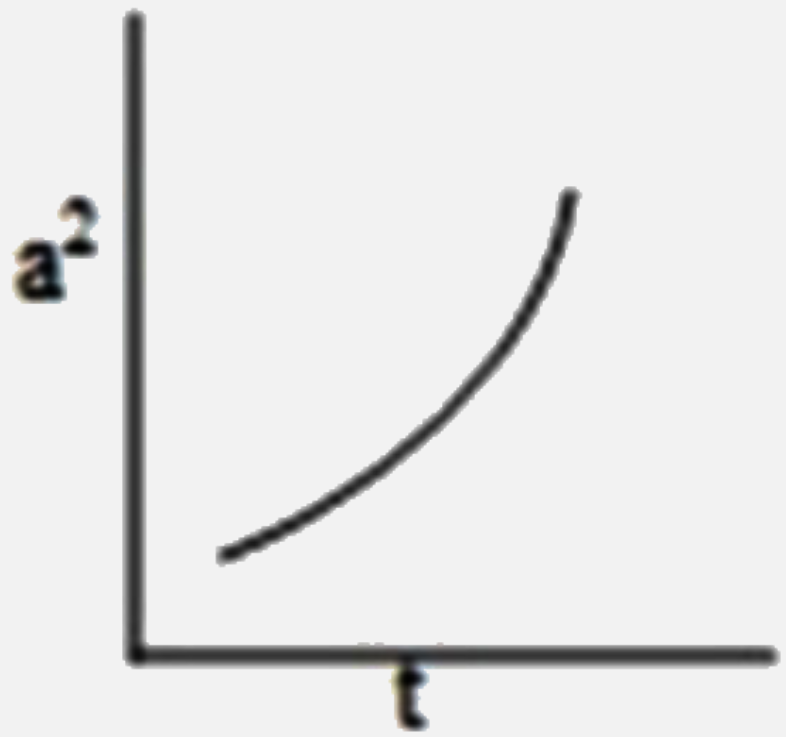
- Graph C: Similar to Graph B, this graph shows A² increasing with time, which is also incorrect.
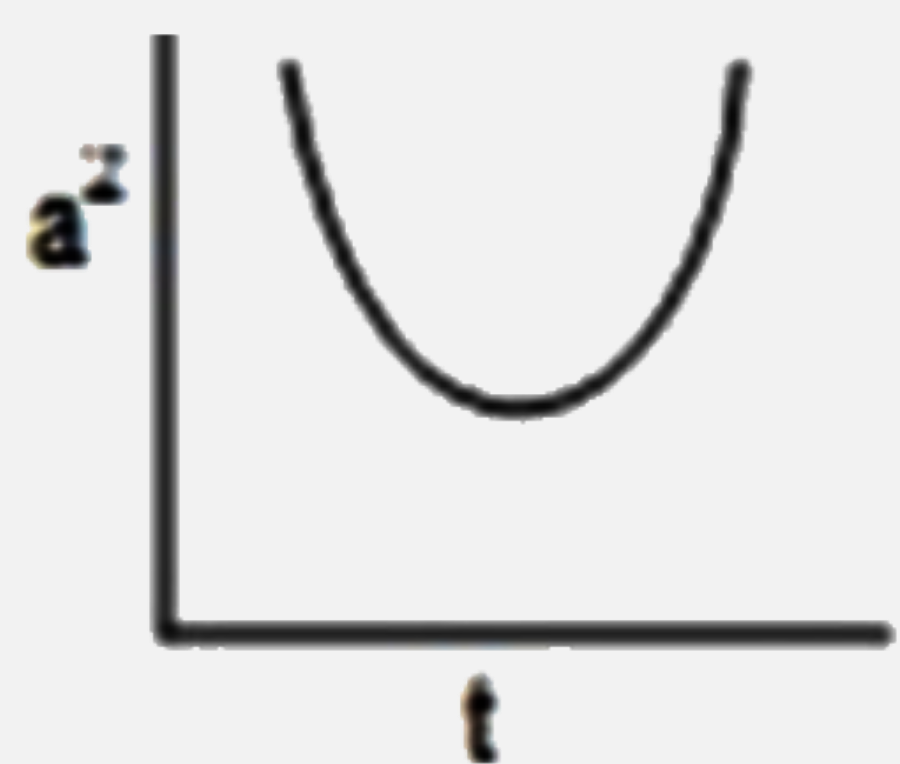
- Graph D: This graph shows A² decreasing initially and then increasing, which does not represent the behavior of a pendulum losing energy.
5. Conclusion: The only graph that correctly represents the relationship between the square of the amplitude and time, considering the loss of energy in a swinging simple pendulum, is Graph A.
Final Answer:
The correct graph between (amplitude)² and time is Graph A.
---
- Graph A: This graph shows a hyperbolic curve that decreases as time increases. This indicates that A² is decreasing, which is consistent with our understanding of a pendulum losing energy.
- Graph B: This graph shows a straight line that increases with time, which is incorrect as it suggests that A² is increasing.
- Graph C: Similar to Graph B, this graph shows A² increasing with time, which is also incorrect.
- Graph D: This graph shows A² decreasing initially and then increasing, which does not represent the behavior of a pendulum losing energy.
The correct graph between (amplitude)² and time is Graph A.
Similar Questions
Knowledge Check
What is the effect on the time period of a simple pendulum if the mass off the bob is doubled?
AHalvedBDoubleCBecomes 8 timesDNo effects
In case of a simple pendulum, time period versus length is depicted by
View SolutionThe time period of a simple pendulum of length 9.8 m is
View SolutionIn an experiment to determine the value of acceleration due to gravity g using a simple pendulum , the measured value of lenth of the pendulum is 31.4 cm known to 1 mm accuracy and the time period for 100 oscillations of pendulum is 112.0 s known to 0.01 s accuracy . find the accuracy in determining the value of g.
View SolutionState how does the time period of a simple pendulum depend on amplitude of oscillation .
View SolutionThe time period of a simple pendulum is 2 s. Find its frequency .
View SolutionThe time period of a simple pendulum is 2 s. What is its frequency?
View SolutionName two factors on which the time period of a simple pendulum does not depend.
View Solution
