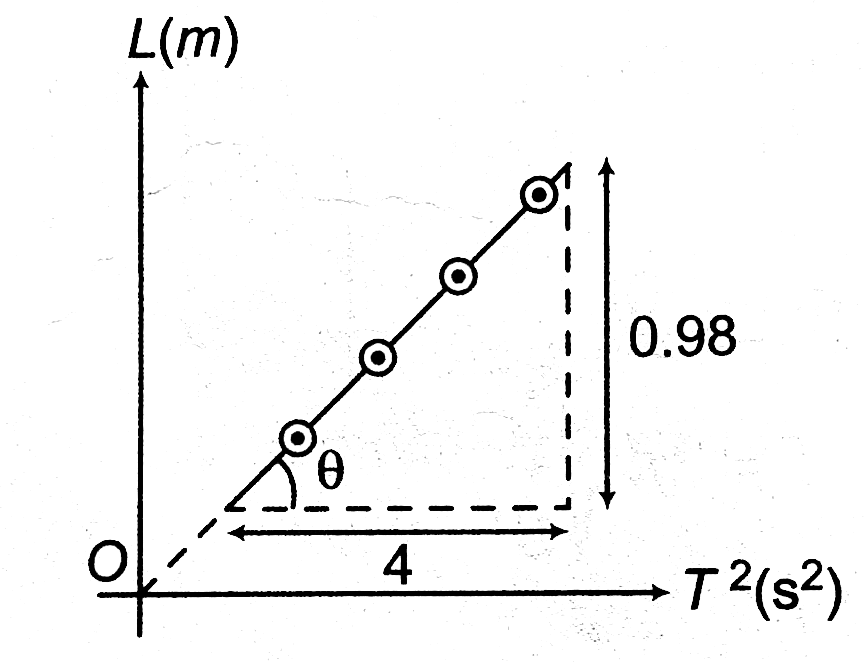
While determining the value of g using simple pendulum, we plot a graph between l and T2 which is
a straight line
a parabola
an ellipse
a circle
The correct Answer is:A
To determine the value of g using a simple pendulum, we can analyze the relationship between the length of the pendulum (l) and the square of the period of oscillation (T²). The following steps outline how we arrive at the conclusion that the graph between l and T² is a straight line:
1. Understanding the Relationship:
The period T of a simple pendulum is given by the formula:
\(
T = 2\pi \sqrt{\frac{l}{g}}
\)
Squaring both sides, we get:
\(
T^2 = 4\pi^2 \frac{l}{g}
\)
2. Rearranging the Equation:
Rearranging the equation gives:
\(
T^2 = \frac{4\pi^2}{g} l
\)
This shows that T² is directly proportional to l.
3. Identifying the Form of the Equation:
The equation can be expressed in the form of y=mx+c, where:
- \( y = T^2 \)
- \( x = l \)
- \( m = \frac{4\pi^2}{g} \) (the slope)
- \( c = 0 \) (the y-intercept)
4. Conclusion about the Graph:
Since the relationship between T² and l is linear (i.e., it can be expressed as T²=ml+0), the graph of T² versus l will be a straight line.
Final Answer:
The graph between l and T² is a straight line.
---
The period T of a simple pendulum is given by the formula:
\(
T = 2\pi \sqrt{\frac{l}{g}}
\)
Squaring both sides, we get:
\(
T^2 = 4\pi^2 \frac{l}{g}
\)
Rearranging the equation gives:
\(
T^2 = \frac{4\pi^2}{g} l
\)
This shows that T² is directly proportional to l.
The equation can be expressed in the form of y=mx+c, where:
- \( y = T^2 \)
- \( x = l \)
- \( m = \frac{4\pi^2}{g} \) (the slope)
- \( c = 0 \) (the y-intercept)
Since the relationship between T² and l is linear (i.e., it can be expressed as T²=ml+0), the graph of T² versus l will be a straight line.
The graph between l and T² is a straight line.
Topper's Solved these Questions
- GENERAL PHYSICSBOOK - DC PANDEY ENGLISHCHAPTER - GENERAL PHYSICSEXERCISE - MCQ_TYPE
17 Videos
- GENERAL PHYSICSBOOK - DC PANDEY ENGLISHCHAPTER - GENERAL PHYSICSEXERCISE - MATCH THE COLUMN
6 Videos
- FLUID MECHANICSBOOK - DC PANDEY ENGLISHCHAPTER - FLUID MECHANICSEXERCISE - Medical entranes gallery
49 Videos
- GRAVITATIONBOOK - DC PANDEY ENGLISHCHAPTER - GRAVITATIONEXERCISE - (C) Chapter Exercises
45 Videos
Similar Questions
To study the dissipations of the energy of a simple pendulum, student plots a graph between square root of time and amplitude . The graph would be a
View SolutionIn an experiment , to find the loss of energy with respect to time in case of swinging simple pendulum , the graph between (amplitude)2 and time is
View Solution
Knowledge Check
While measuring the acceleration due to gravity by a simple pendulum, a student makes a positive error of 1% in the length of the pendulum and a negative error of 3% in the value and a of time period. His percentage error in the measurement of g by the relation g=4π2(l/T2) will be
AA) 0.02BB) 0.04CC) 0.07DD) 0.1
To find the value of g using simple pendulum , T=2.00sandl=1.00m were measured . Estimate maximum permissible error in g . Also find the value of g.
View SolutionIn determining the angle of minimum deviation for a given prism, a graph is plotted between the angle of incidence (j) and the angle of deviation (δ). Which of the following graphs will correctly
View SolutionIn an experiment to determine the value of acceleration due to gravity g using a simple pendulum , the measured value of lenth of the pendulum is 31.4 cm known to 1 mm accuracy and the time period for 100 oscillations of pendulum is 112.0 s known to 0.01 s accuracy . find the accuracy in determining the value of g.
View SolutionFor different values of L, we get different values of T2. The graph between L versus T2 ia as shown in figure. Find the value of 'g' from the given graph.(Take (π)2=10).
 .
.
View SolutionThe graph between the length and square of the period of a simple pendulum is a
View SolutionWhile measuring the acceleration due to gravity by a simple pendulum , a student makes a positive error of 1% in the length of the pendulum and a negative error of 3% in the value of time period . His percentage error in the measurement of g by the relation g=4π2(l/T2) will be
View SolutionHow does the time period (T) of a simple pendulum depend on its length (l)? Draw a graph showing the variation of T2 with l. How will you use this graph to determine the value of g (acceleration due to gravity) ?
View Solution
