Terminal velocity of a spherical object varies with a radius of object -
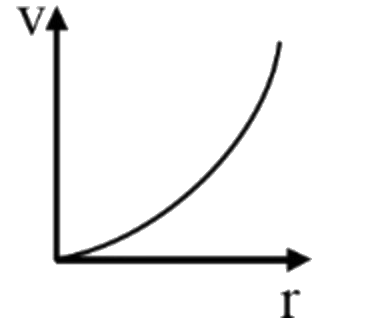
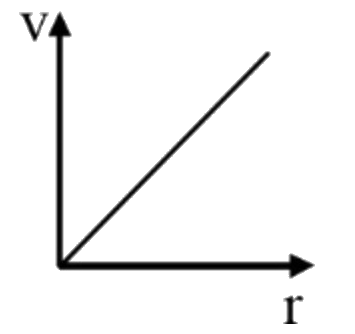
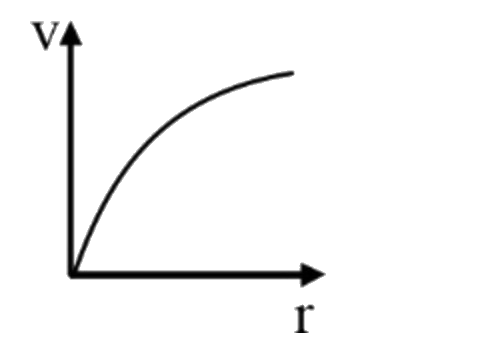
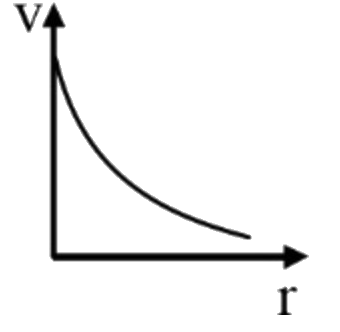
The correct Answer is:A
To determine how the terminal velocity V of a spherical object varies with its radius r, we can start by using the formula for terminal velocity in a viscous fluid:
V=29gr2(σ−ρ)η
Where:
- V is the terminal velocity,
- g is the acceleration due to gravity,
- r is the radius of the object,
- σ is the density of the object,
- ρ is the density of the fluid,
- η is the coefficient of viscosity.
Step 1: Identify the constants
In the context of the problem, we can identify that g, σ, ρ, and η are constants for a given scenario. Therefore, we can simplify our equation to focus on the relationship between V and r.
Step 2: Simplify the equation
Since g, σ, ρ, and η are constants, we can rewrite the equation as:
V=Kr2
Where K=29g(σ−ρ)η.
Step 3: Analyze the relationship
The equation V=Kr2 indicates that terminal velocity V is directly proportional to the square of the radius r. This is a quadratic relationship.
Step 4: Graph the relationship
To graph this relationship, we note that it resembles the form y=ax2, where y corresponds to V and x corresponds to r. The graph of a quadratic function is a parabola that opens upwards.
Step 5: Identify the correct graph
From the options provided, we need to choose the graph that represents a quadratic relationship between V and r. The correct graph will show a parabolic curve indicating that as the radius increases, the terminal velocity increases with the square of the radius.
Conclusion
Thus, the correct graph that represents the relationship between terminal velocity V and radius r is the one that shows a parabolic curve.
---
- V is the terminal velocity,
- g is the acceleration due to gravity,
- r is the radius of the object,
- σ is the density of the object,
- ρ is the density of the fluid,
- η is the coefficient of viscosity.
In the context of the problem, we can identify that g, σ, ρ, and η are constants for a given scenario. Therefore, we can simplify our equation to focus on the relationship between V and r.
Since g, σ, ρ, and η are constants, we can rewrite the equation as:
The equation V=Kr2 indicates that terminal velocity V is directly proportional to the square of the radius r. This is a quadratic relationship.
To graph this relationship, we note that it resembles the form y=ax2, where y corresponds to V and x corresponds to r. The graph of a quadratic function is a parabola that opens upwards.
From the options provided, we need to choose the graph that represents a quadratic relationship between V and r. The correct graph will show a parabolic curve indicating that as the radius increases, the terminal velocity increases with the square of the radius.
Thus, the correct graph that represents the relationship between terminal velocity V and radius r is the one that shows a parabolic curve.
Similar Questions
The terminal velocity v of a spherical ball of lead of radius R falling through a viscous liquid varies with R such that
View SolutionA small spherical ball falling through a viscous medium of negligible density has terminal velocity v. Another ball of the same mass but of radius twice that of the earlier falling through the same viscous medium will have terminal velocity
View Solution
Knowledge Check
The terminal velocity of small sized spherical body of radius r falling veertically in a viscous liquid is given by a following proportionality
A1r2B1rCrDr2
The terminal velocity of a sphere of radius R, falling in a viscous fluid, is proportional to
View SolutionThe bulk modulus of a spericla object is B. If it is subjected to uniform pressure p, the fractional decrease in radius is
View SolutionThe bulk modulus of a spherical object is B if it is subjected to uniform pressure p, the fractional decrease in radius is:
View Solution(a) A point object, O is on the principle axis of a spherical surface having a radius of curvature, R. Draw a diagram to obtain the relation between the object and image distances, the refractive indicess of the media and the radius of curvature of the spherical surface.
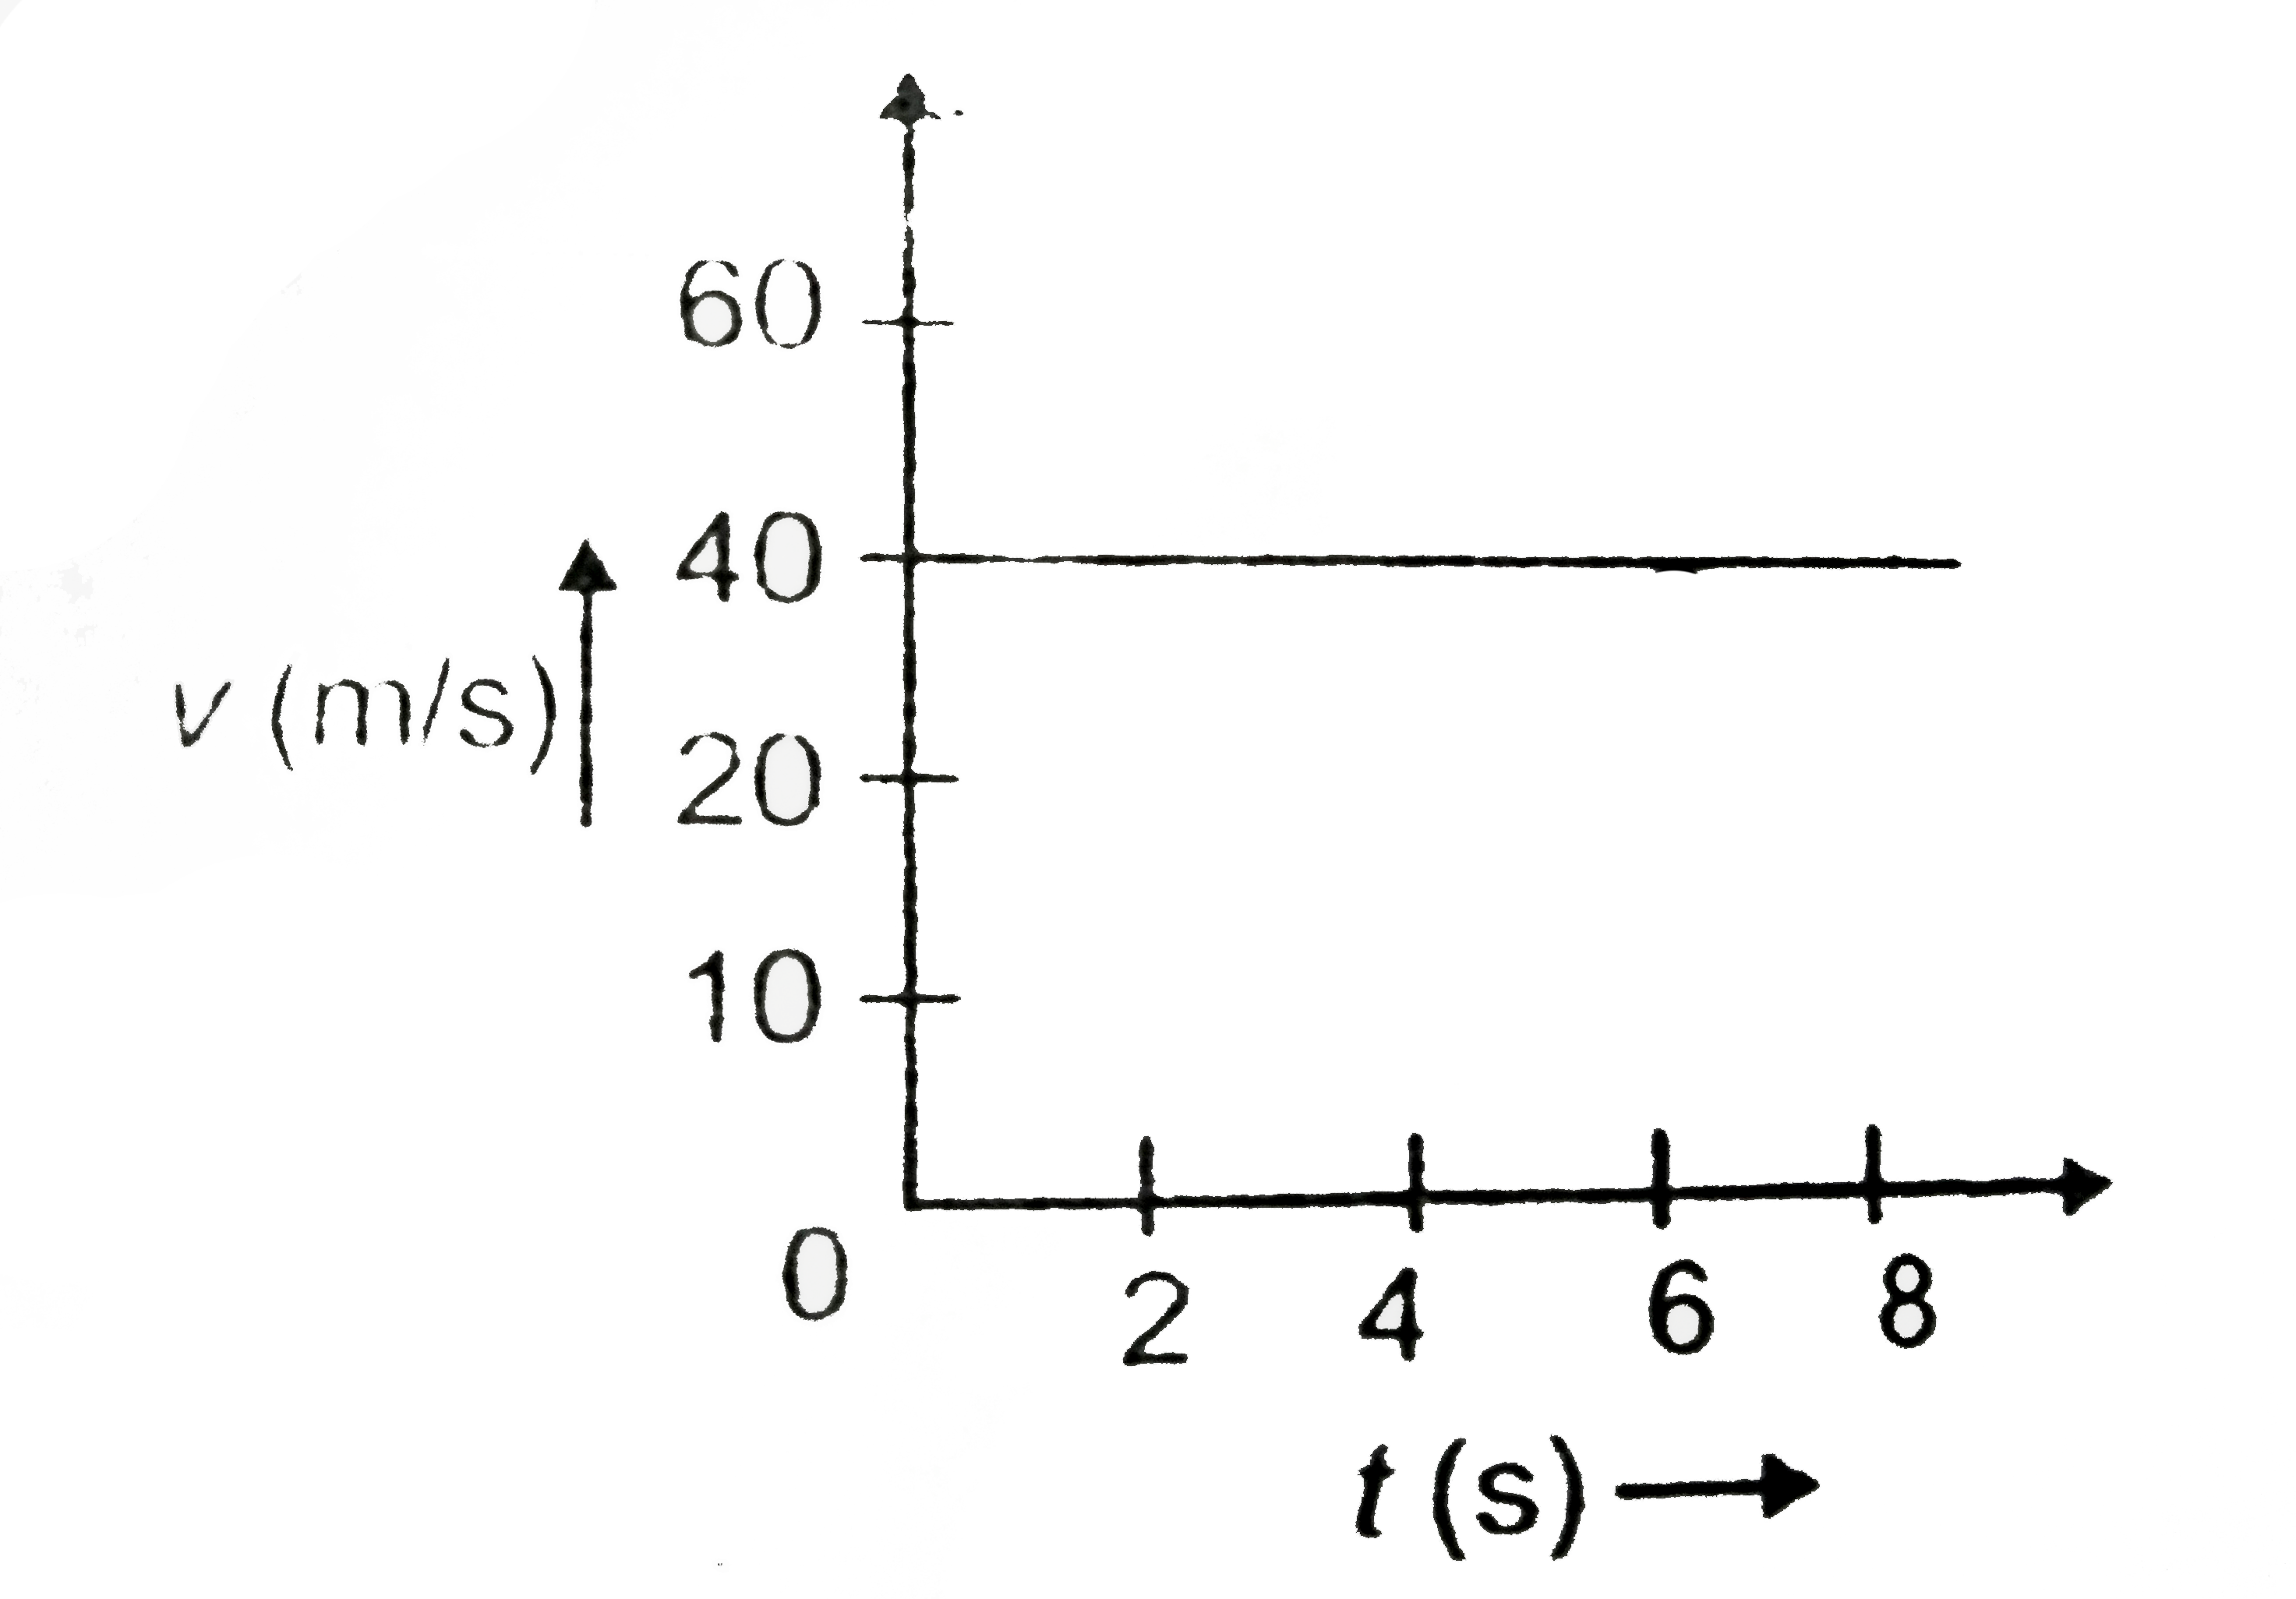
View SolutionThe velocity-time graph of an object is shown below. The acceleration of the object is
View Solutionwhen a constant power is delivered to an object, then the graph between velocity and position of the object is( motion of object is along x-axis)
View SolutionWhen a constant power is delivered to an object, then the graph between velocity and position of the object is (motion of object is along x-axis)
View Solution