Magnitude of slope of the shown graph.
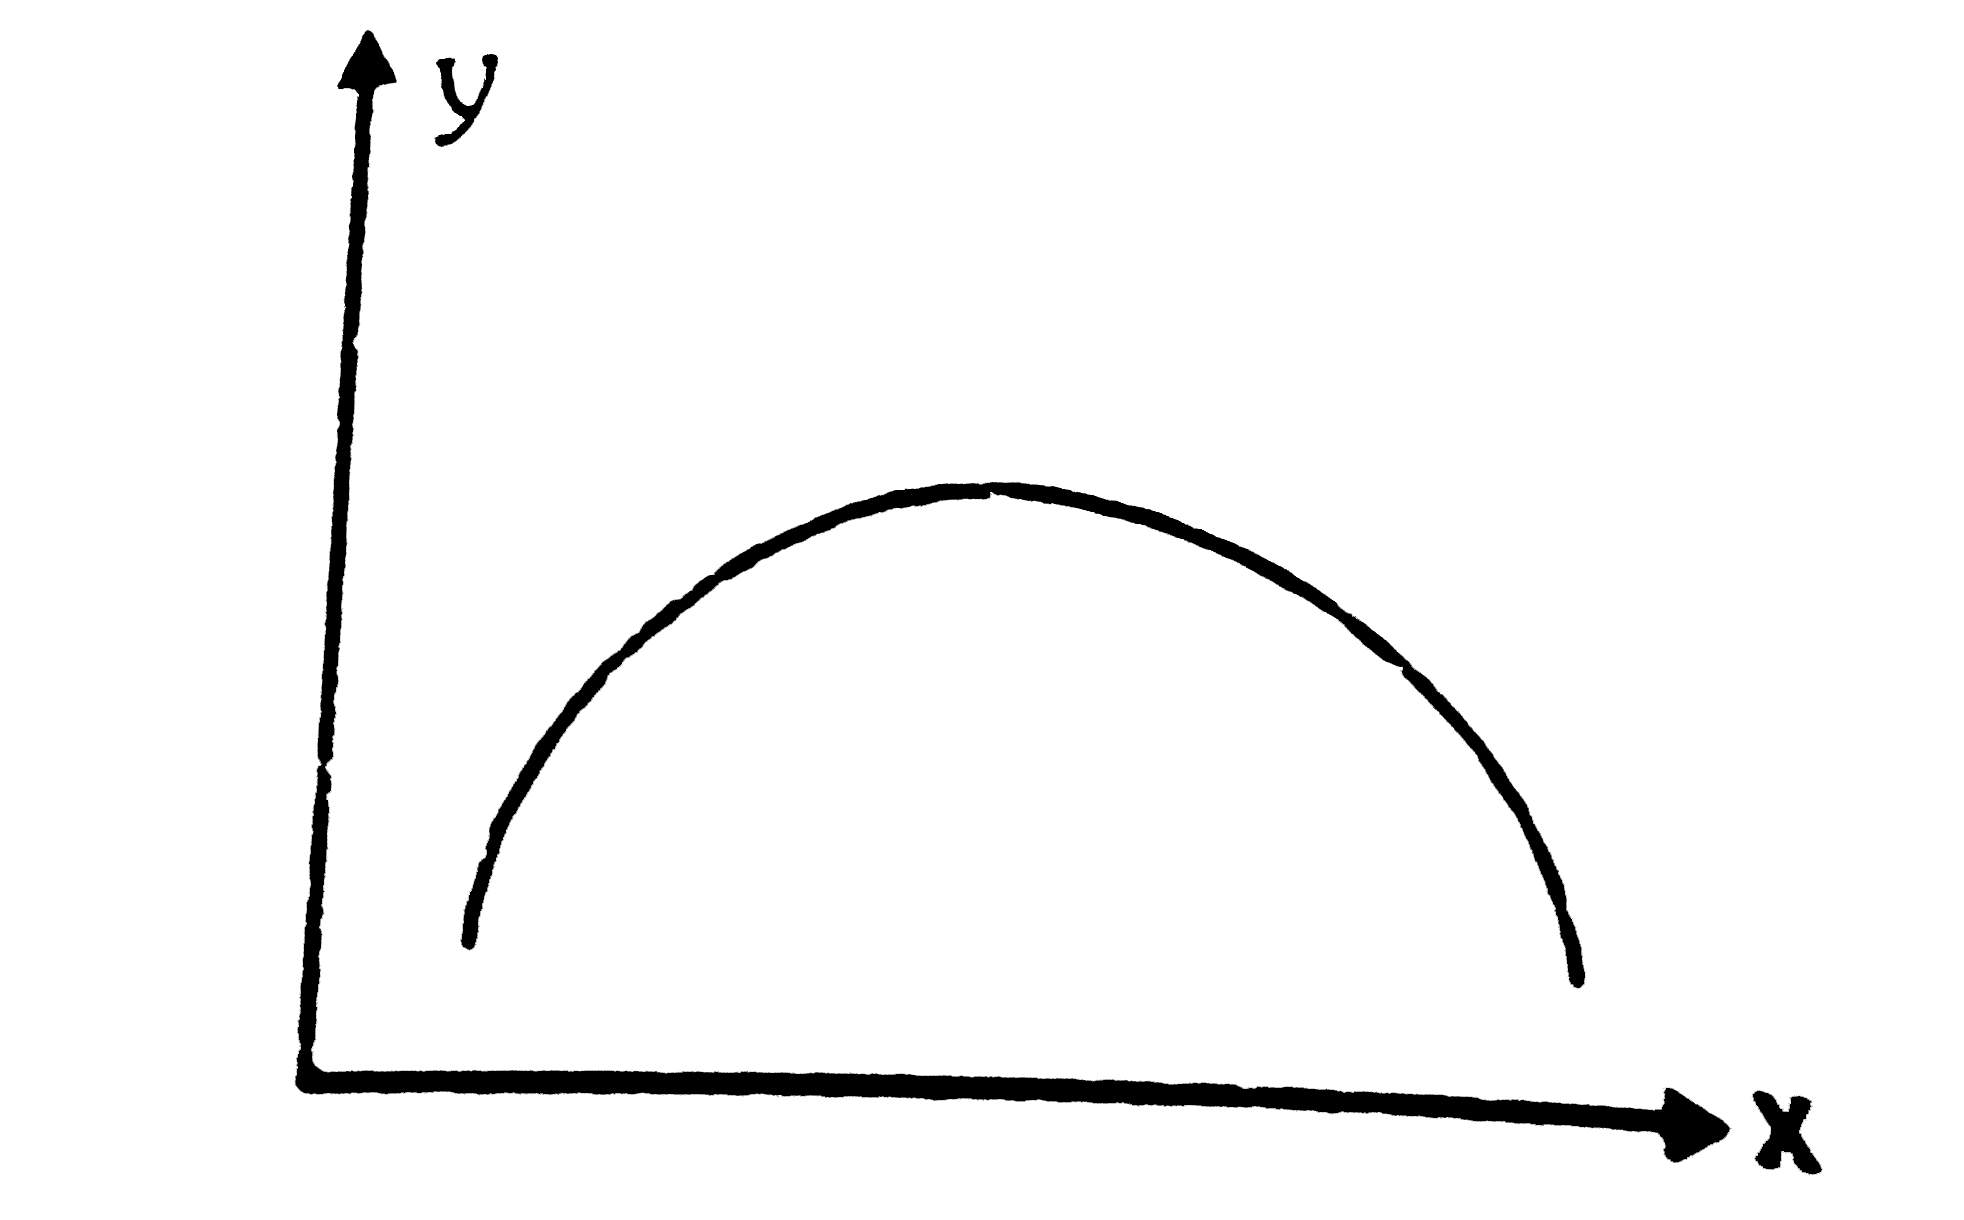
a2y+bx2=0
a2y=bx2
y=ba2
ay2=b2x
The correct Answer is:A
x=at,y=−bt2⇒a2y+bx2=0
Topper's Solved these Questions
- BASIC MATHSBOOK - ALLENCHAPTER - BASIC MATHSEXERCISE - Comprehension 4
3 Videos
- BASIC MATHSBOOK - ALLENCHAPTER - BASIC MATHSEXERCISE - DATA SUFFICIENCY QUESTIONS
3 Videos
- BASIC MATHSBOOK - ALLENCHAPTER - BASIC MATHSEXERCISE - Comprehension 2
3 Videos
- AIIMS 2019BOOK - ALLENCHAPTER - AIIMS 2019EXERCISE - PHYSICS
40 Videos
- CIRCULAR MOTIONBOOK - ALLENCHAPTER - CIRCULAR MOTIONEXERCISE - EXERCISE (J-A)
6 Videos
Similar Questions
Knowledge Check
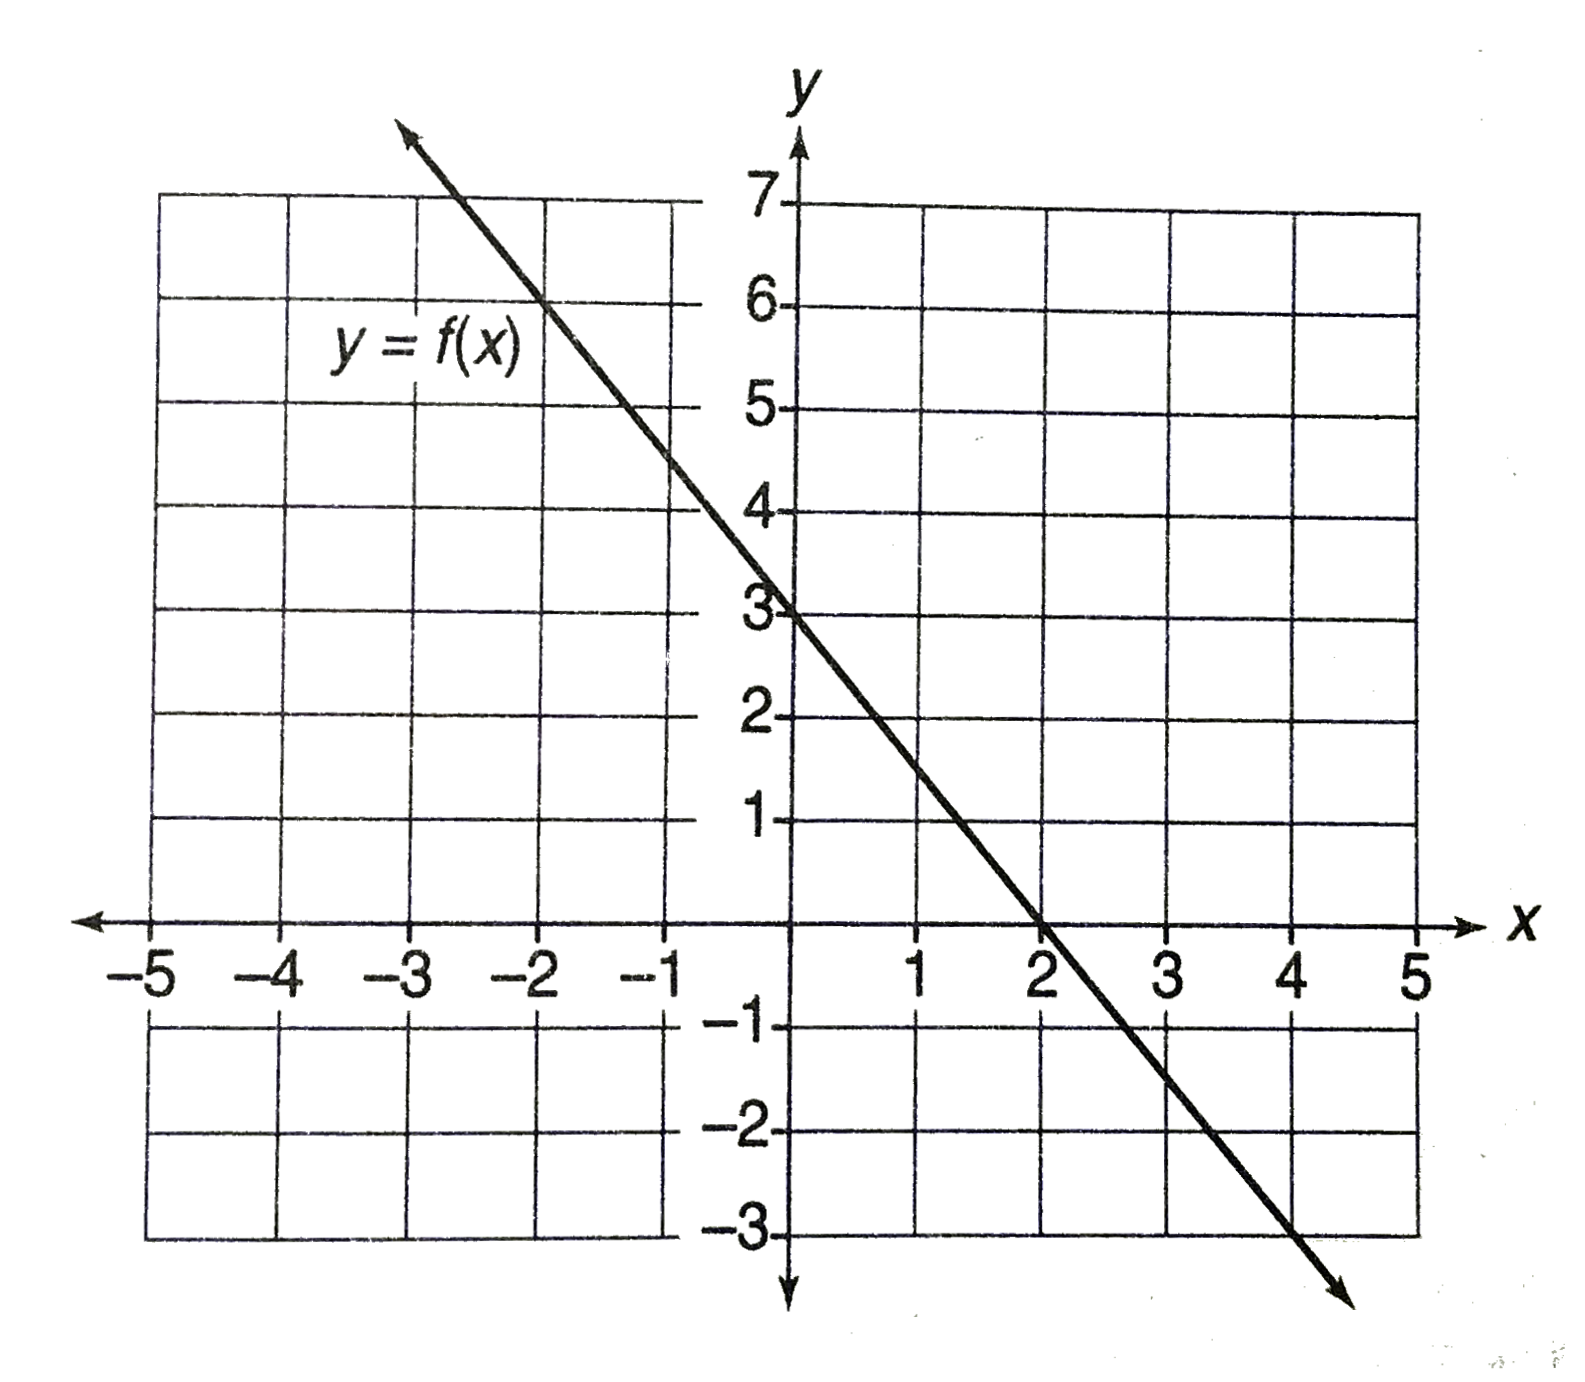
A linear function f is shown in the accompanying figure. If function g in the reflection of function f in the x-axis (not shown), what is the slope of the graph of function g?A−32B−23C23D32
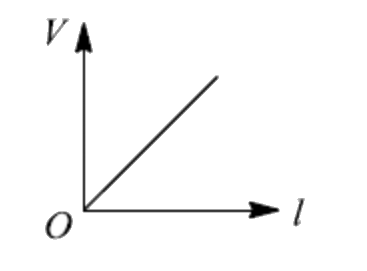
The V – I graph for a wire of copper of length L and cross -section area A is shown in the figure below . The slope of the graph will be
View SolutionWhen a plot between logk and 1/T is plotted we get the graph as shown.
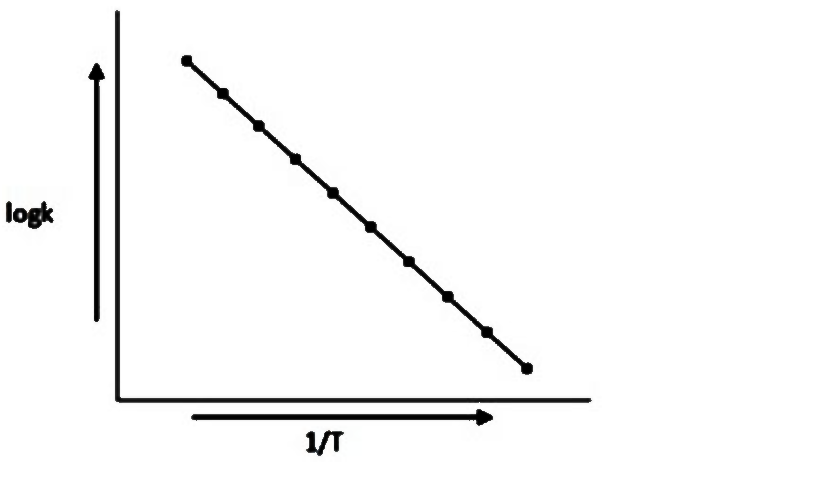
What is the value of slope in the graph?
View Solution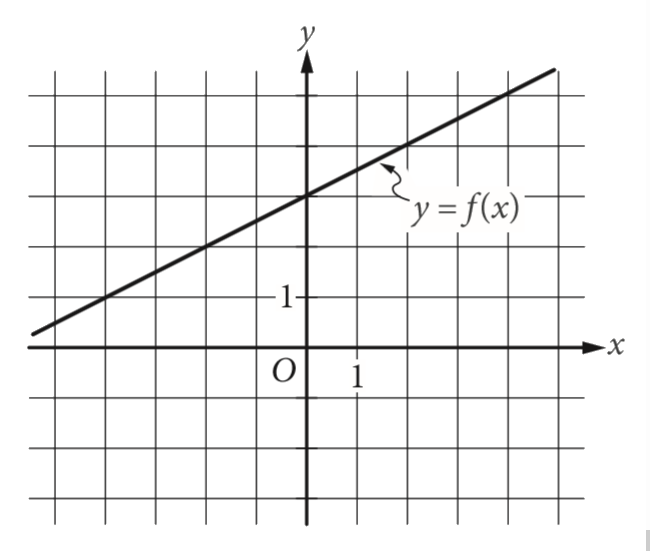
The graph of the linear functions f is shown in the xy-plane above. The slope of the graph of the linear function g is 4 times the slope of the graph of f. IF the graph of g passes through the point (0,-4) what is the value of g(9)?
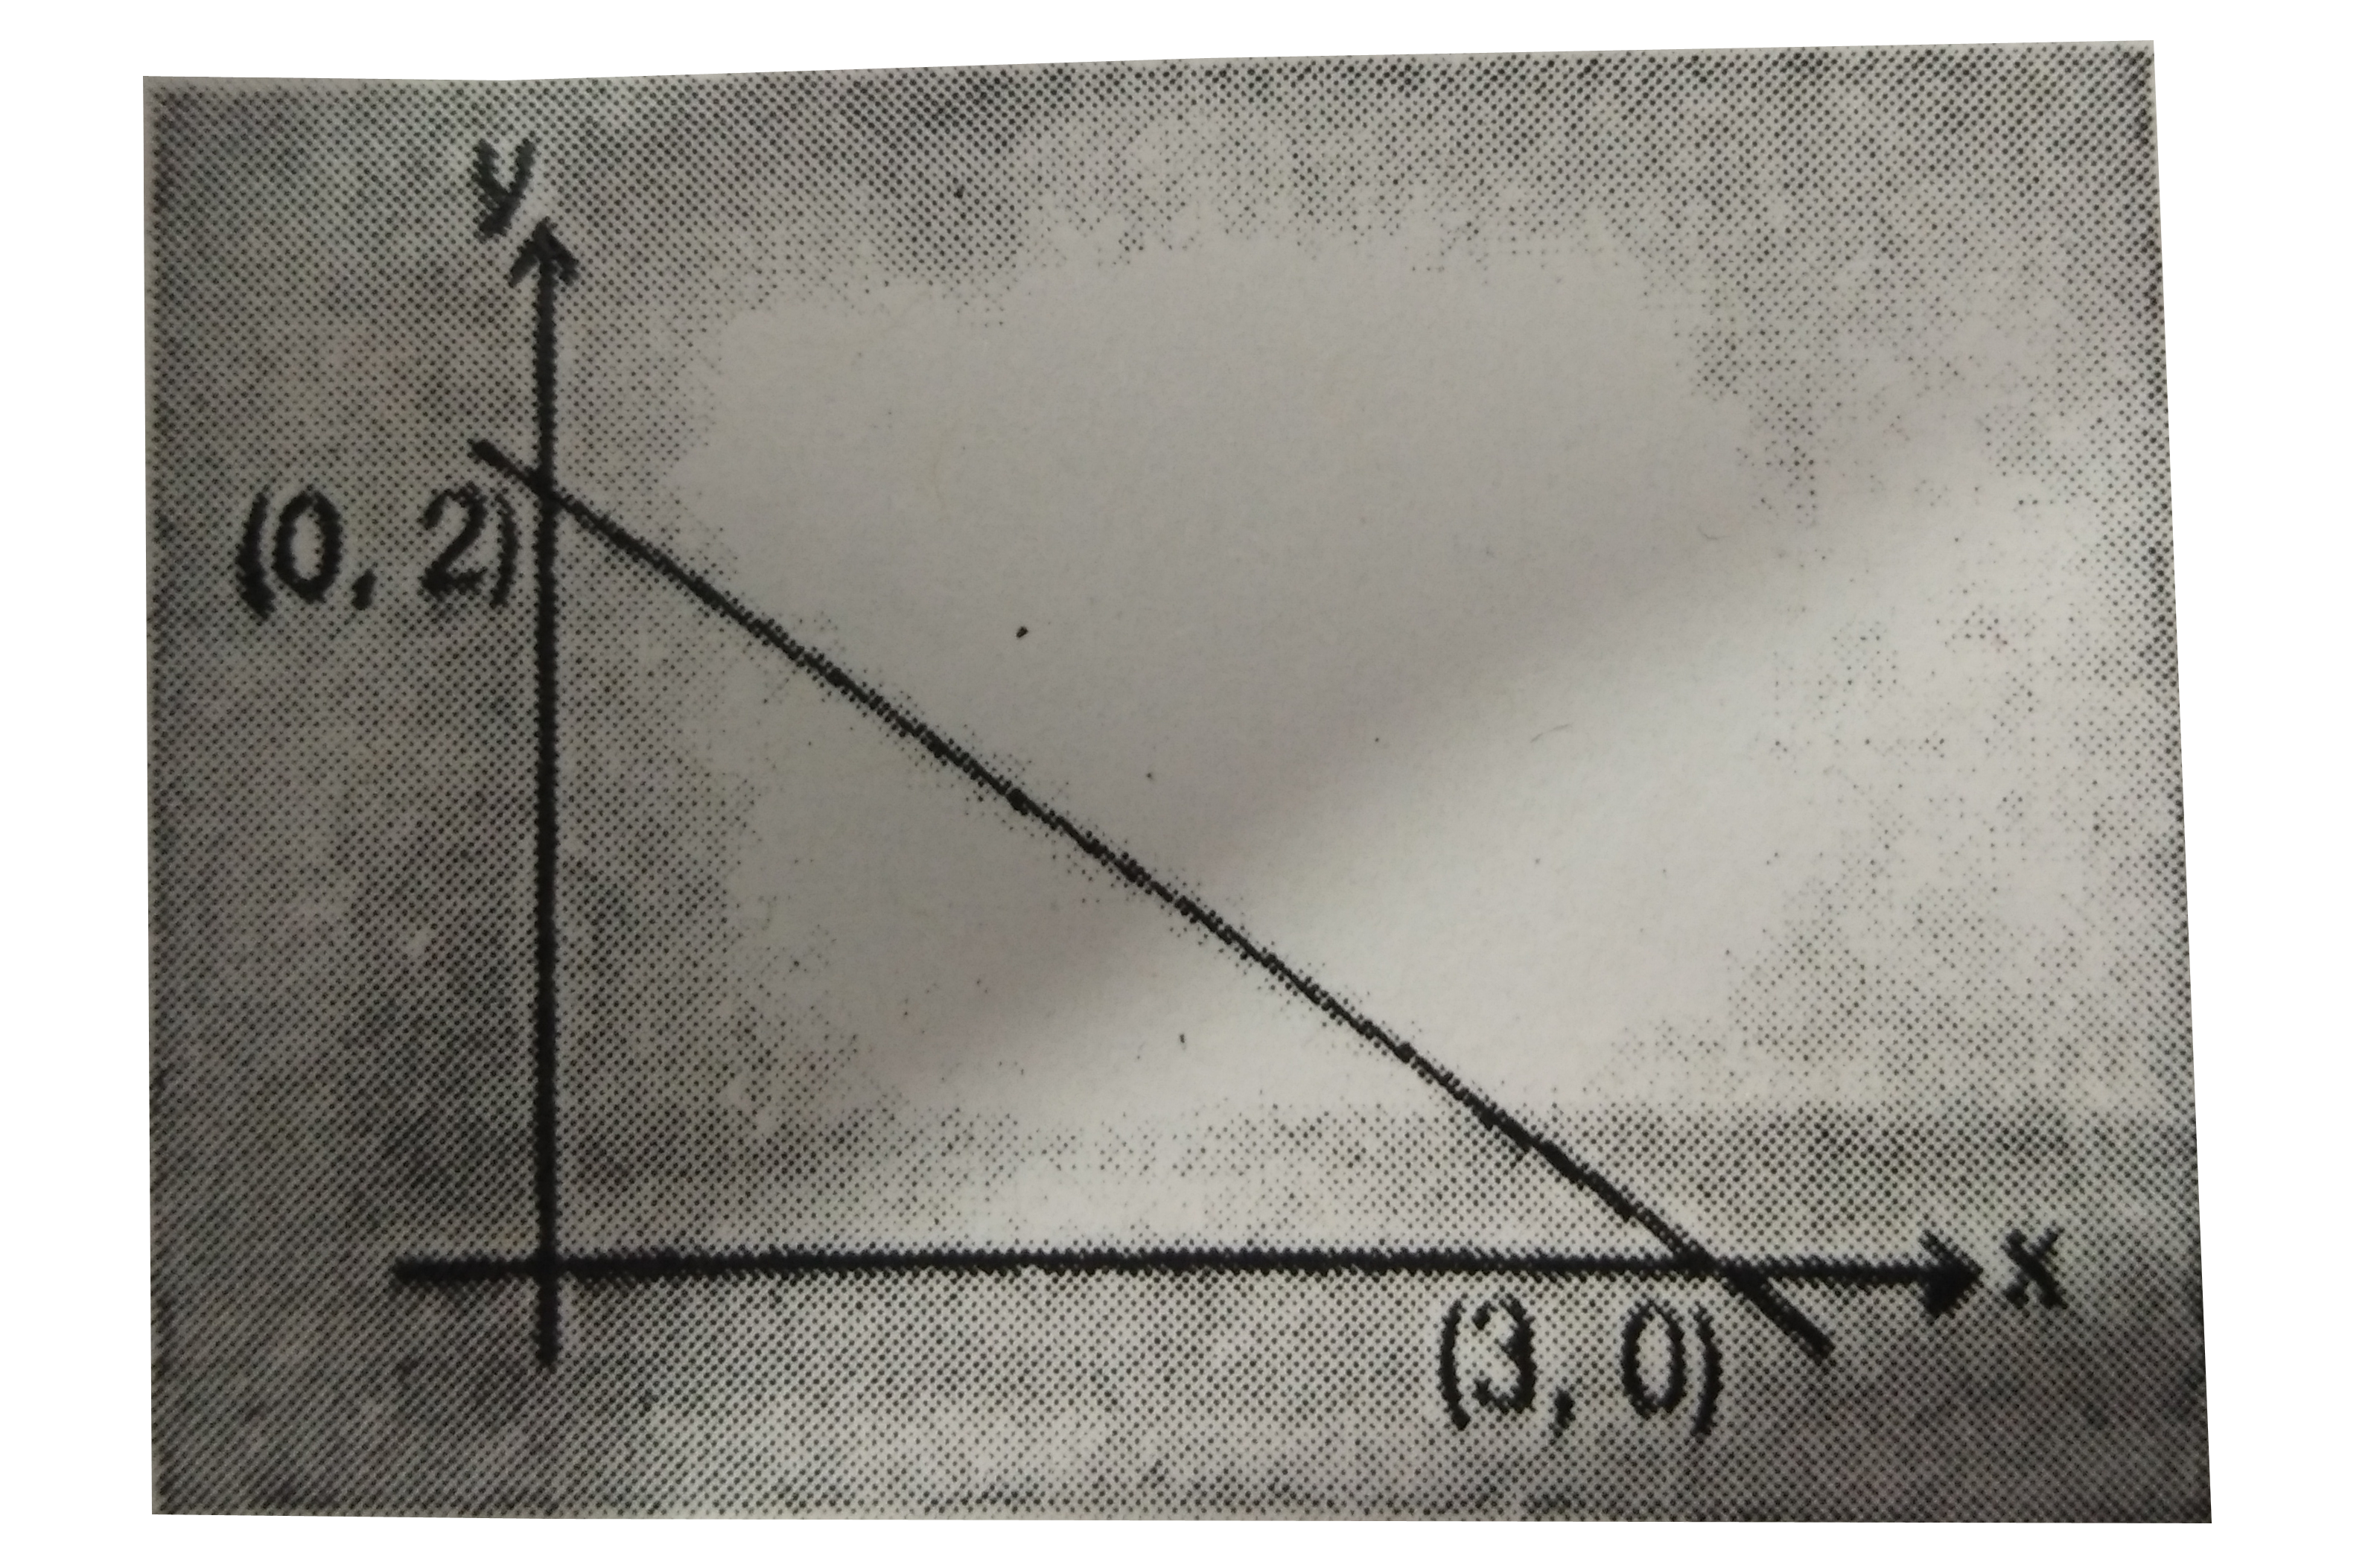
View SolutionCalculate slope of shown line
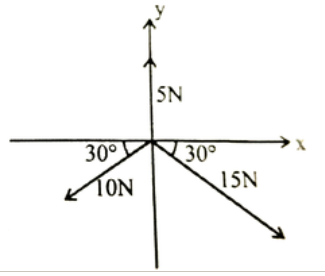
View SolutionFind the magnitude of the resultant of shown forces :-
View Solution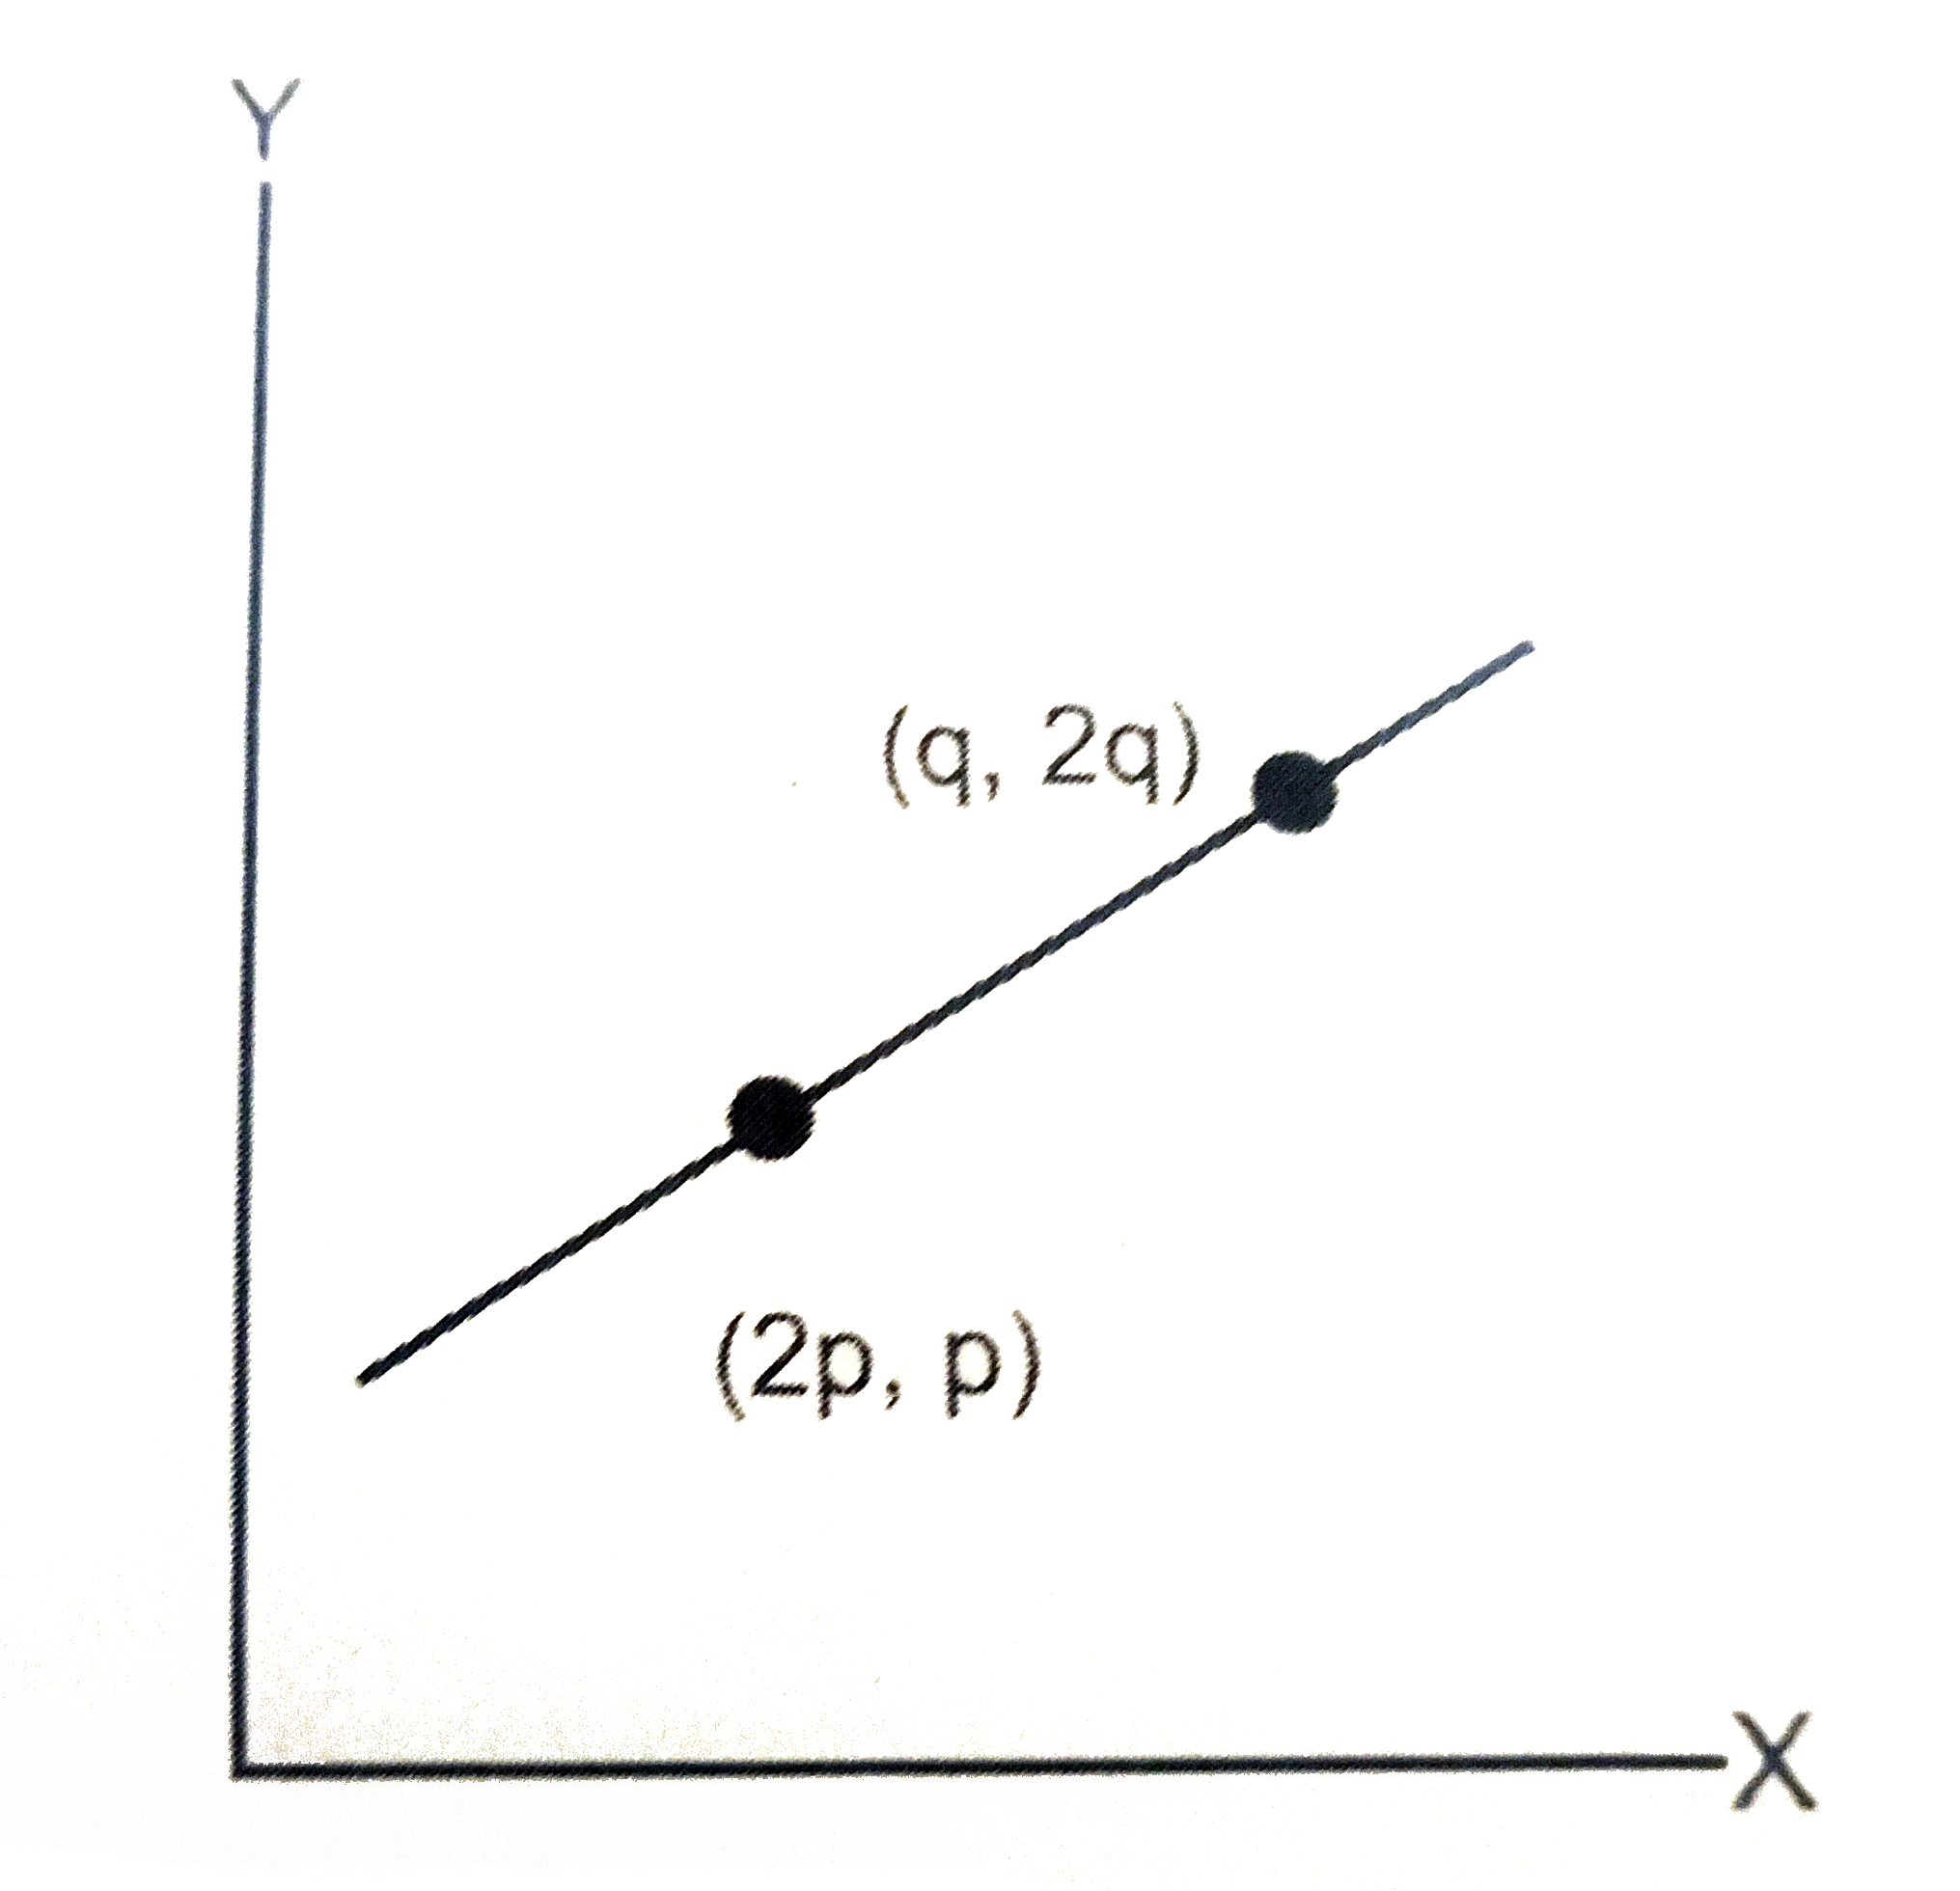
The graph above depicts a straight line. If q>2p , which of the following options could not be the slope of the line shown ?
View SolutionWhat does the slope of a work-time graph represent?
View Solution

