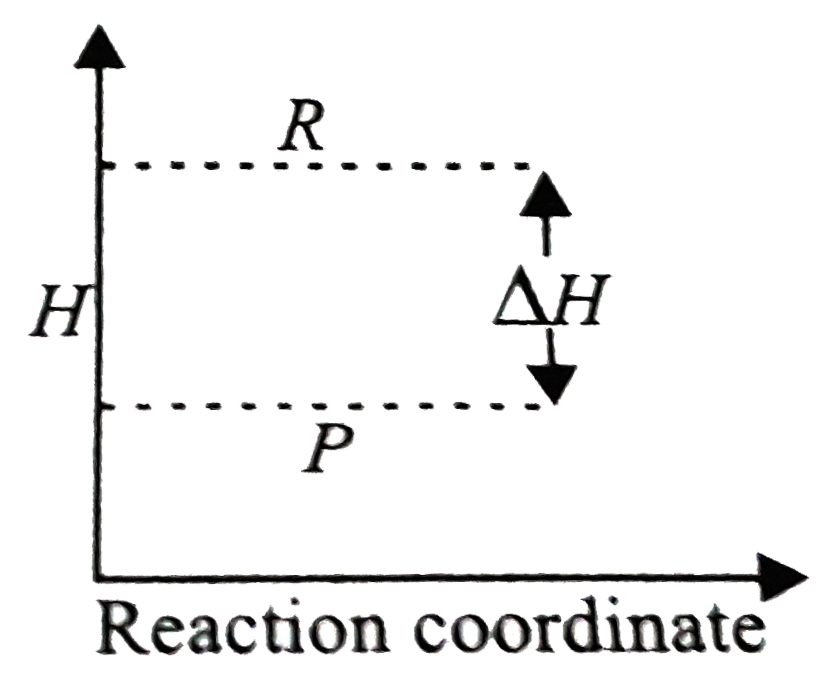
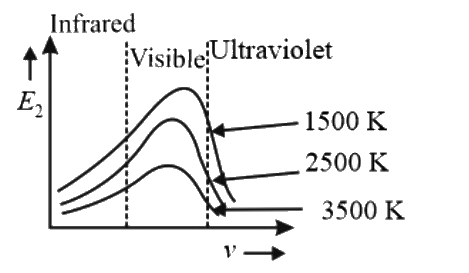
Following graphs shows the variation in the intensity of heat radiations by the the black body and frequency at a fixed temperature . Choose the correct option.
A
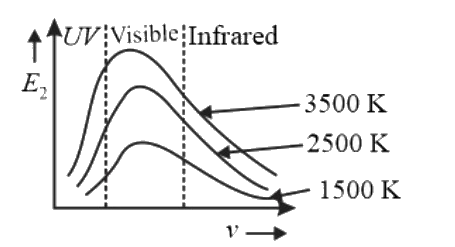
B
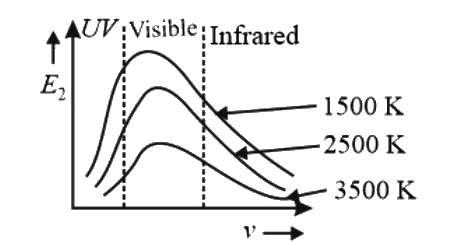
C
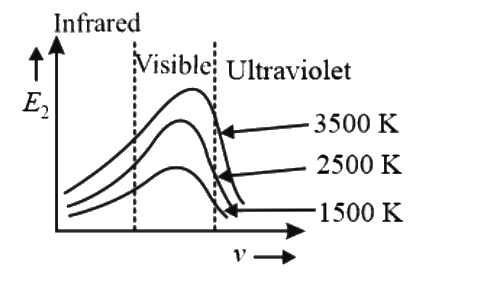
D
Video Solution
Text Solution
The correct Answer is:C
|
Answer
Step by step video & image solution for Following graphs shows the variation in the intensity of heat radiations by the the black body and frequency at a fixed temperature . Choose the correct option. by Physics experts to help you in doubts & scoring excellent marks in Class 12 exams.
Updated on:21/07/2023Similar Questions
Knowledge Check
Match the following

Choose the correct option:AA-3, B-2, C-1, D-4BA-4, B-1, C-3, D-2CA-2, B-4, C-1, D-3DA-4, B-1, C-2, D-3Match the following

Choose the correct option:AA-1, B-3, C-4, D-2BA-4, B-1, C-3, D-2CA-2, B-4, C-1, D-3DA-4, B-3, C-1, D-2
Match the following and choose the correct option.

View SolutionMatch the following and choose the correct option
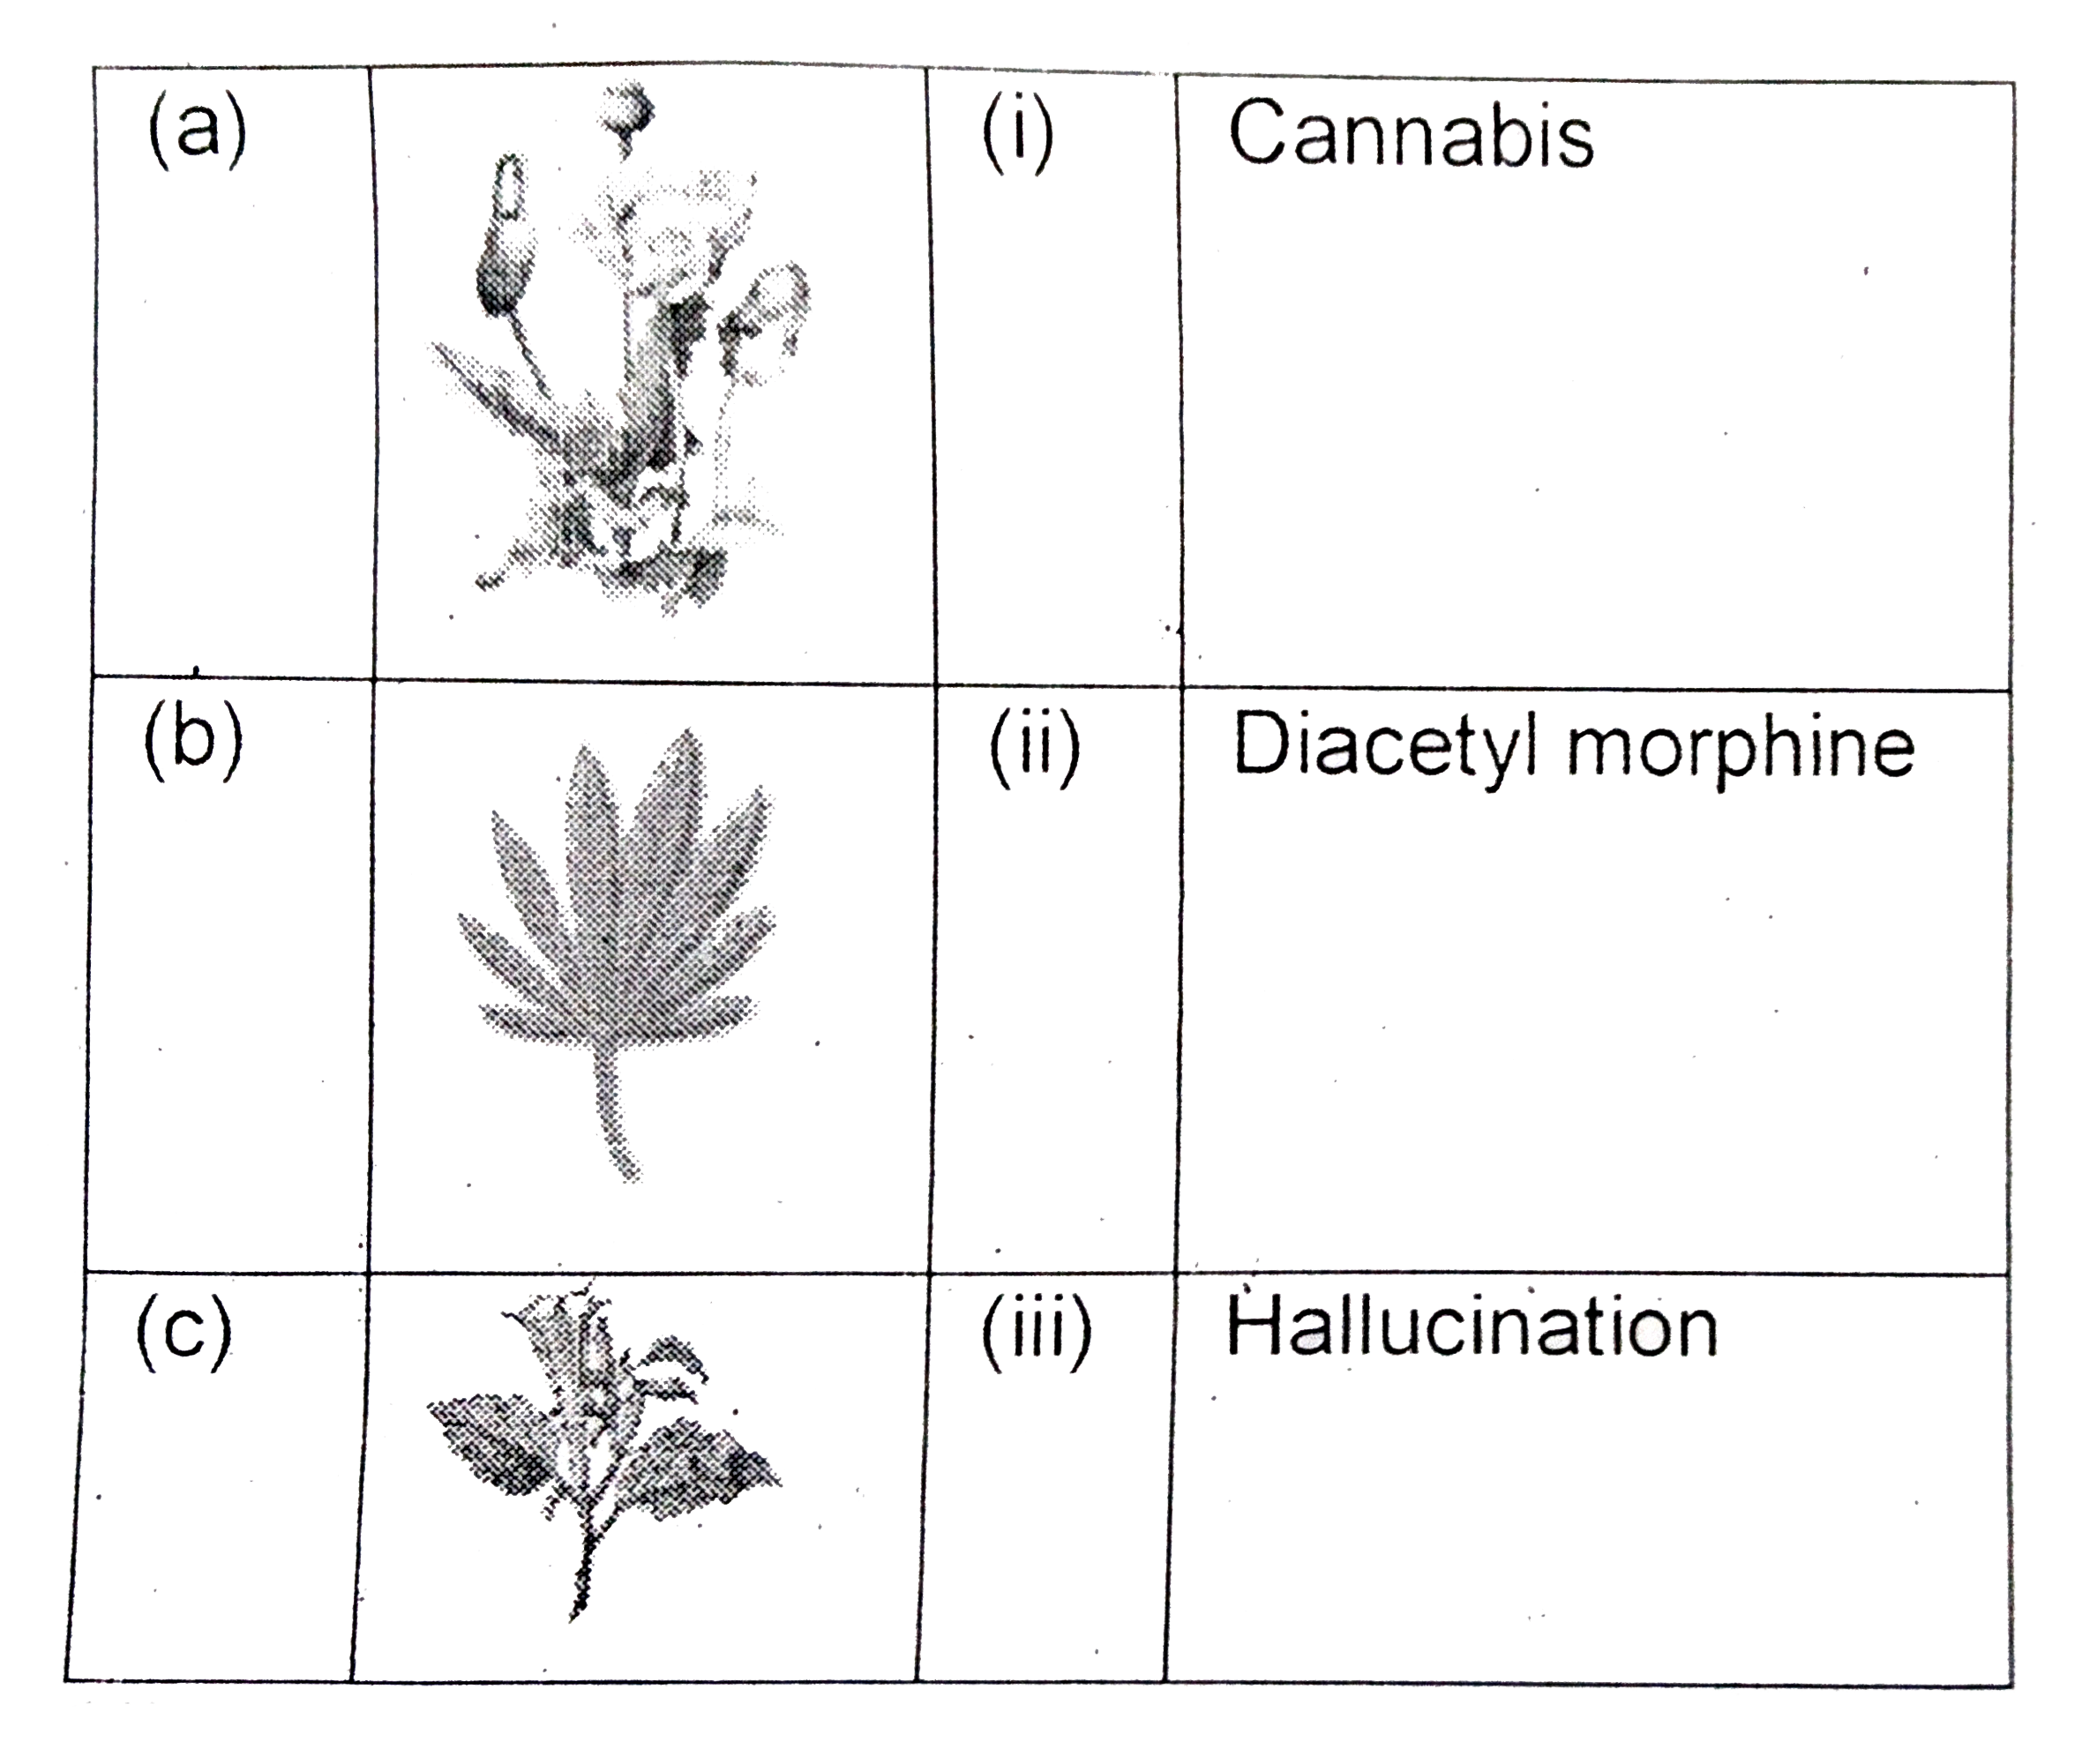
View SolutionMatch the following and choose the correct option .
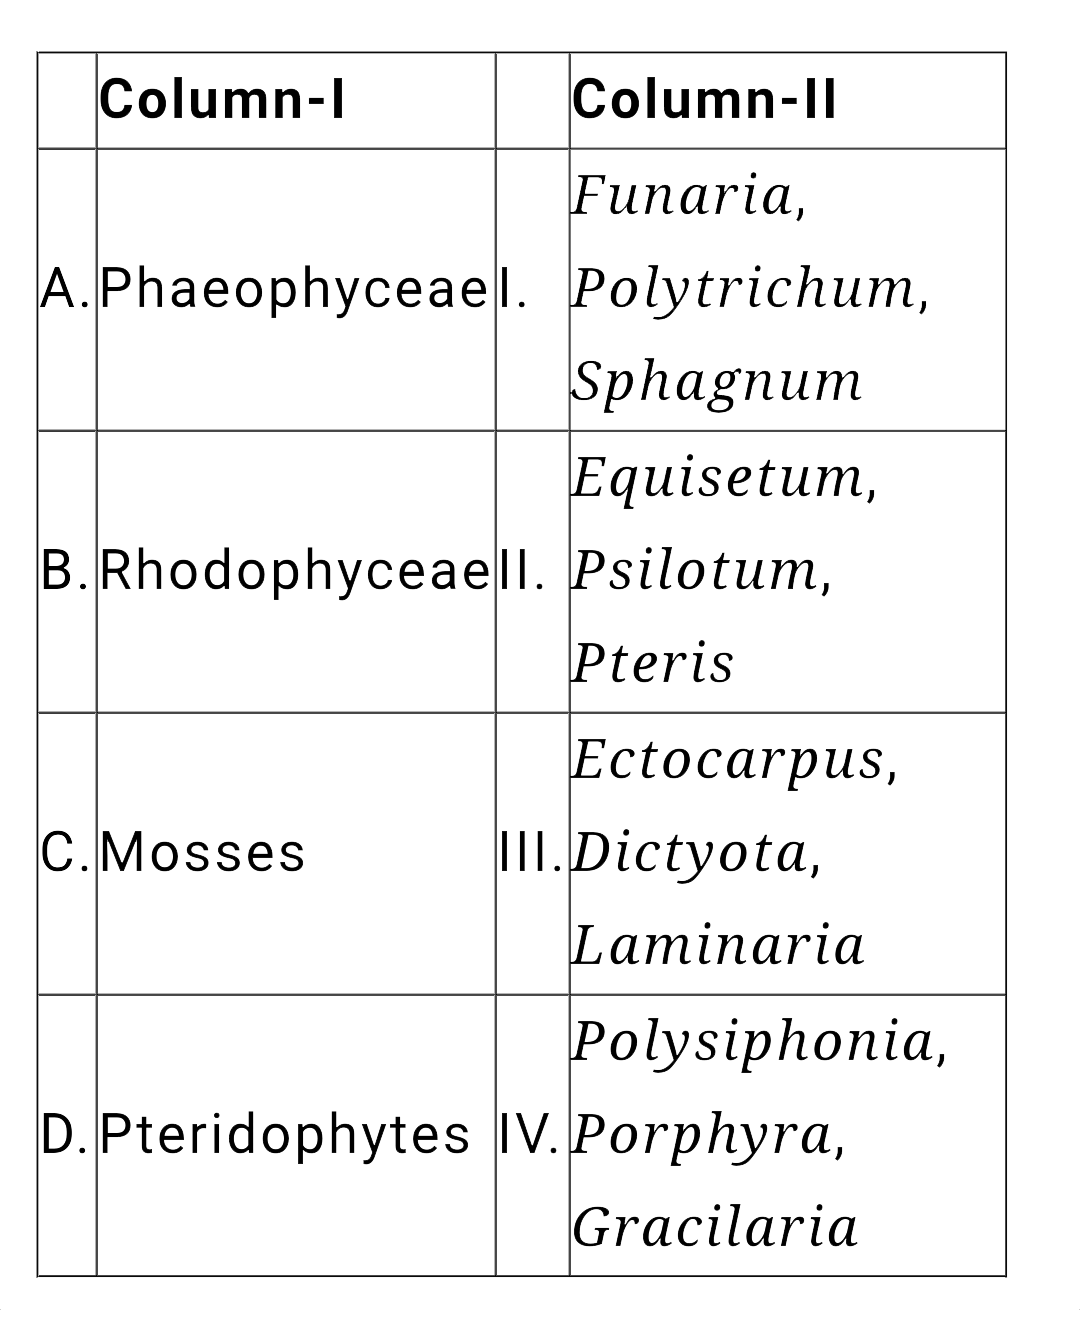
View SolutionMatch the following and choose the correct options
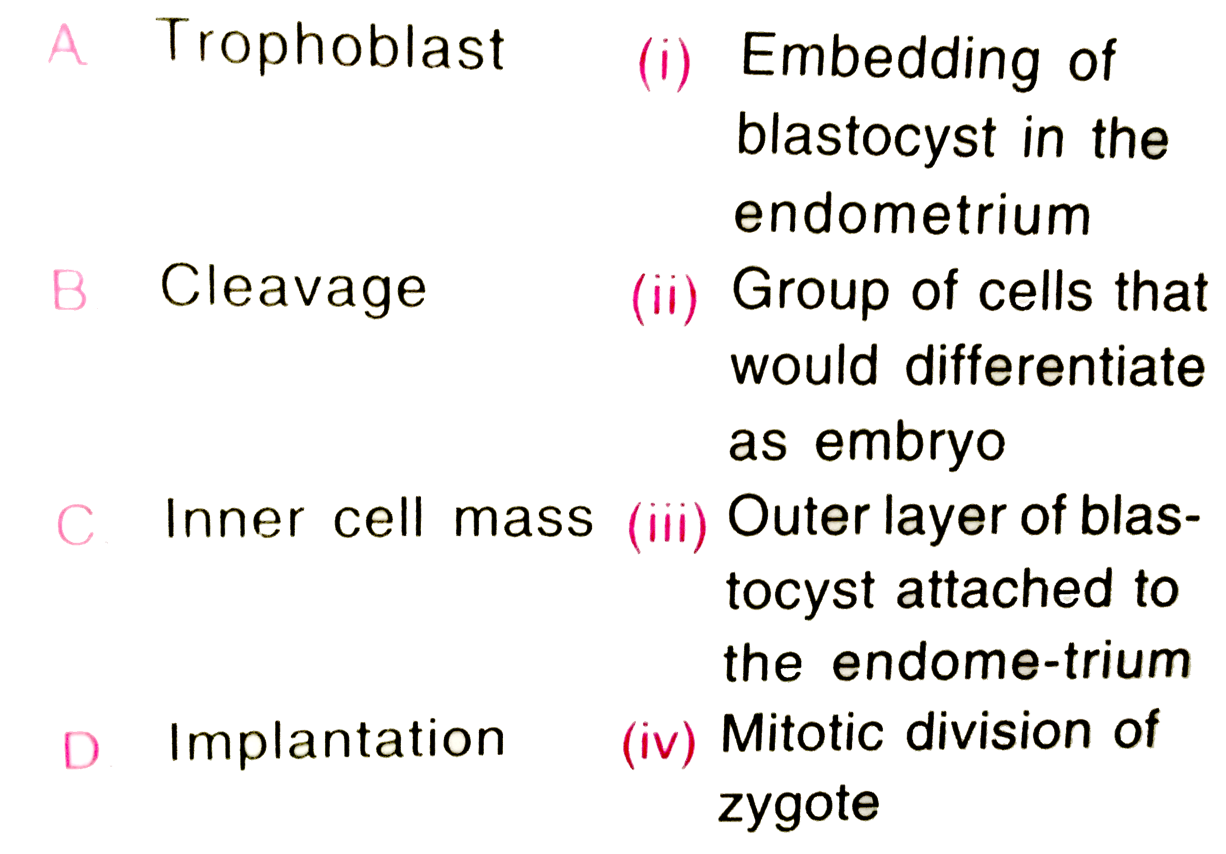
View SolutionConsidering the graph of 1s , choose the correct option:
View SolutionOn the P−T graph of an ideal gas, choose the correct option(s):
View Solution

