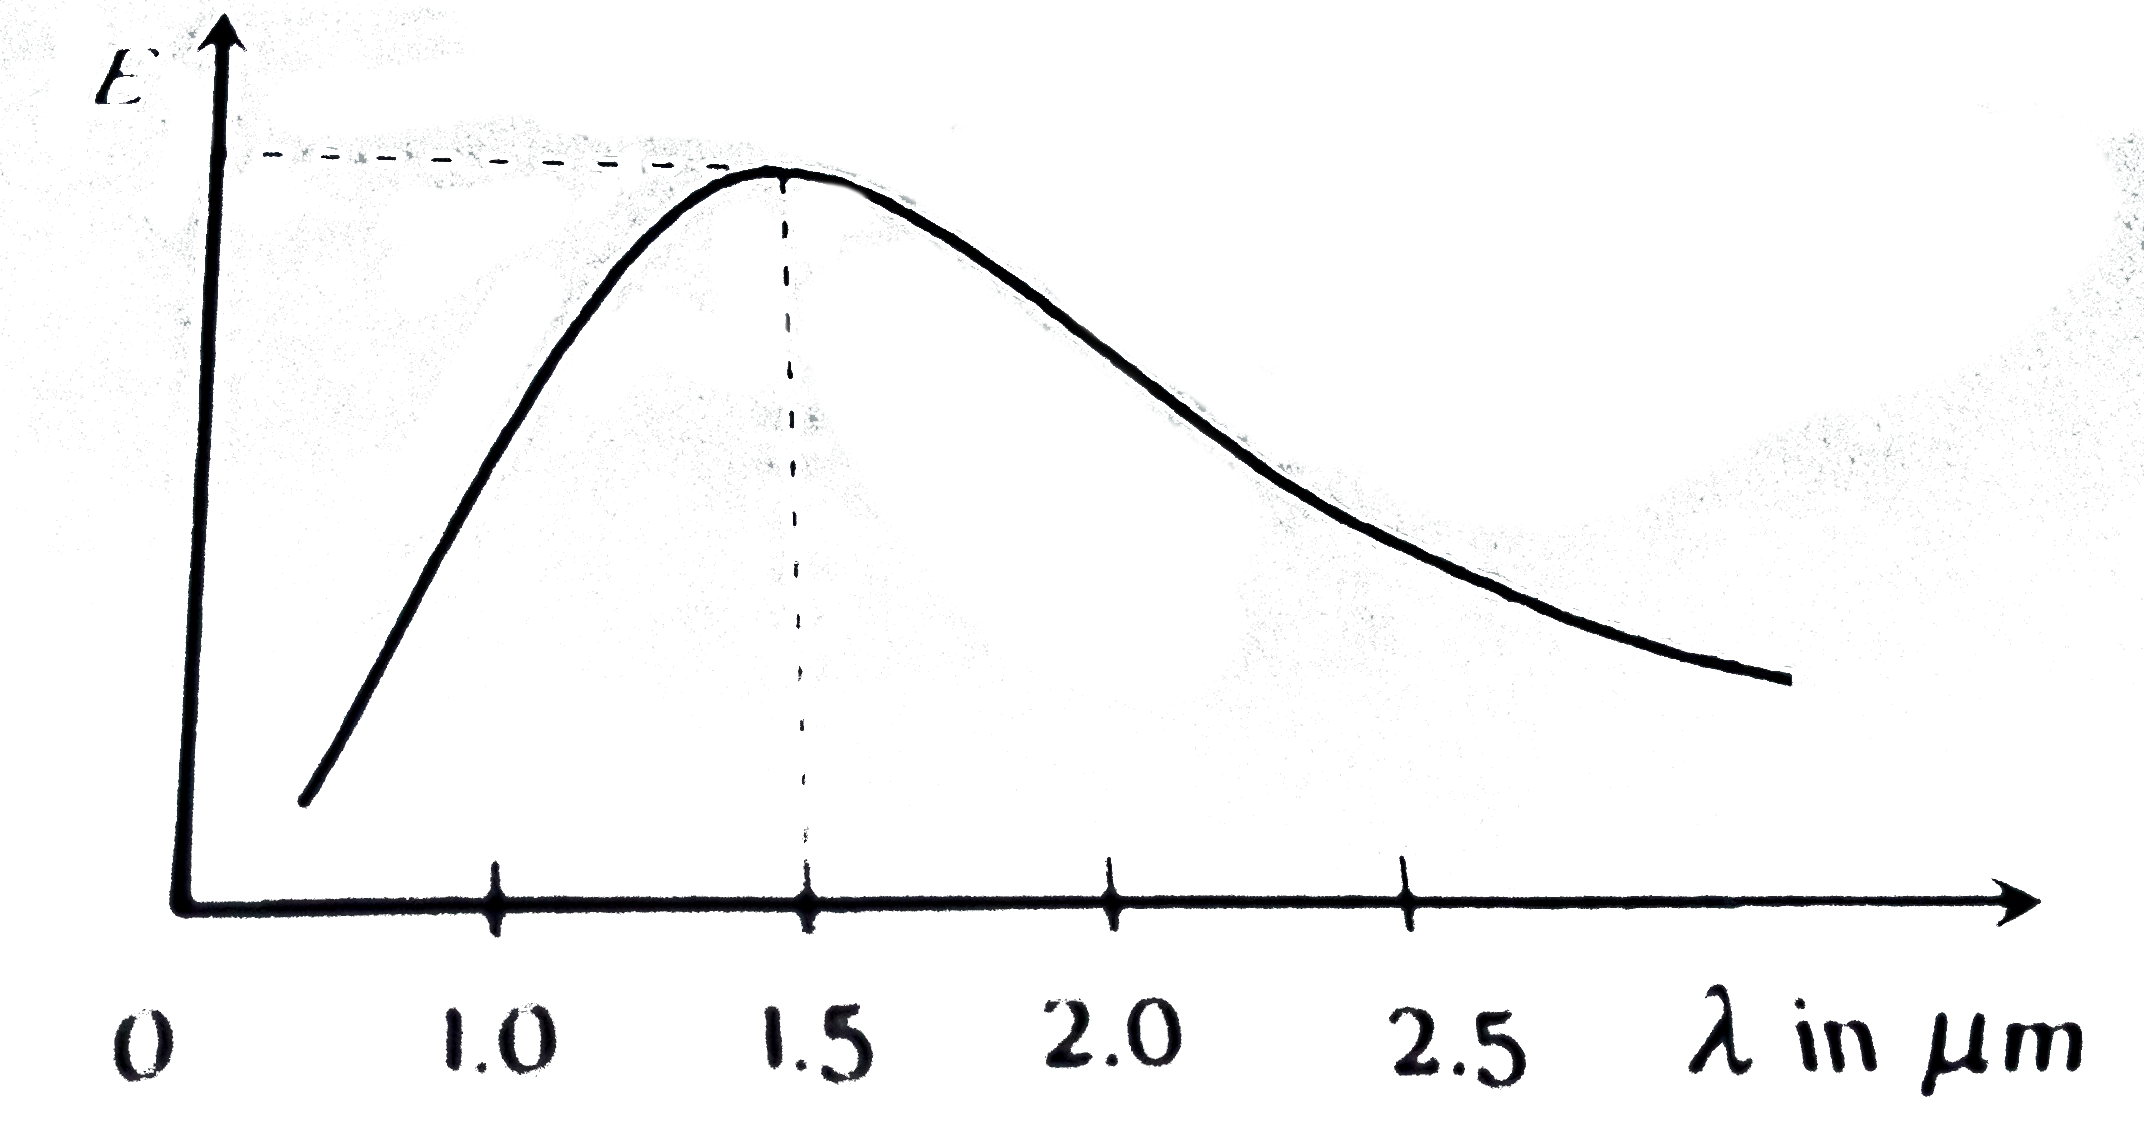
Following graph shows the correct variation in intensity of heat radiations by black body and frequency at a fixed temperature
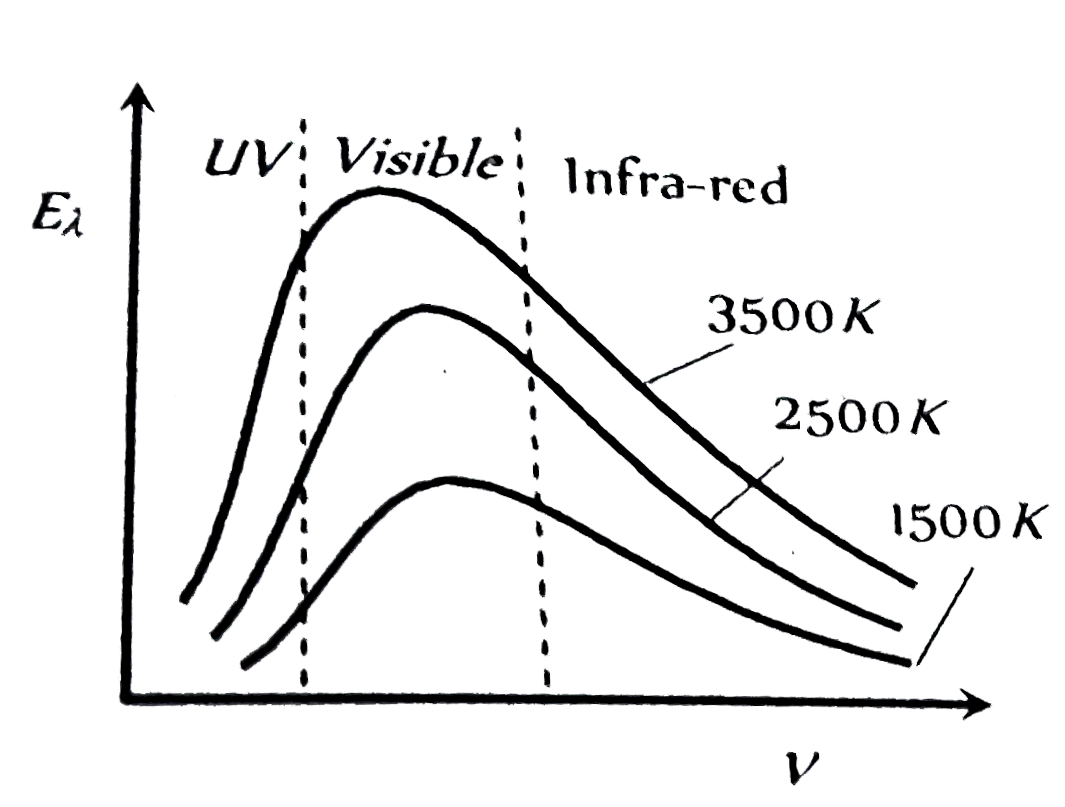
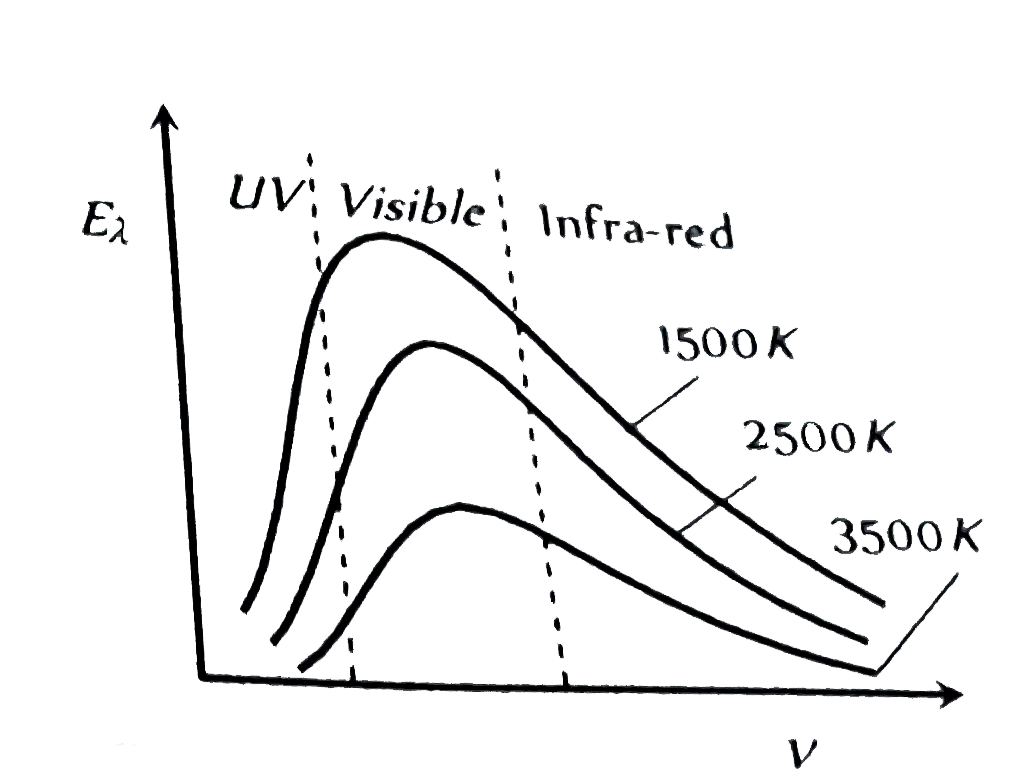
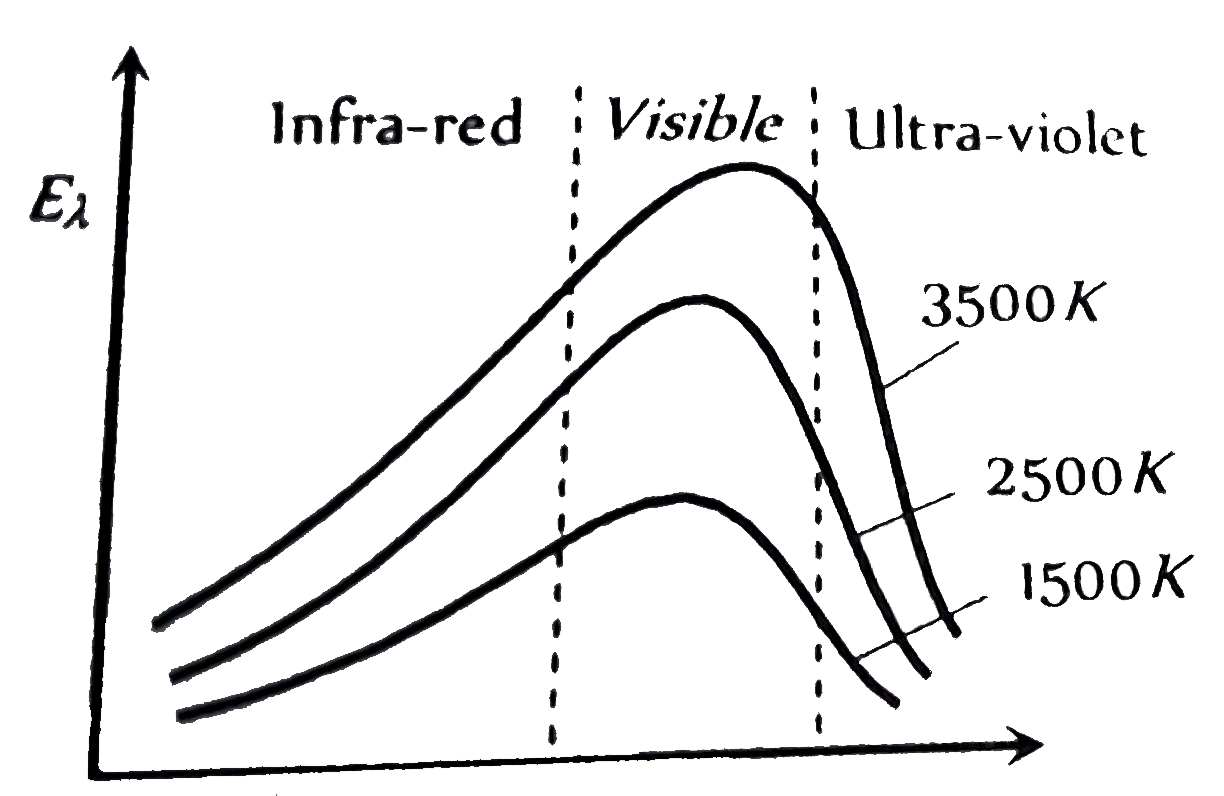
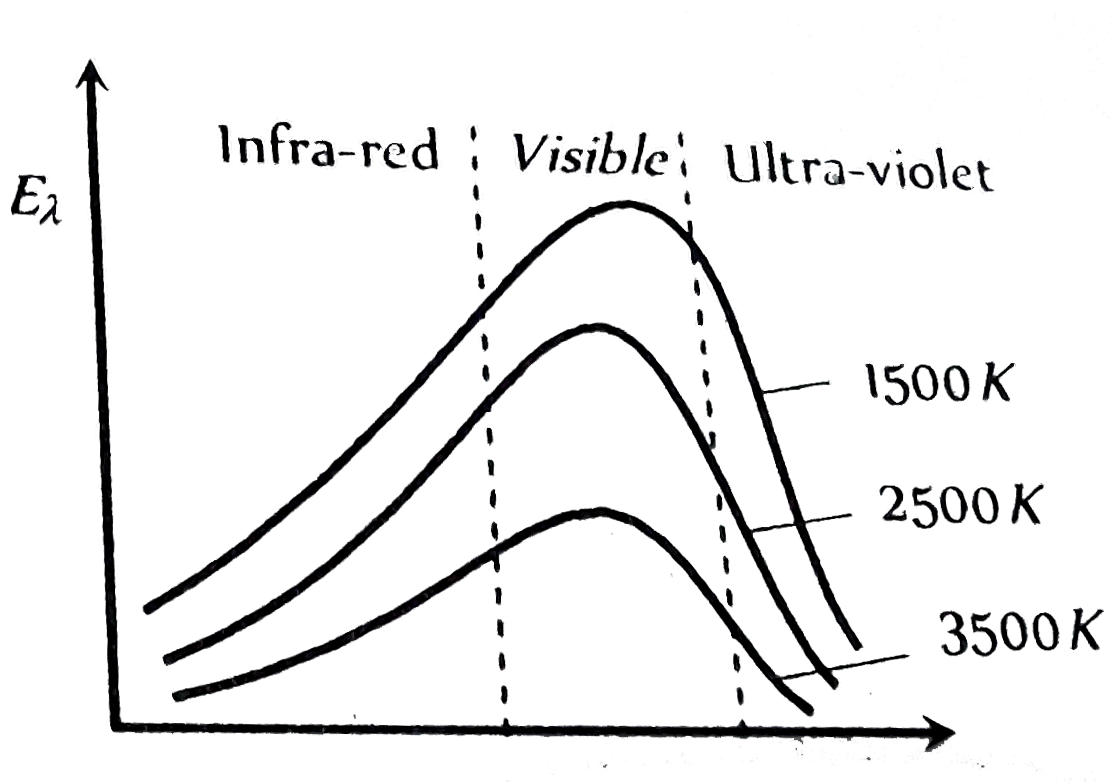
The correct Answer is:C
Step by step video, text & image solution for Following graph shows the correct variation in intensity of heat radiations by black body and frequency at a fixed temperature by Physics experts to help you in doubts & scoring excellent marks in Class 11 exams.
Updated on:21/07/2023Topper's Solved these Questions
- TRANSMISSION OF HEATBOOK - ERRORLESS CHAPTER - TRANSMISSION OF HEATEXERCISE - Assertion & Reason
24 Videos
- TRANSMISSION OF HEATBOOK - ERRORLESS CHAPTER - TRANSMISSION OF HEATEXERCISE - ET Self Evaluation Test
23 Videos
- TRANSMISSION OF HEATBOOK - ERRORLESS CHAPTER - TRANSMISSION OF HEATEXERCISE - Critical Thinking
36 Videos
- THERMOMETRY, THERMAL EXPANSION AND CALORIMETRY BOOK - ERRORLESS CHAPTER - THERMOMETRY, THERMAL EXPANSION AND CALORIMETRY EXERCISE - Self Evaluation Test
15 Videos
- UNITS, DIMENSION & MEASUREMENTSBOOK - ERRORLESS CHAPTER - UNITS, DIMENSION & MEASUREMENTSEXERCISE - All Questions
333 Videos
Similar Questions
Knowledge Check
Which of the following graphs shows the correct variation in intensity of heat radiations by black body and frequency at a fixed temperature
 .A
.A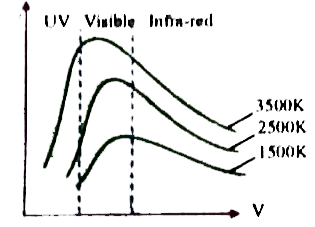 B
B C
C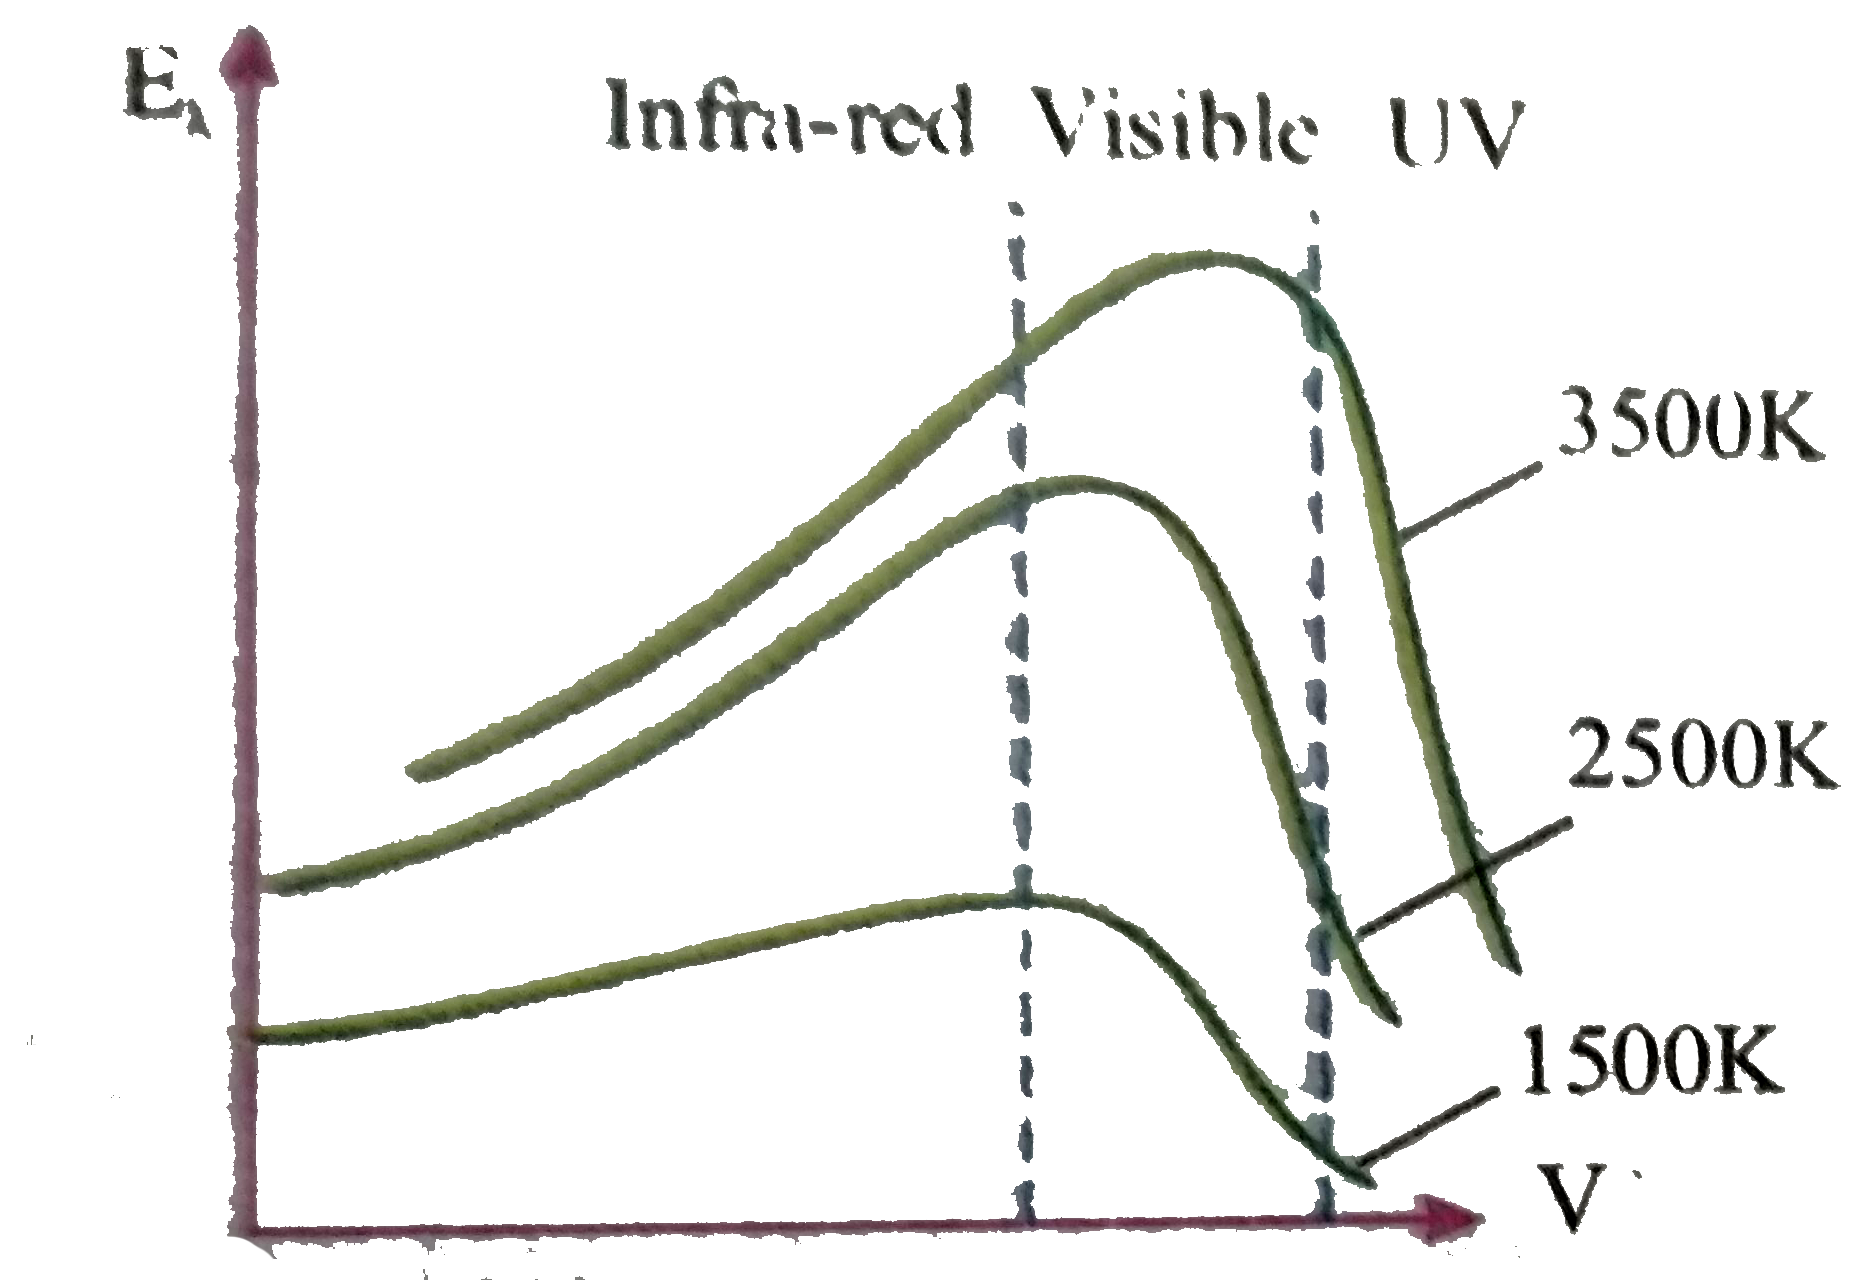 D
D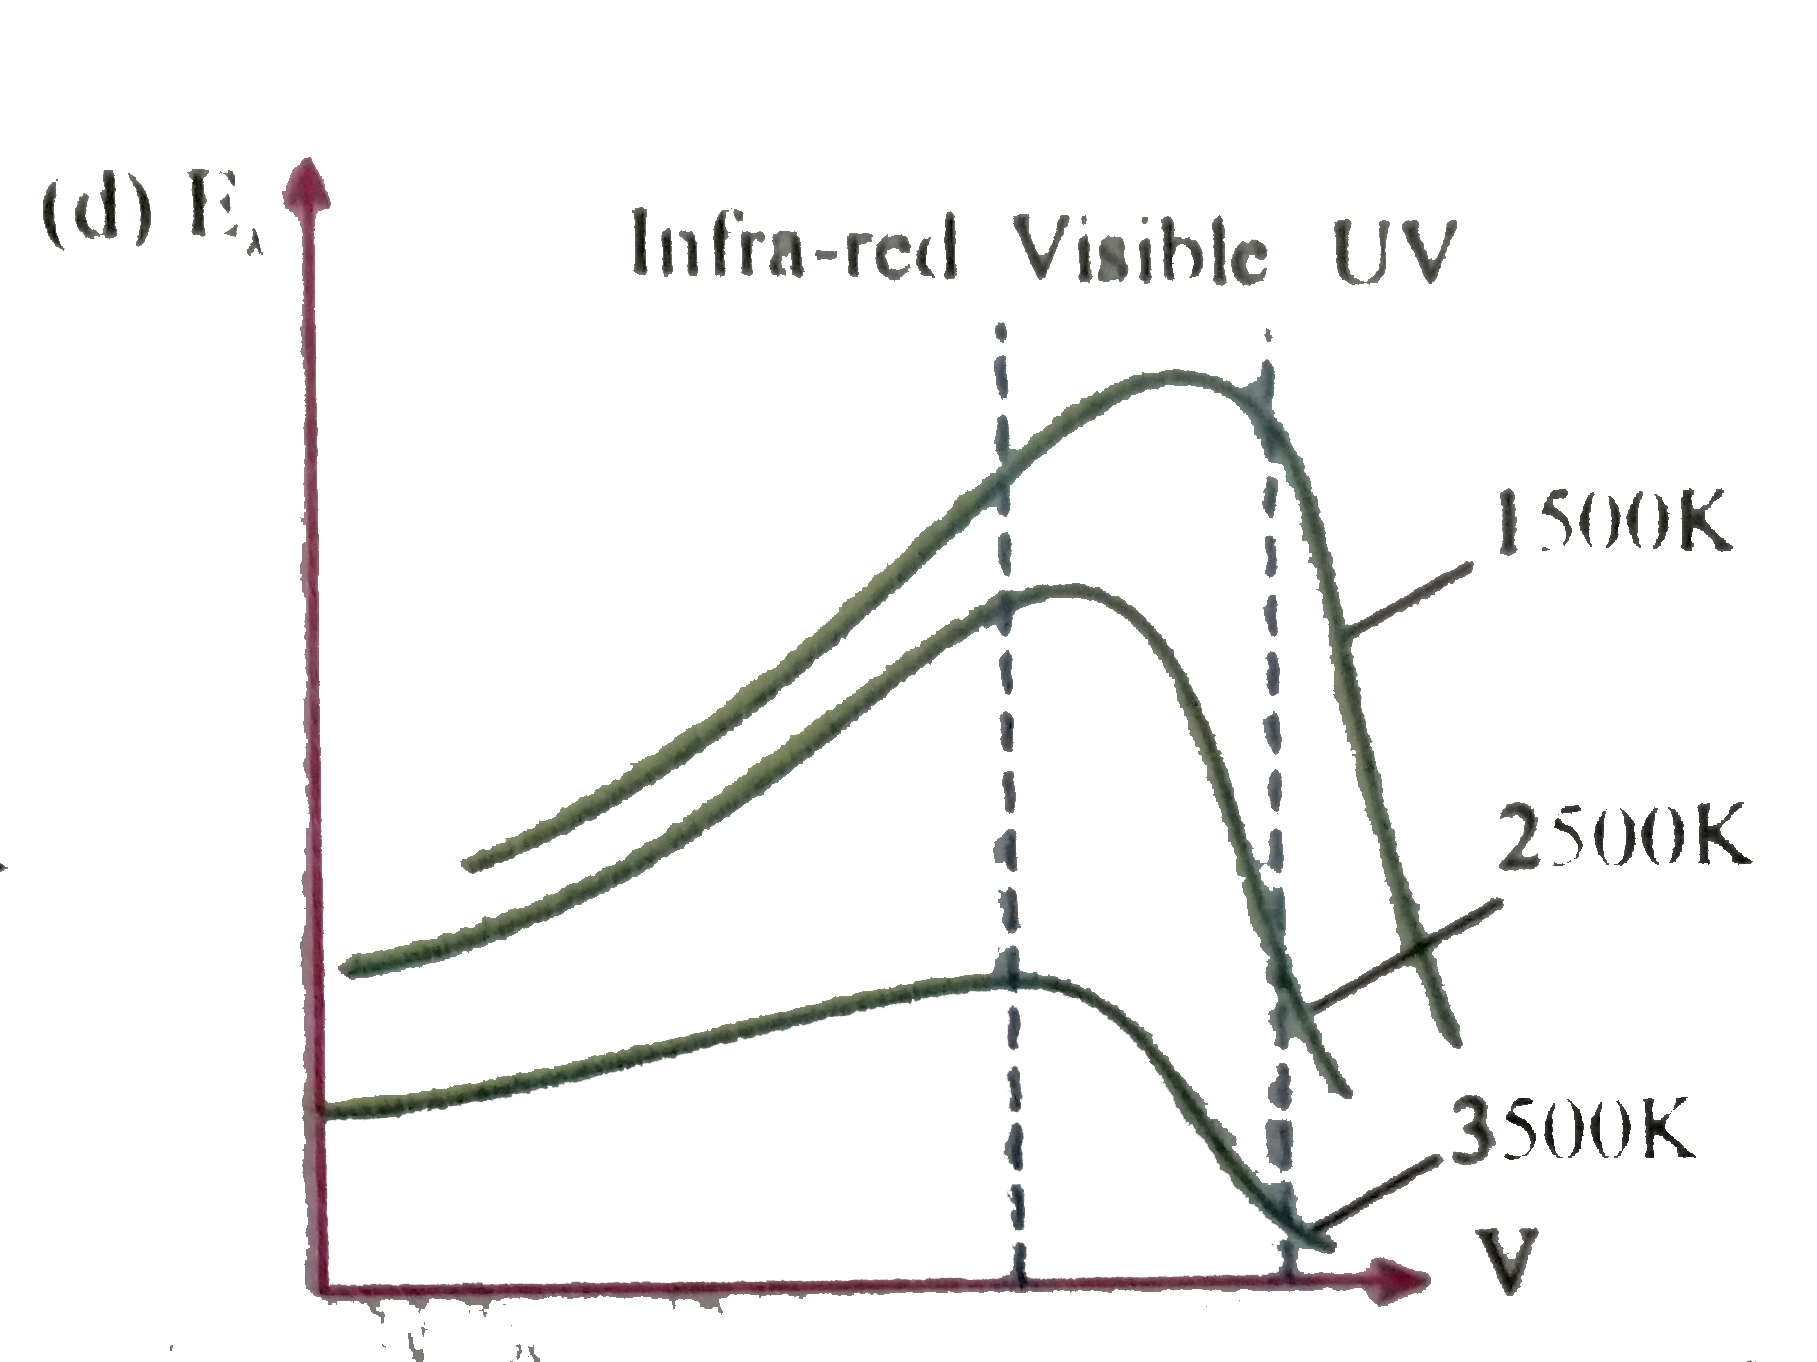
Following graphs shows the variation in the intensity of heat radiations by the the black body and frequency at a fixed temperature . Choose the correct option.
A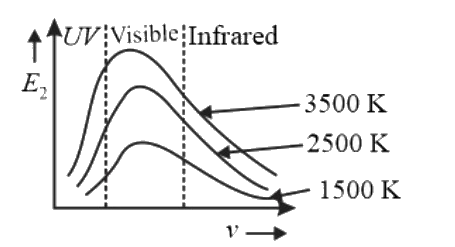 B
B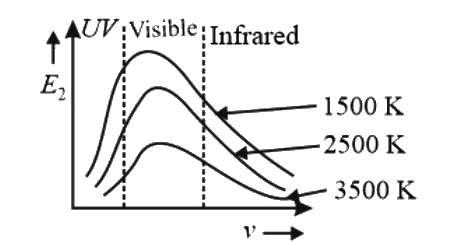 C
C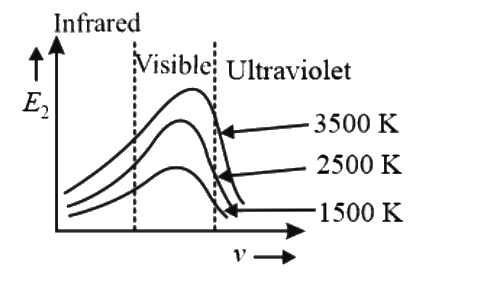 D
D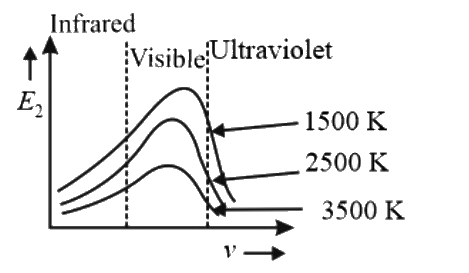
Mark out the correct statement with respect to thermal radiations emitted by a black body
AAt a given temperature, , energy is distributed non - uniformly among different wavelengthsBAs temperature of body is increased , energy content of all wavelengths decreasesCThe product of Eλ (spectral energy) with Dλ (spectral width) , for all equal Δλ' is the sameDThe thermal radiation emitted by a hot body is a discrete spectra
If a black body is heated at a high temperature, it seems to be
View SolutionIf a black body is heated at a high temperature, it seems to be
View SolutionIf a black body is heated at a high temperature, it seems to be
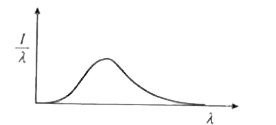
View SolutionThe graph shows the variation in radiation intensity per unit wavelength versus wavelength for a perfect black- body at temperature T. Complete the following statement: As the blackbody temperature is increased, the peak in intensity of this curve
View SolutionWhich of the following graphs represents correctly the variations of 0.5mv2max with the intensity of incident radiations of a constant frequency ?
View Solution

