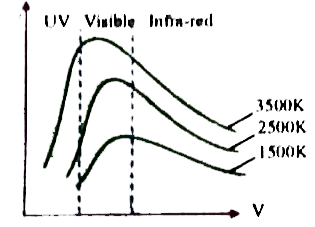
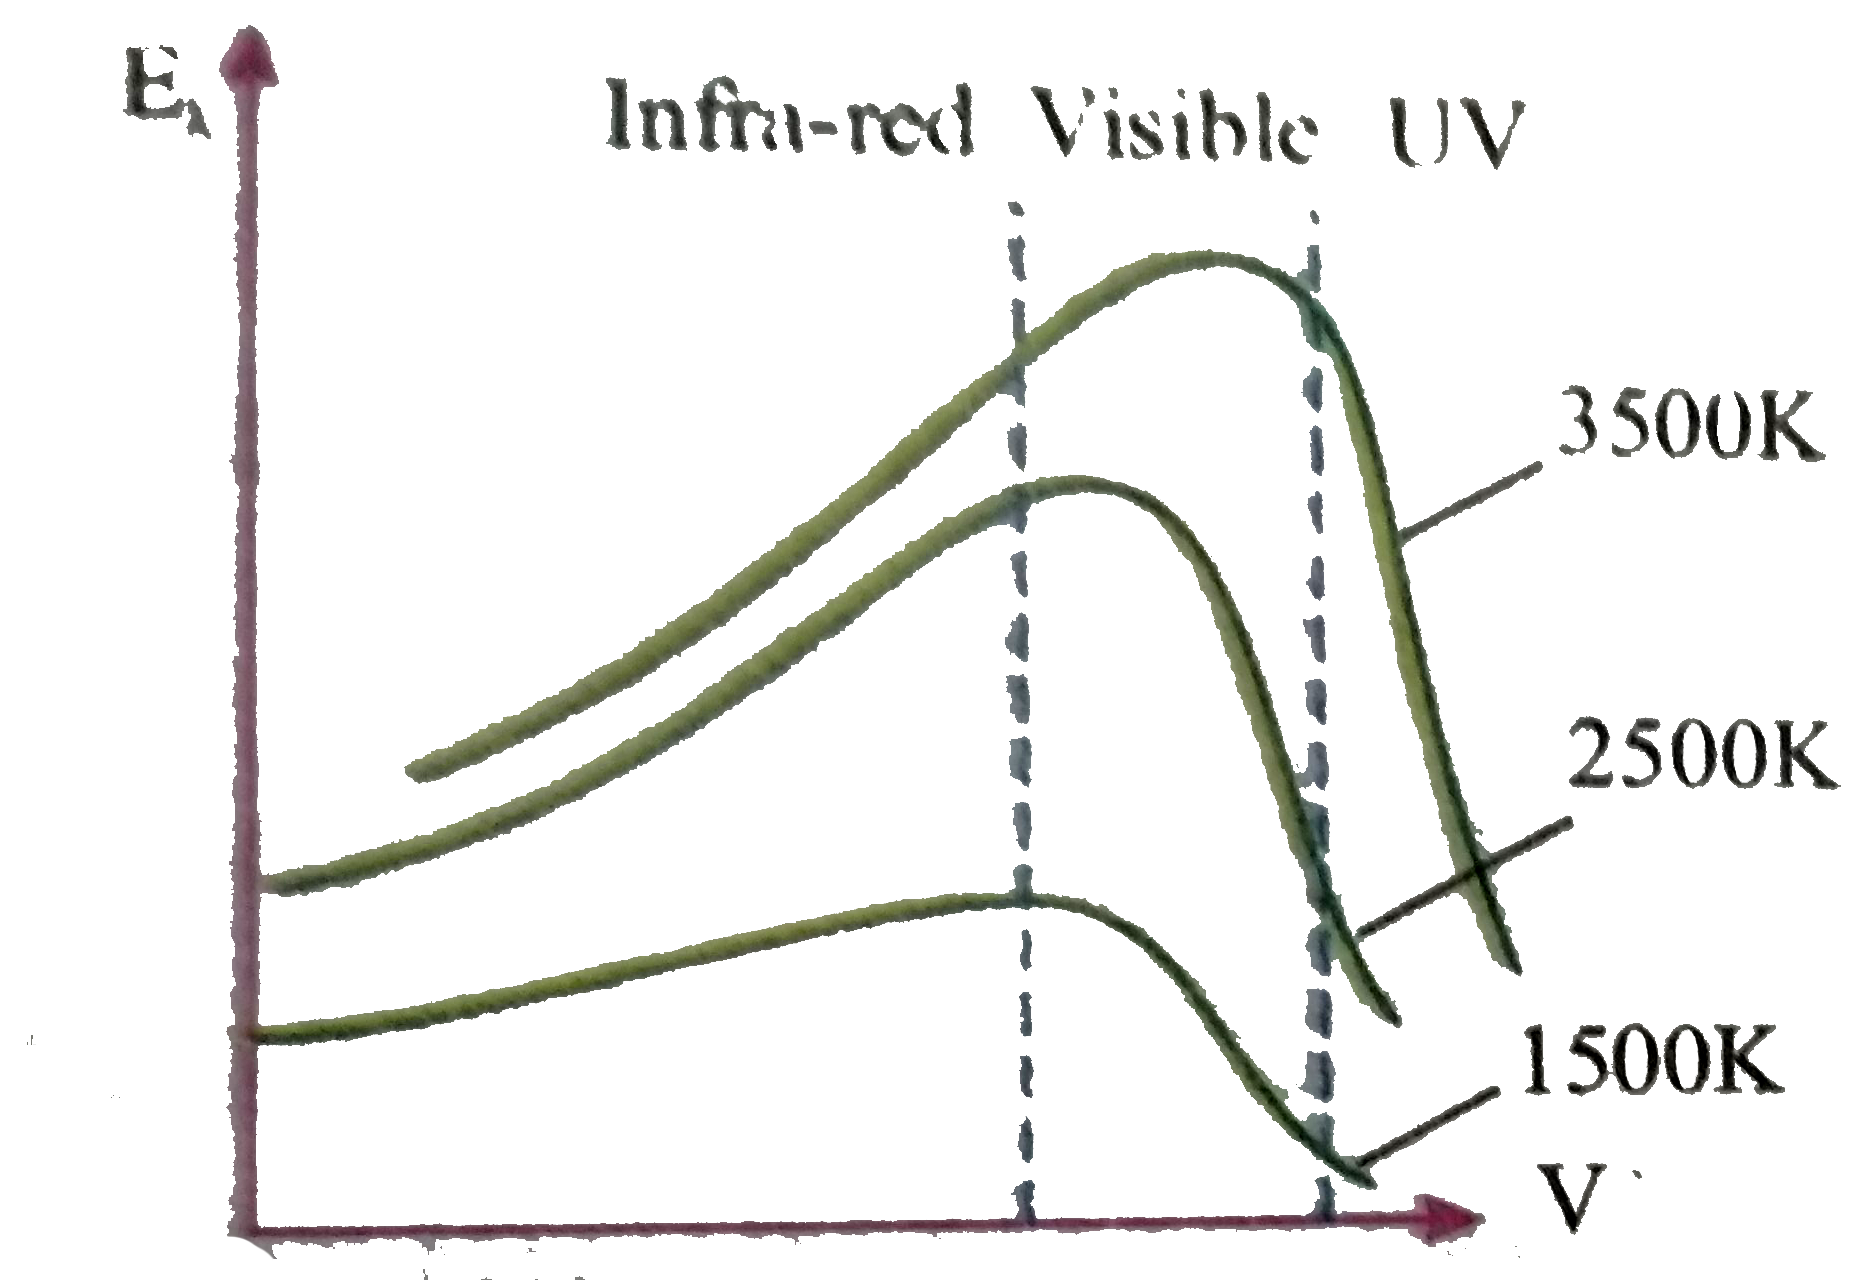
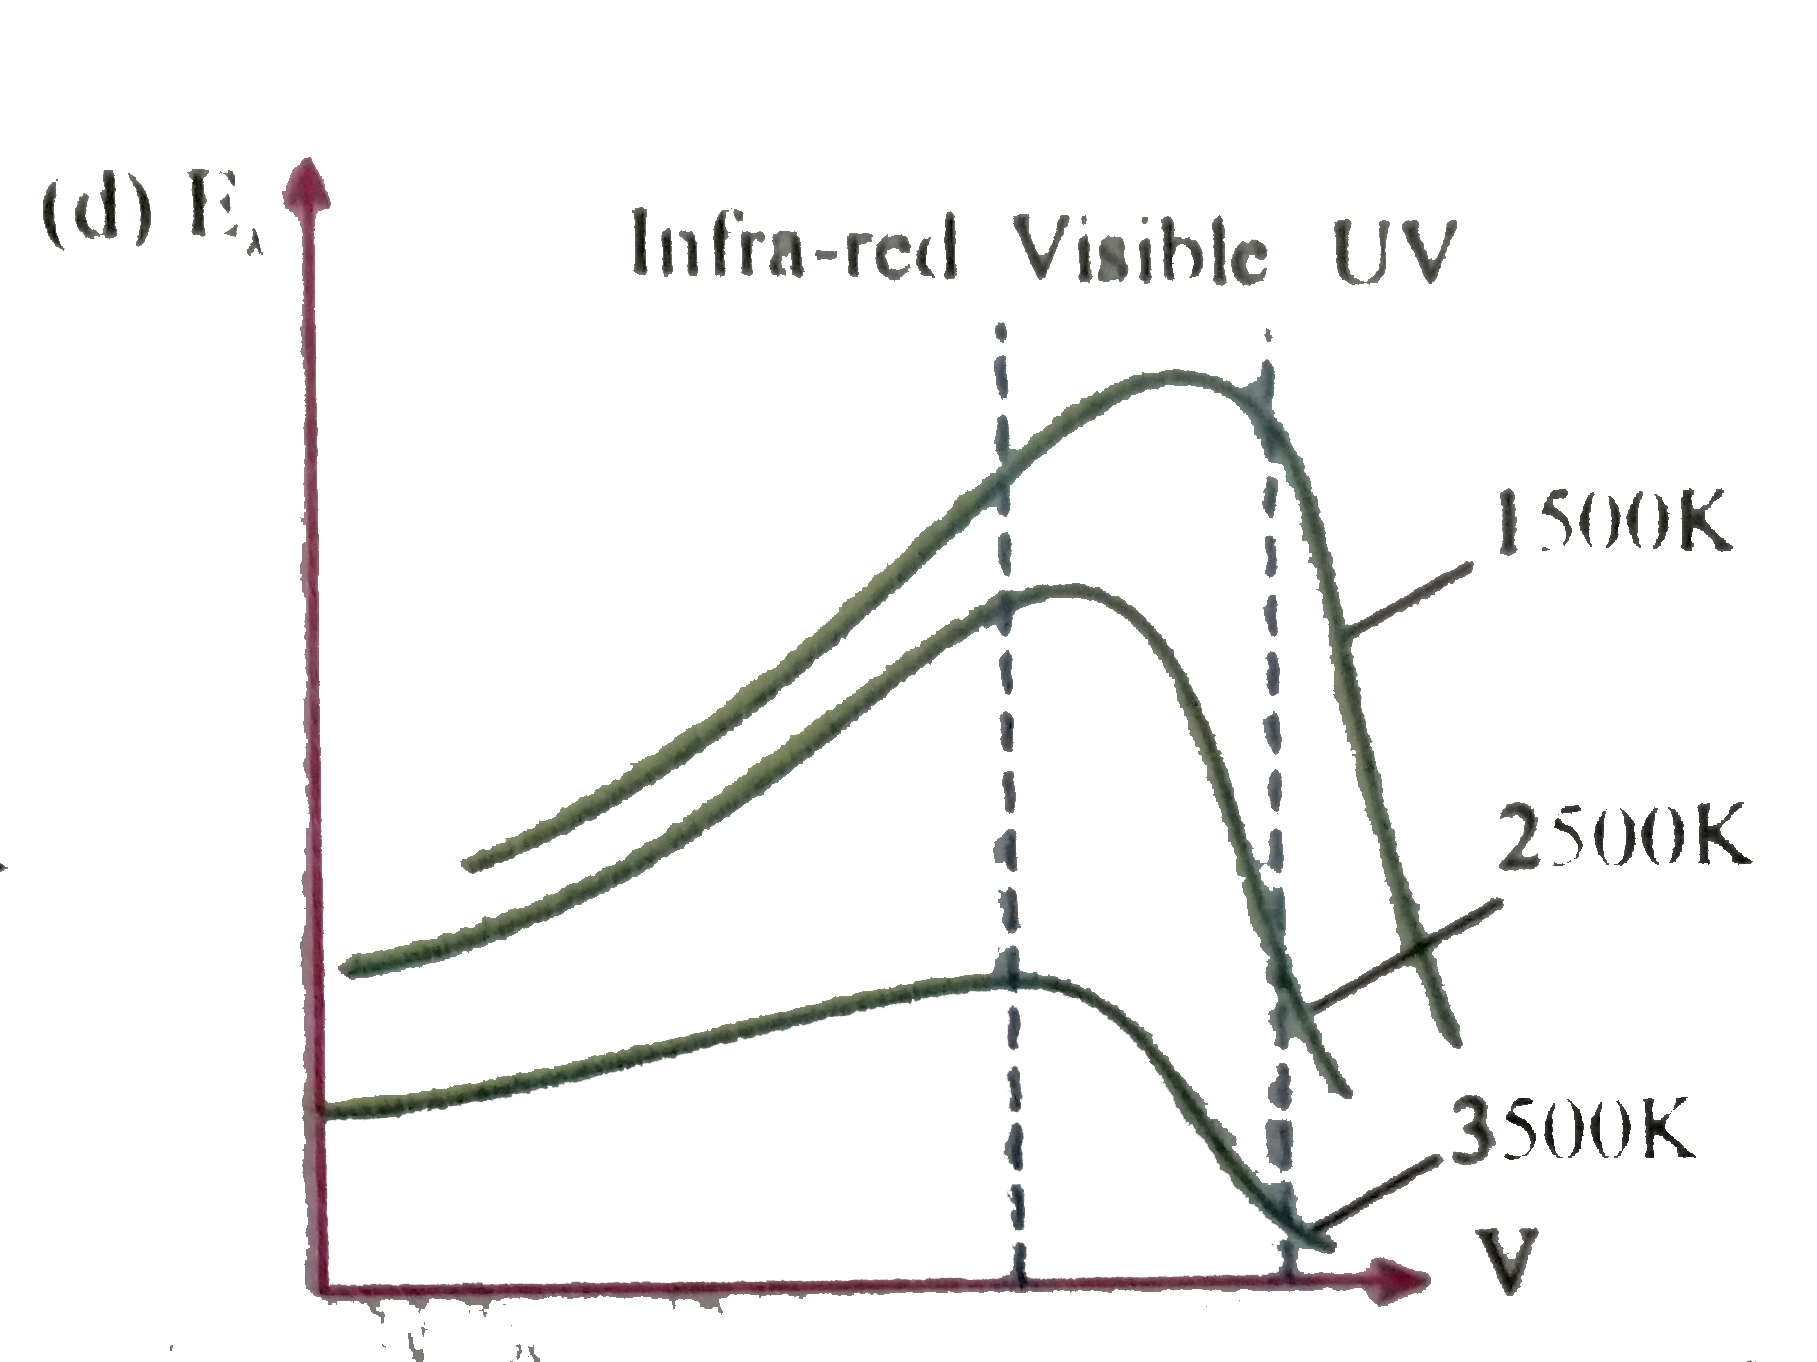
Which of the following graphs shows the correct variation in intensity of heat radiations by black body and frequency at a fixed temperature
 .
.
A
B

C
D
Video Solution
Text Solution
The correct Answer is:C
According to Wien's law λm∝1T⇒vm∝T
As the temperature of body increases, frequency corresponding to maximum energy in radiation (λ+m) increases. Also under the curve ∫Evdv∝T4 .
|
Topper's Solved these Questions
- TRANSMISSION OF HEATBOOK - NARAYNACHAPTER - TRANSMISSION OF HEATEXERCISE - LEVEL-I(H.W)
19 Videos
- TRANSMISSION OF HEATBOOK - NARAYNACHAPTER - TRANSMISSION OF HEATEXERCISE - LEVEL-II(C.W)
27 Videos
- TRANSMISSION OF HEATBOOK - NARAYNACHAPTER - TRANSMISSION OF HEATEXERCISE - SINGLE ANSWER QUESTIONS Passage -1
1 Videos
- THERMODYNAMICSBOOK - NARAYNACHAPTER - THERMODYNAMICSEXERCISE - Exercise
187 Videos
- UNITS AND MEASUREMENTSBOOK - NARAYNACHAPTER - UNITS AND MEASUREMENTSEXERCISE - STATEMENT TYPE QUESTION
23 Videos
Similar Questions
Knowledge Check
Following graph shows the correct variation in intensity of heat radiations by black body and frequency at a fixed temperature
A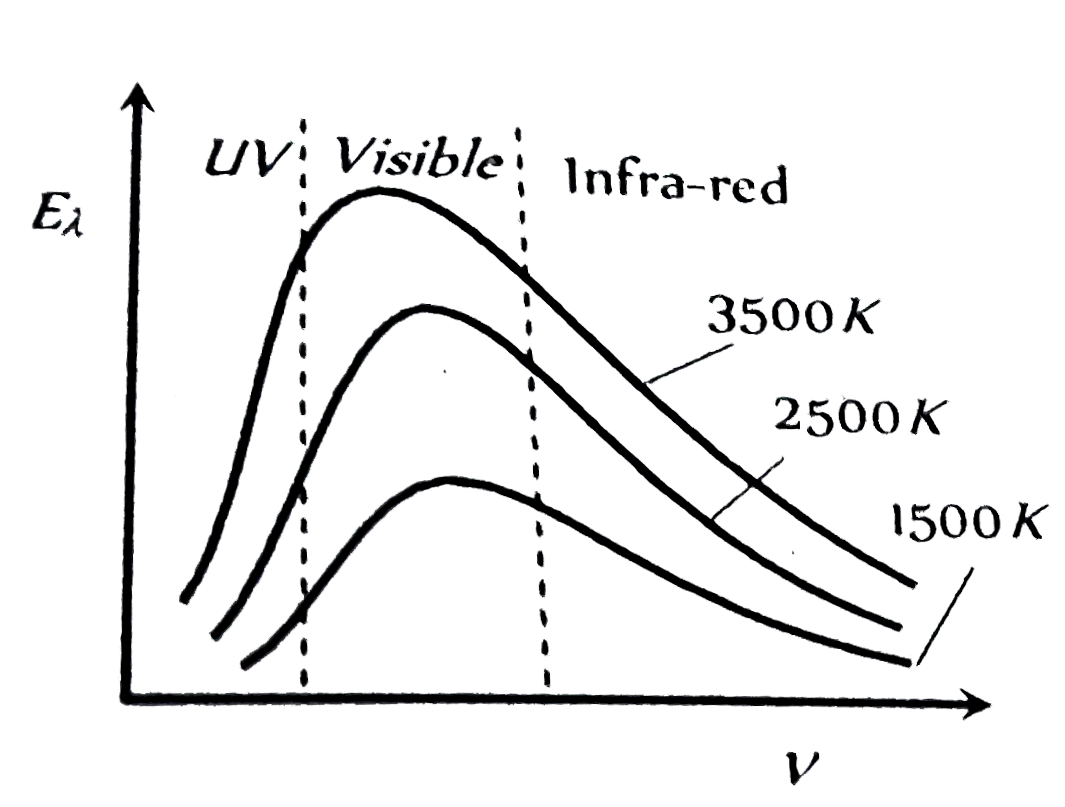 B
B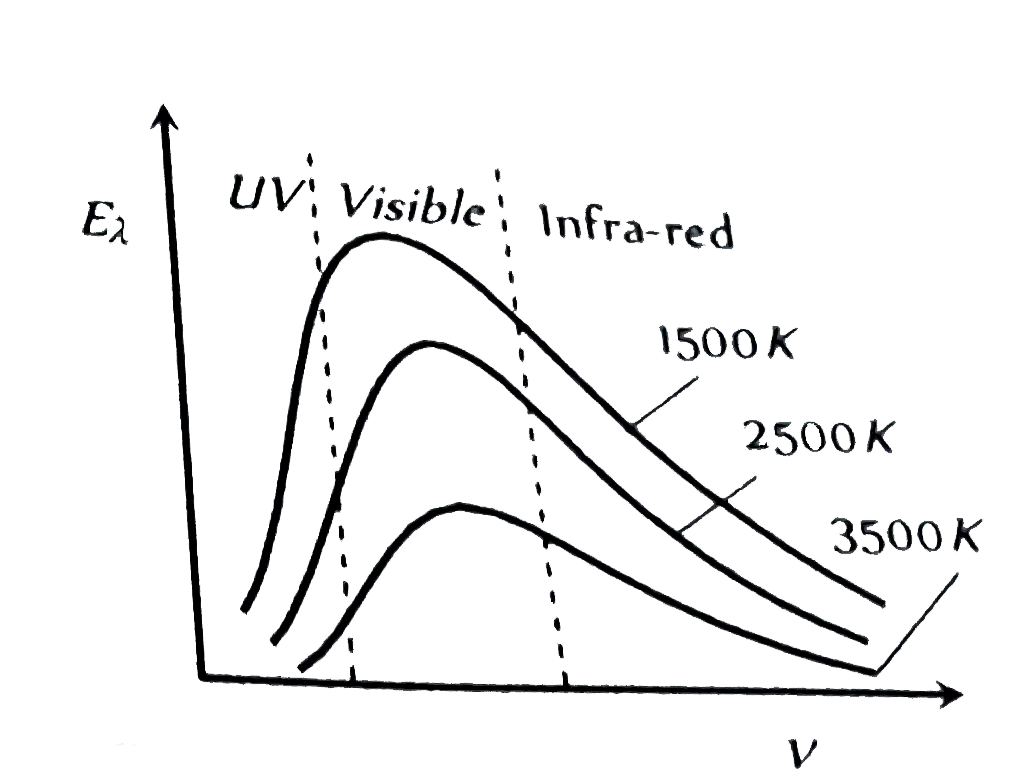 C
C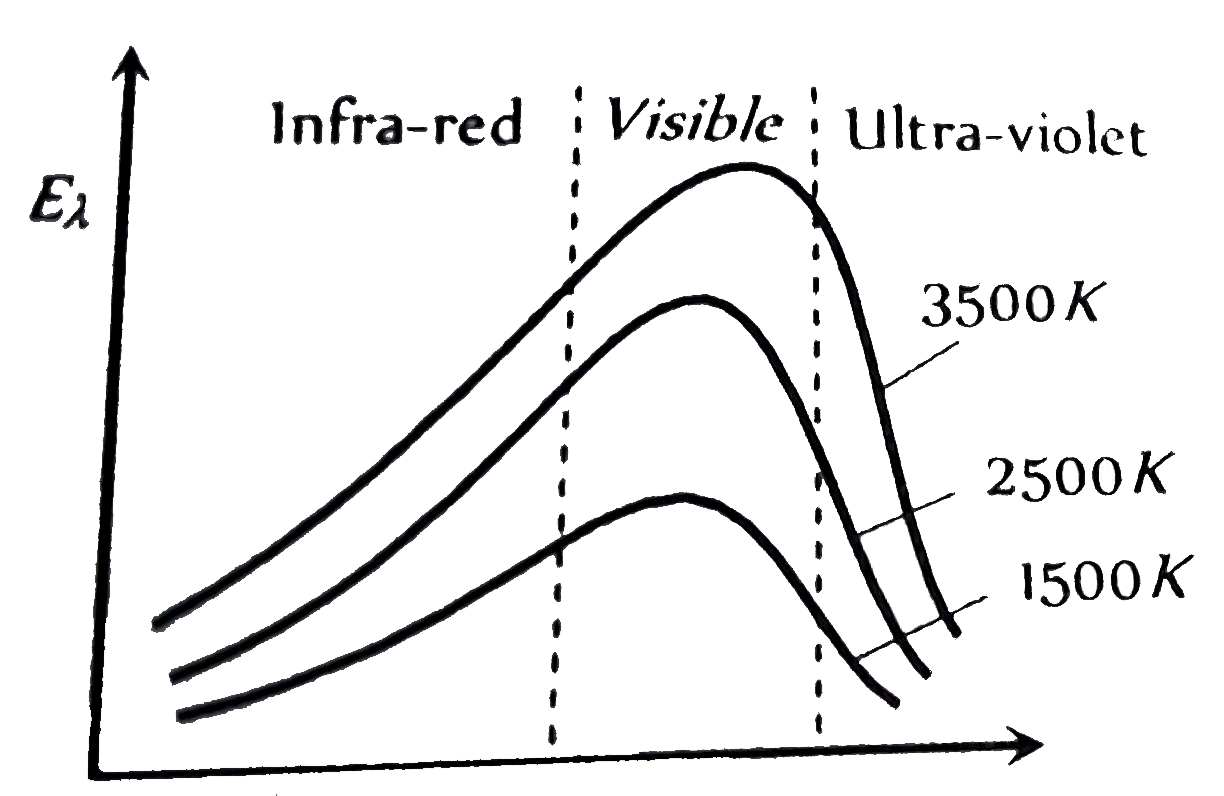 D
D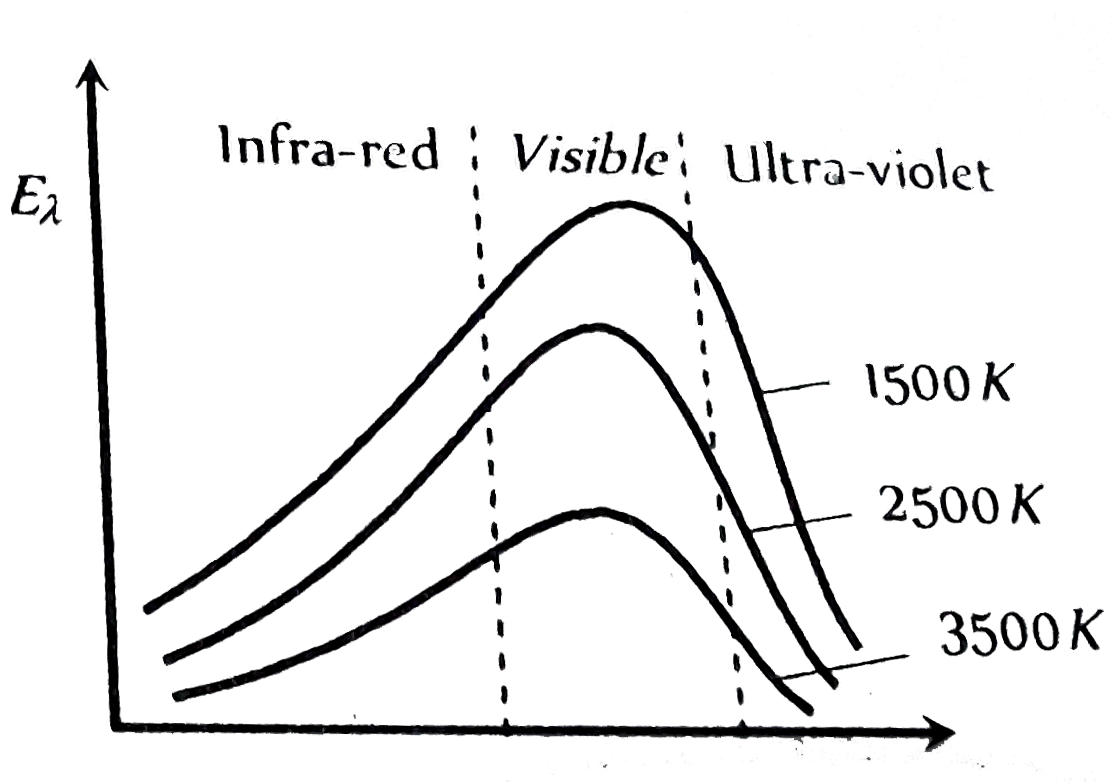
Following graphs shows the variation in the intensity of heat radiations by the the black body and frequency at a fixed temperature . Choose the correct option.
A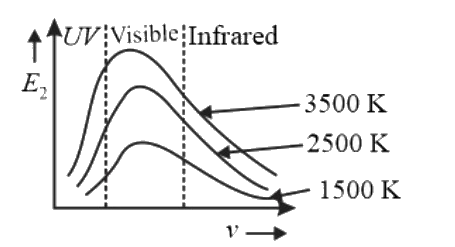 B
B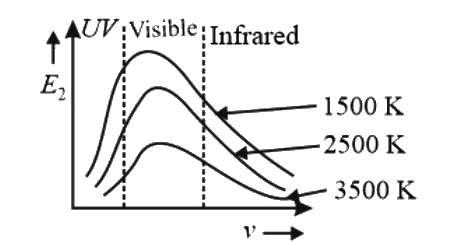 C
C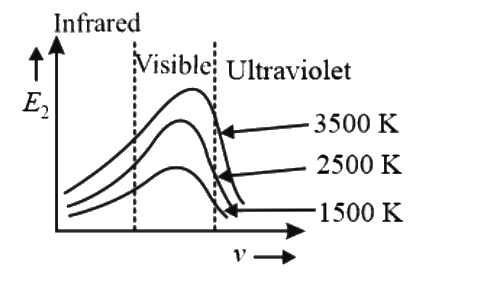 D
D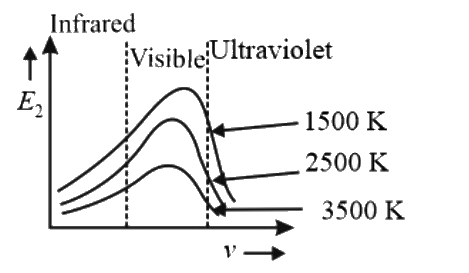
Which of the following graphs shows variation between density of water and temperature?
A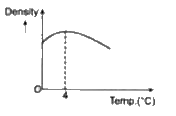 B
B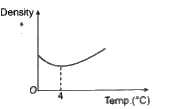 C
C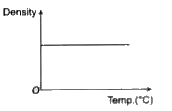 D
D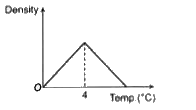
Which one of the following graphs best represents the ways in which the total power P radiated by a black body depends upon the thermodynamic temperature T of the body?
View Solutionwhich of the following is NOT the property of black body radiations?
View SolutionWhich one of the following graphs shows the rate at which heat is emitted from a hot body as a function of its Kelvin temperature T' ?
View SolutionWhich of the following graphs correctly shows variation of coefficient of volume expansion of copper as a function of temperature ?
View SolutionIf a black body is heated at a high temperature, it seems to be
View Solution
