P - V diagram of an ideal gas is shown. The gas undergoes from initial state A to final state B such that initial and final volumes are same. Select the correct alternative for given process AB.
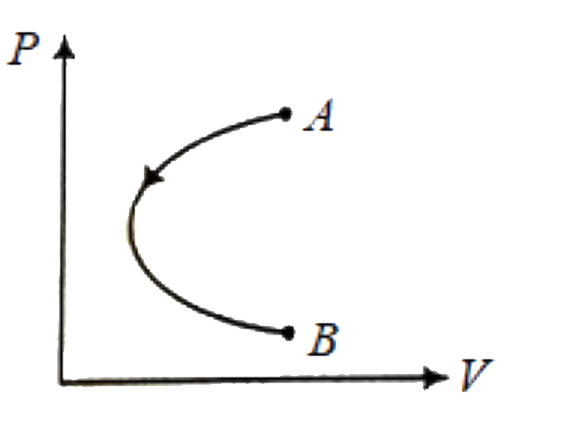
Work done by gas is positive
Work done by gas is negative
Temperature of gas increases continuously
Process is isochoric
The correct Answer is:B
Step by step video & image solution for P - V diagram of an ideal gas is shown. The gas undergoes from initial state A to final state B such that initial and final volumes are same. Select the correct alternative for given process AB. by Physics experts to help you in doubts & scoring excellent marks in Class 12 exams.
Updated on:21/07/2023Similar Questions
An idel gas undrgoes isothermal process from some initial state i to final state f. Choose the correct alternatives.
View SolutionAn ideal gas is taken from an initial state i to a final state f in such a way that the ratio of the pressure to the absolute temperature remains constant. What will be the work done by the gas ?
View Solution
Knowledge Check
An ideal gas undergoes isothermal process from some initial state i to final state f. Choose the correct alternatives.
A1.dU=dQB2. dU=-dWC3. dU=0D4. dU=dWOne mole of an ideal gas goes from an initial state A to final state B via two processs : It first undergoes isothermal expansion from volume V to 3V and then its volume is reduced from 3V to V at constant pressure. The correct P−V diagram representing the two process in (figure)
A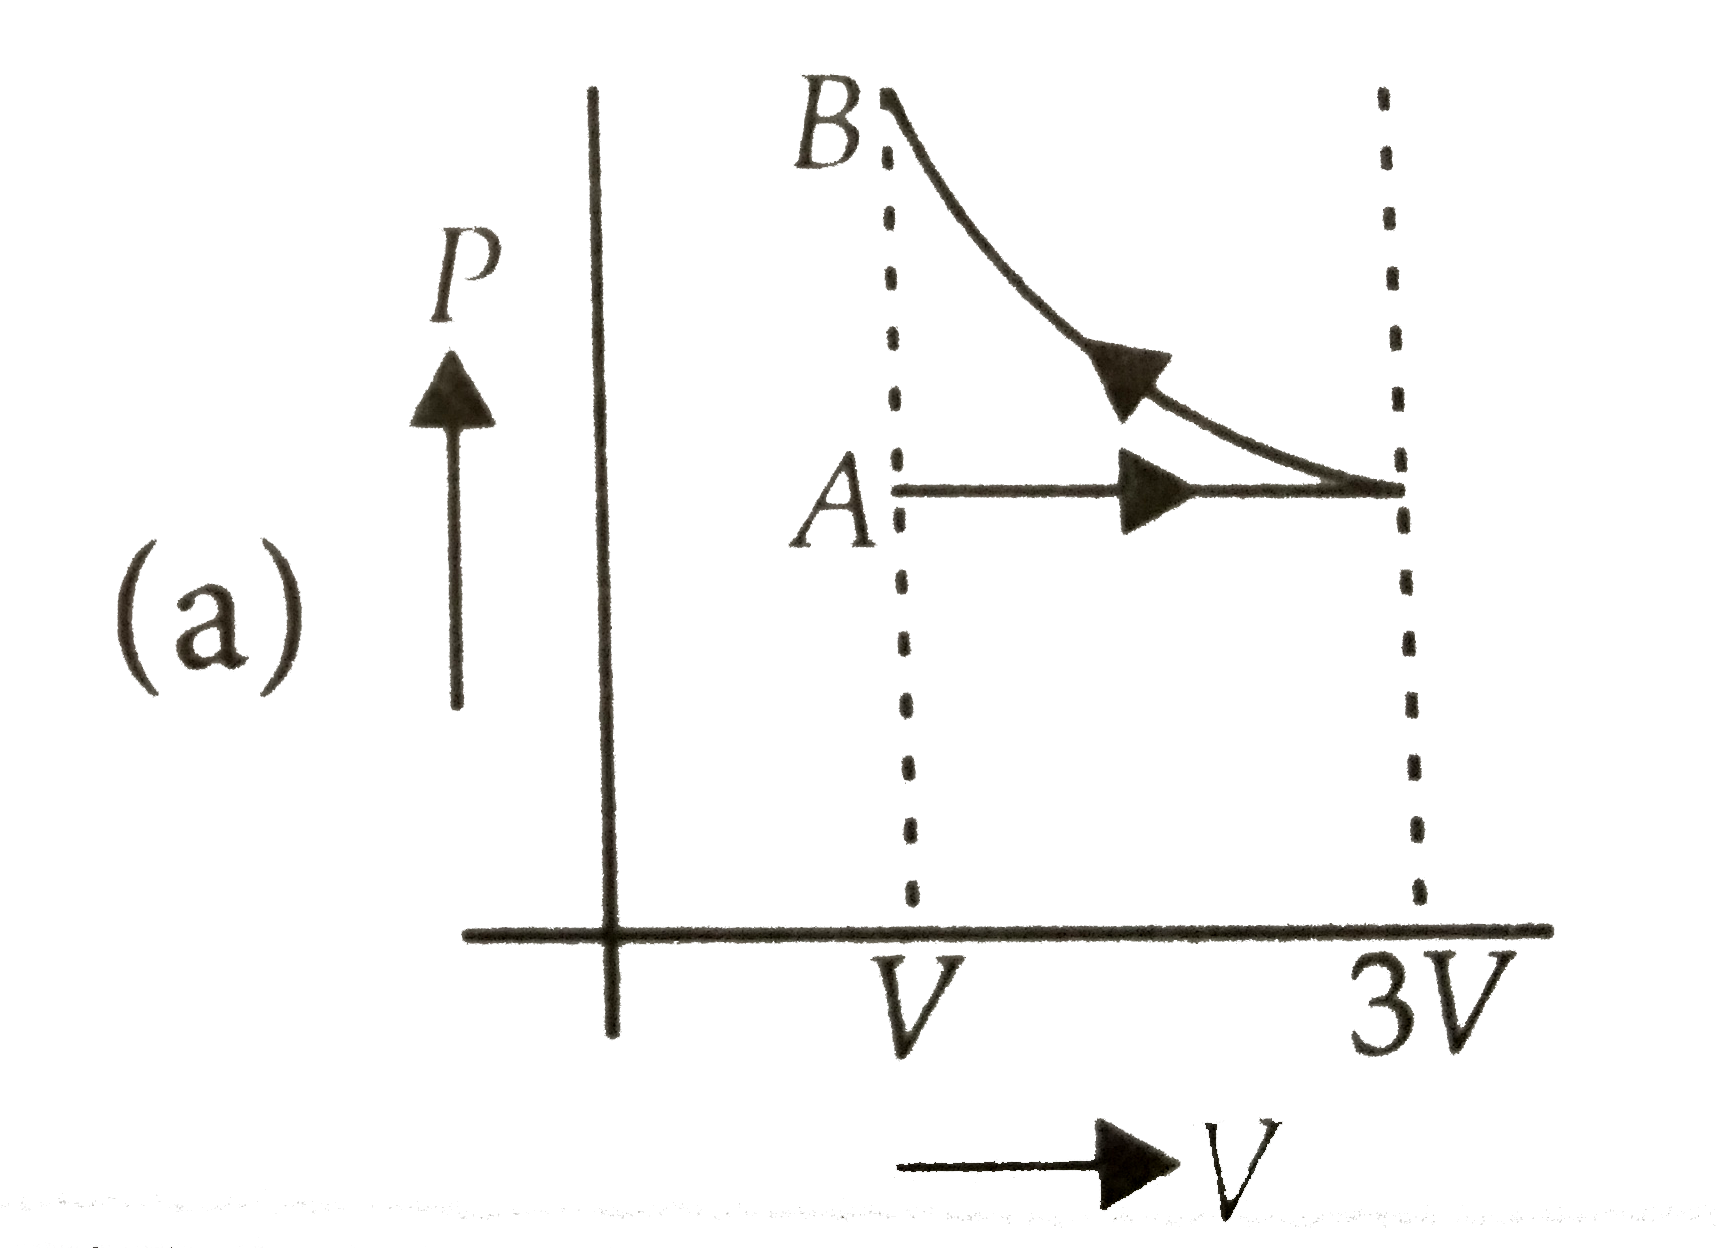 B
B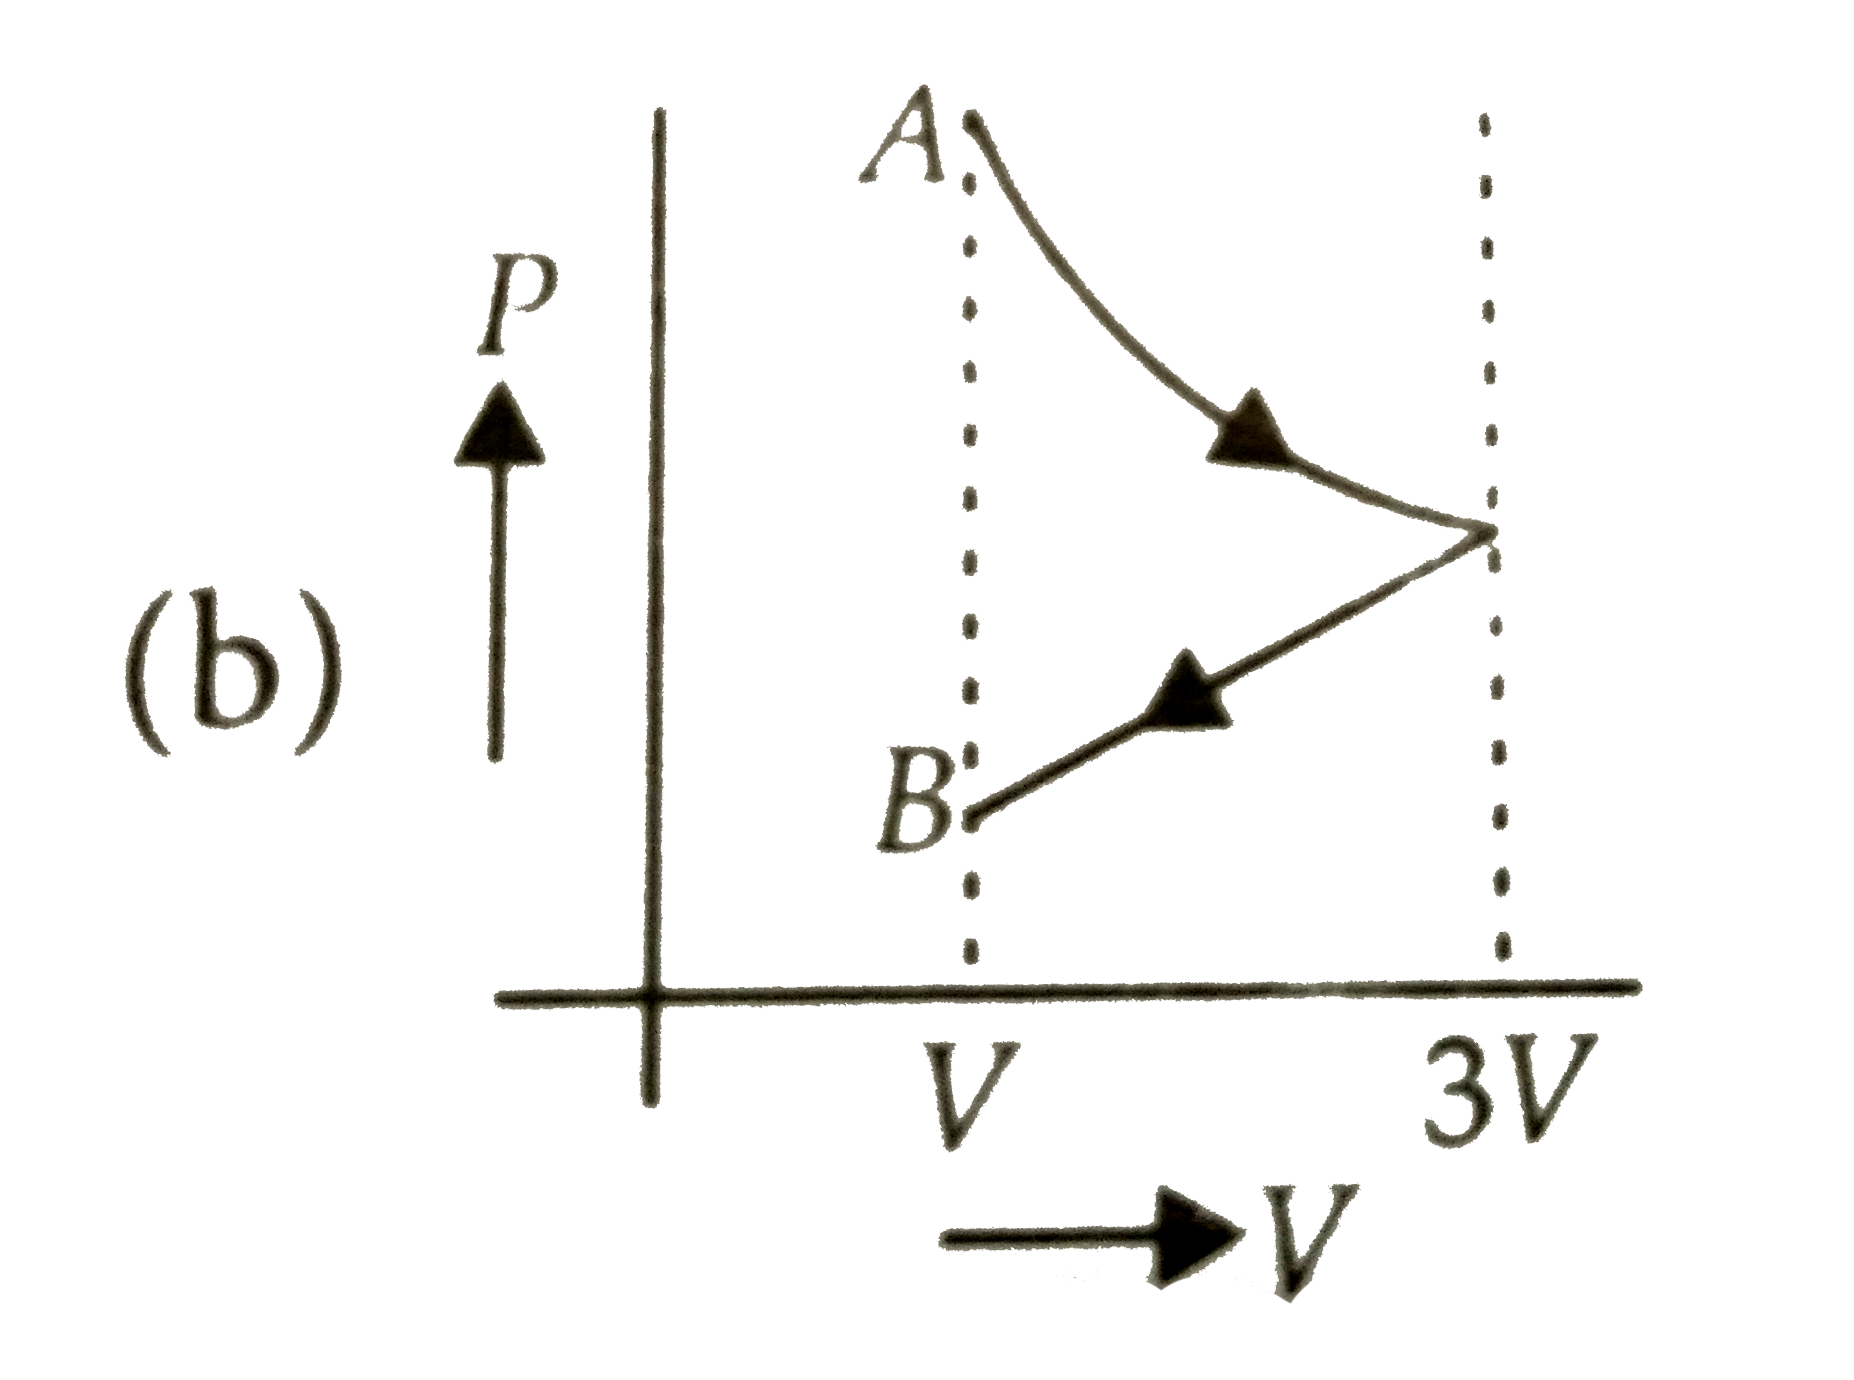 C
C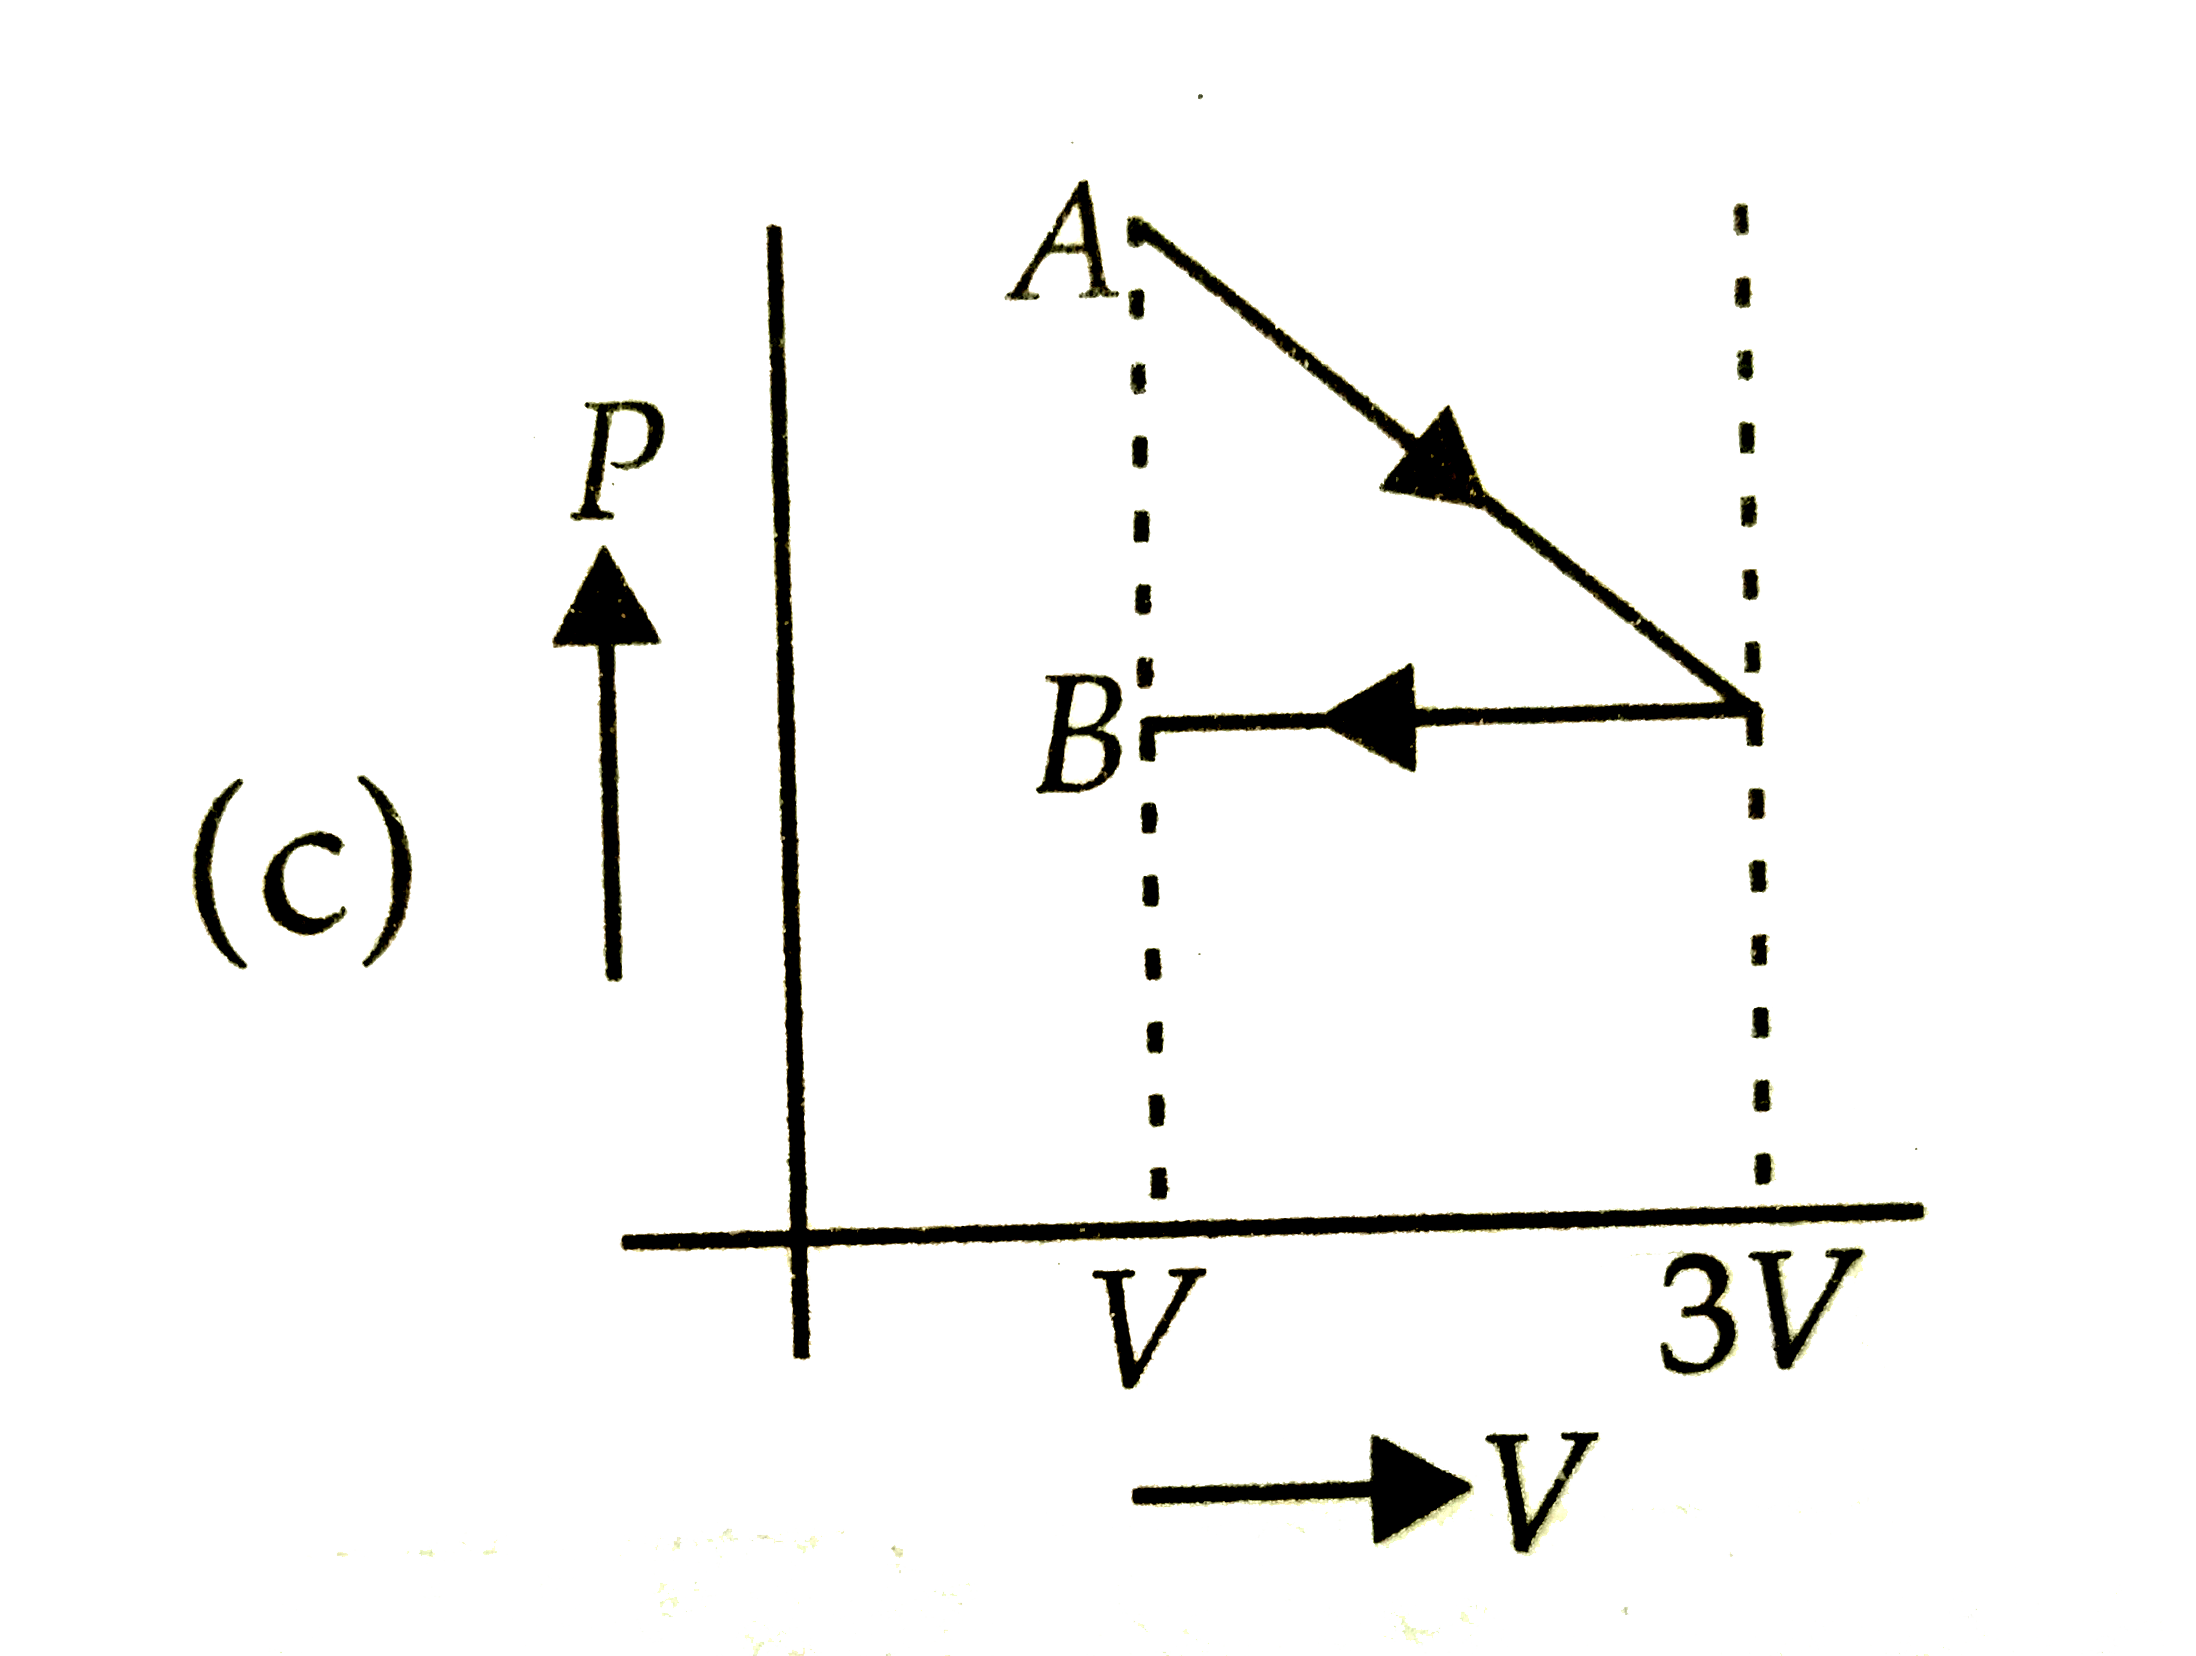 D
D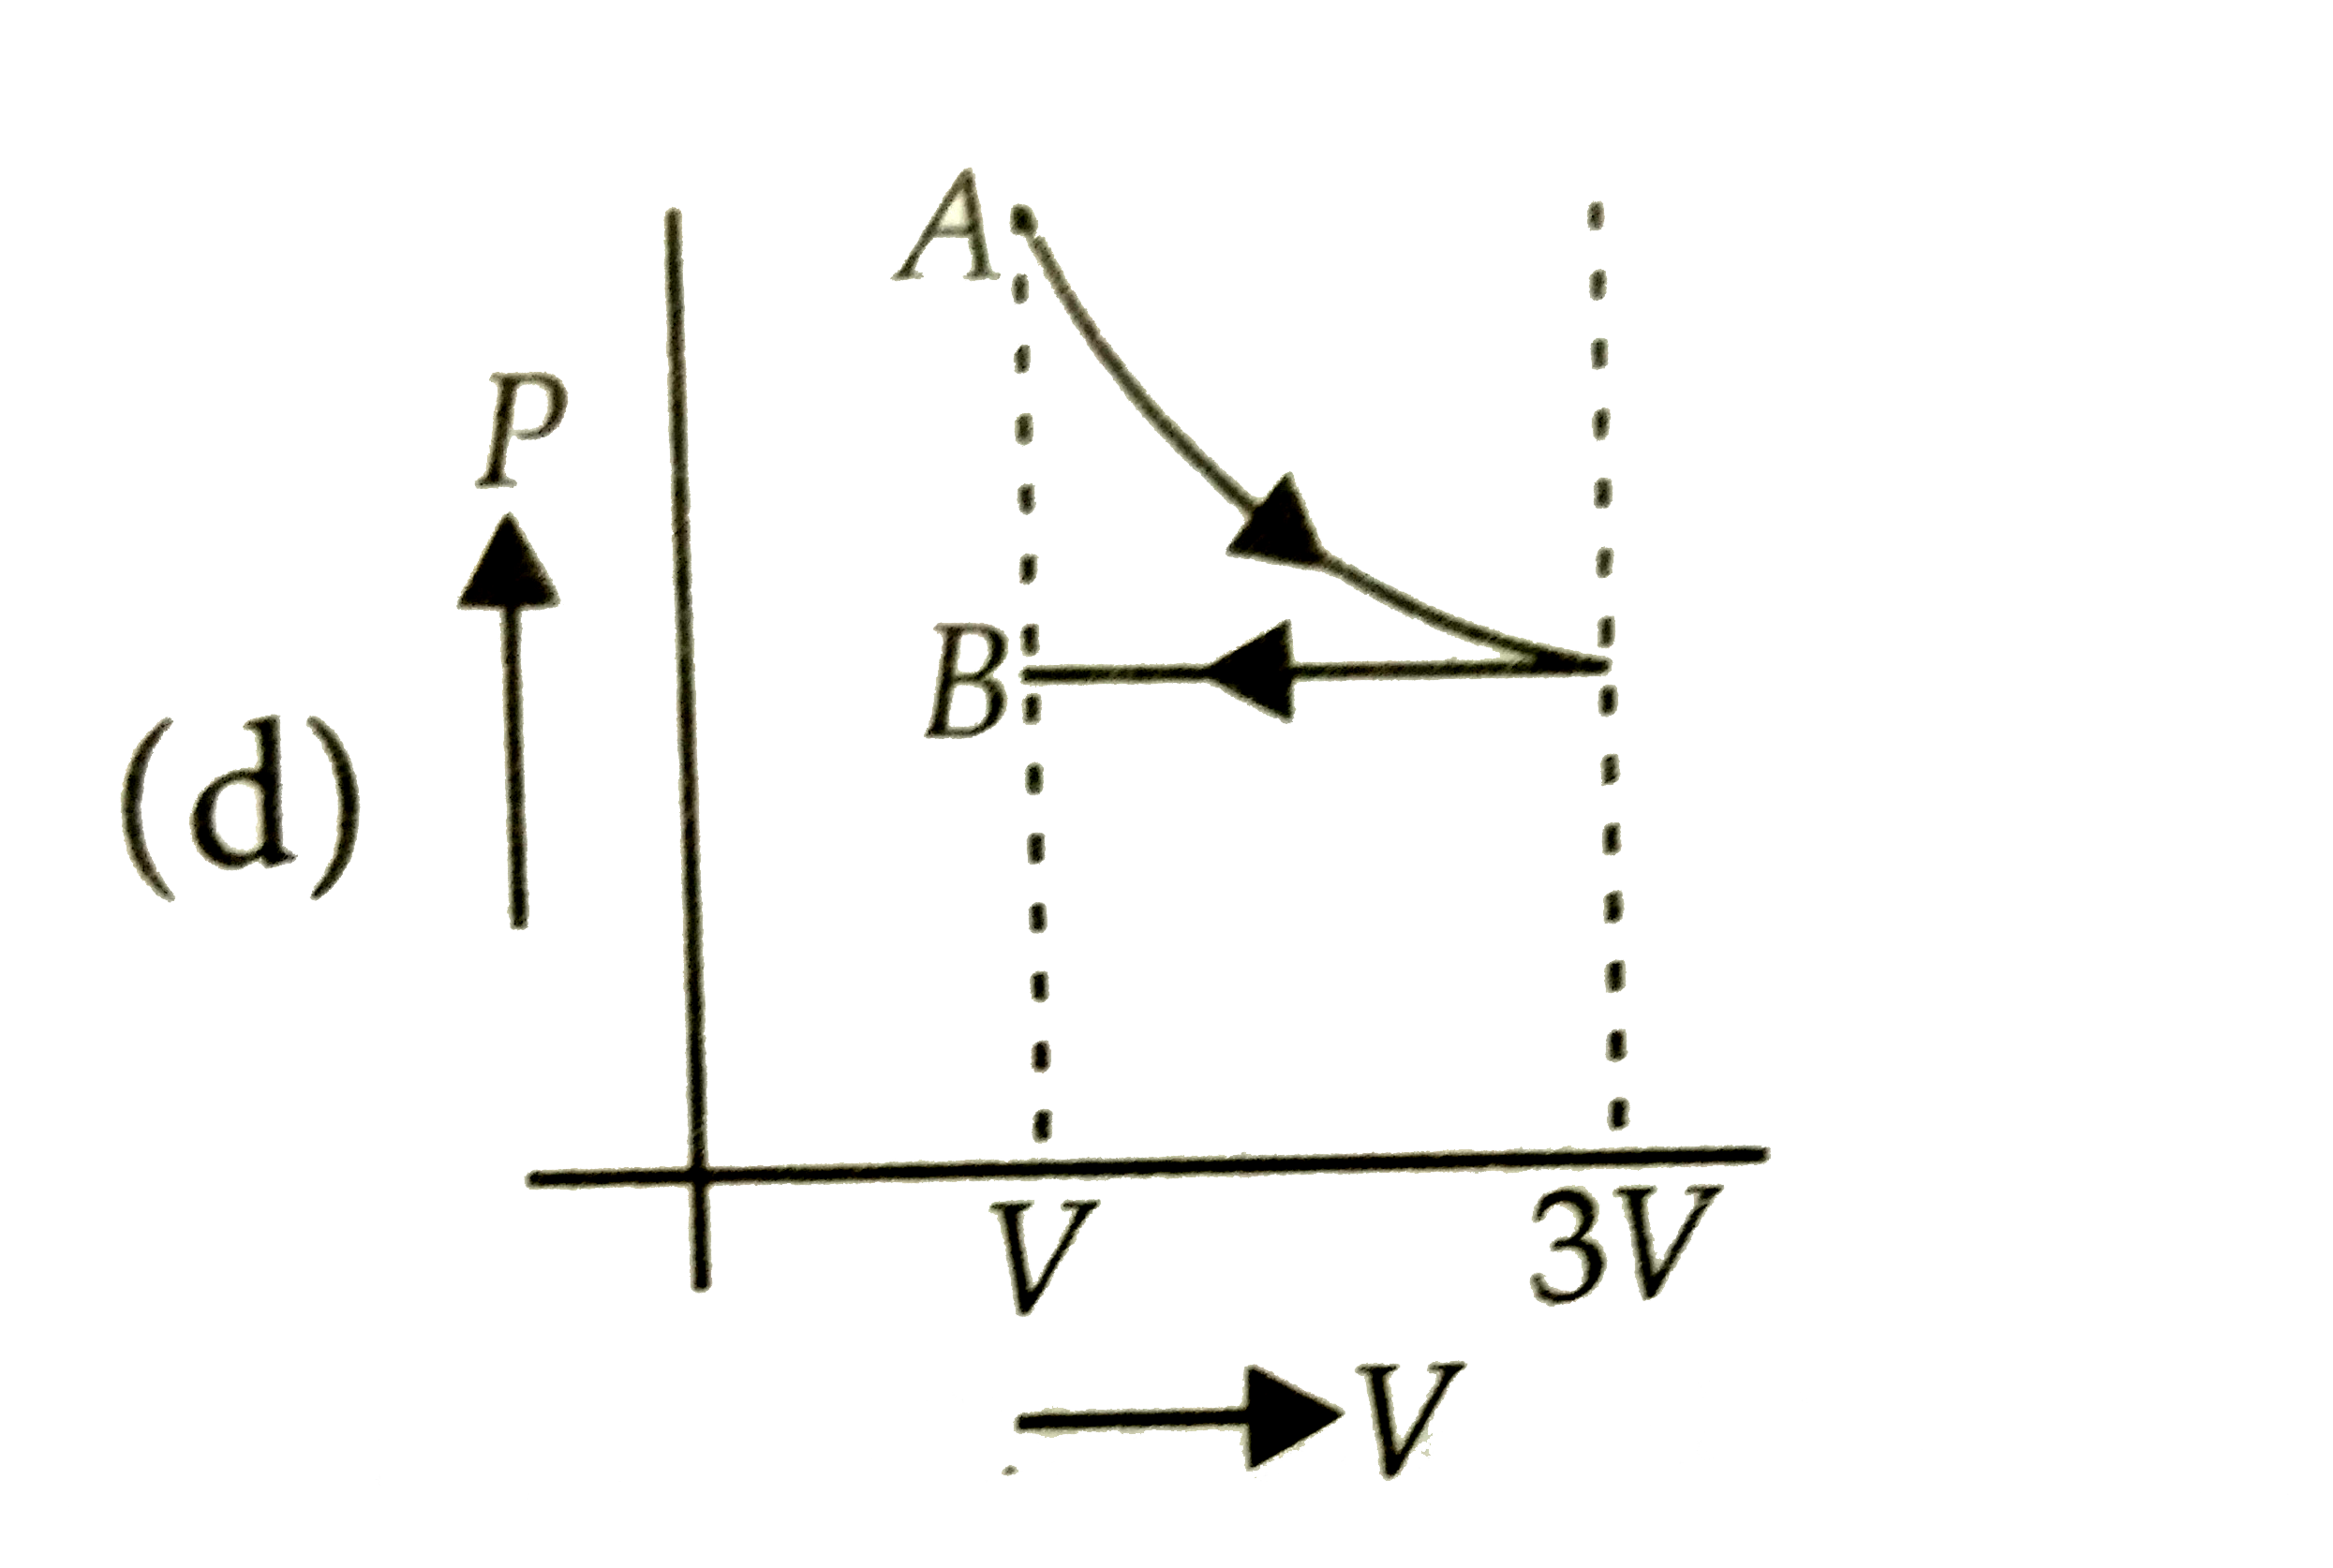
When a sample of ideal gas is changed from an initial state to a final state, various curves can be plotted for the process like P-V curve, V-T curve,P-T curve etc.
For example, P-V curve for a fixed amount of an ideal gas at constant temperature is a rectangular hyperbola, V-T curve for a fixed amount of an ideal gas at constant volume is again a straight line. However, the shapes may vary if the constant parameters are also changed.
Now, answer the following questions :
Two moles of an ideal gas is changed from its initial state (16 atm, 6L) to final state (4 atm, 15L) in such a way that this change can be represented by a straight line in P-V curve.The maximum temperature attained by the gas during the above change is :(Take : R=112LatmK−1mol−1)
View SolutionFor an ideal gas of fixed amount, the initial pressure and volume are equal to the final pressure and volume
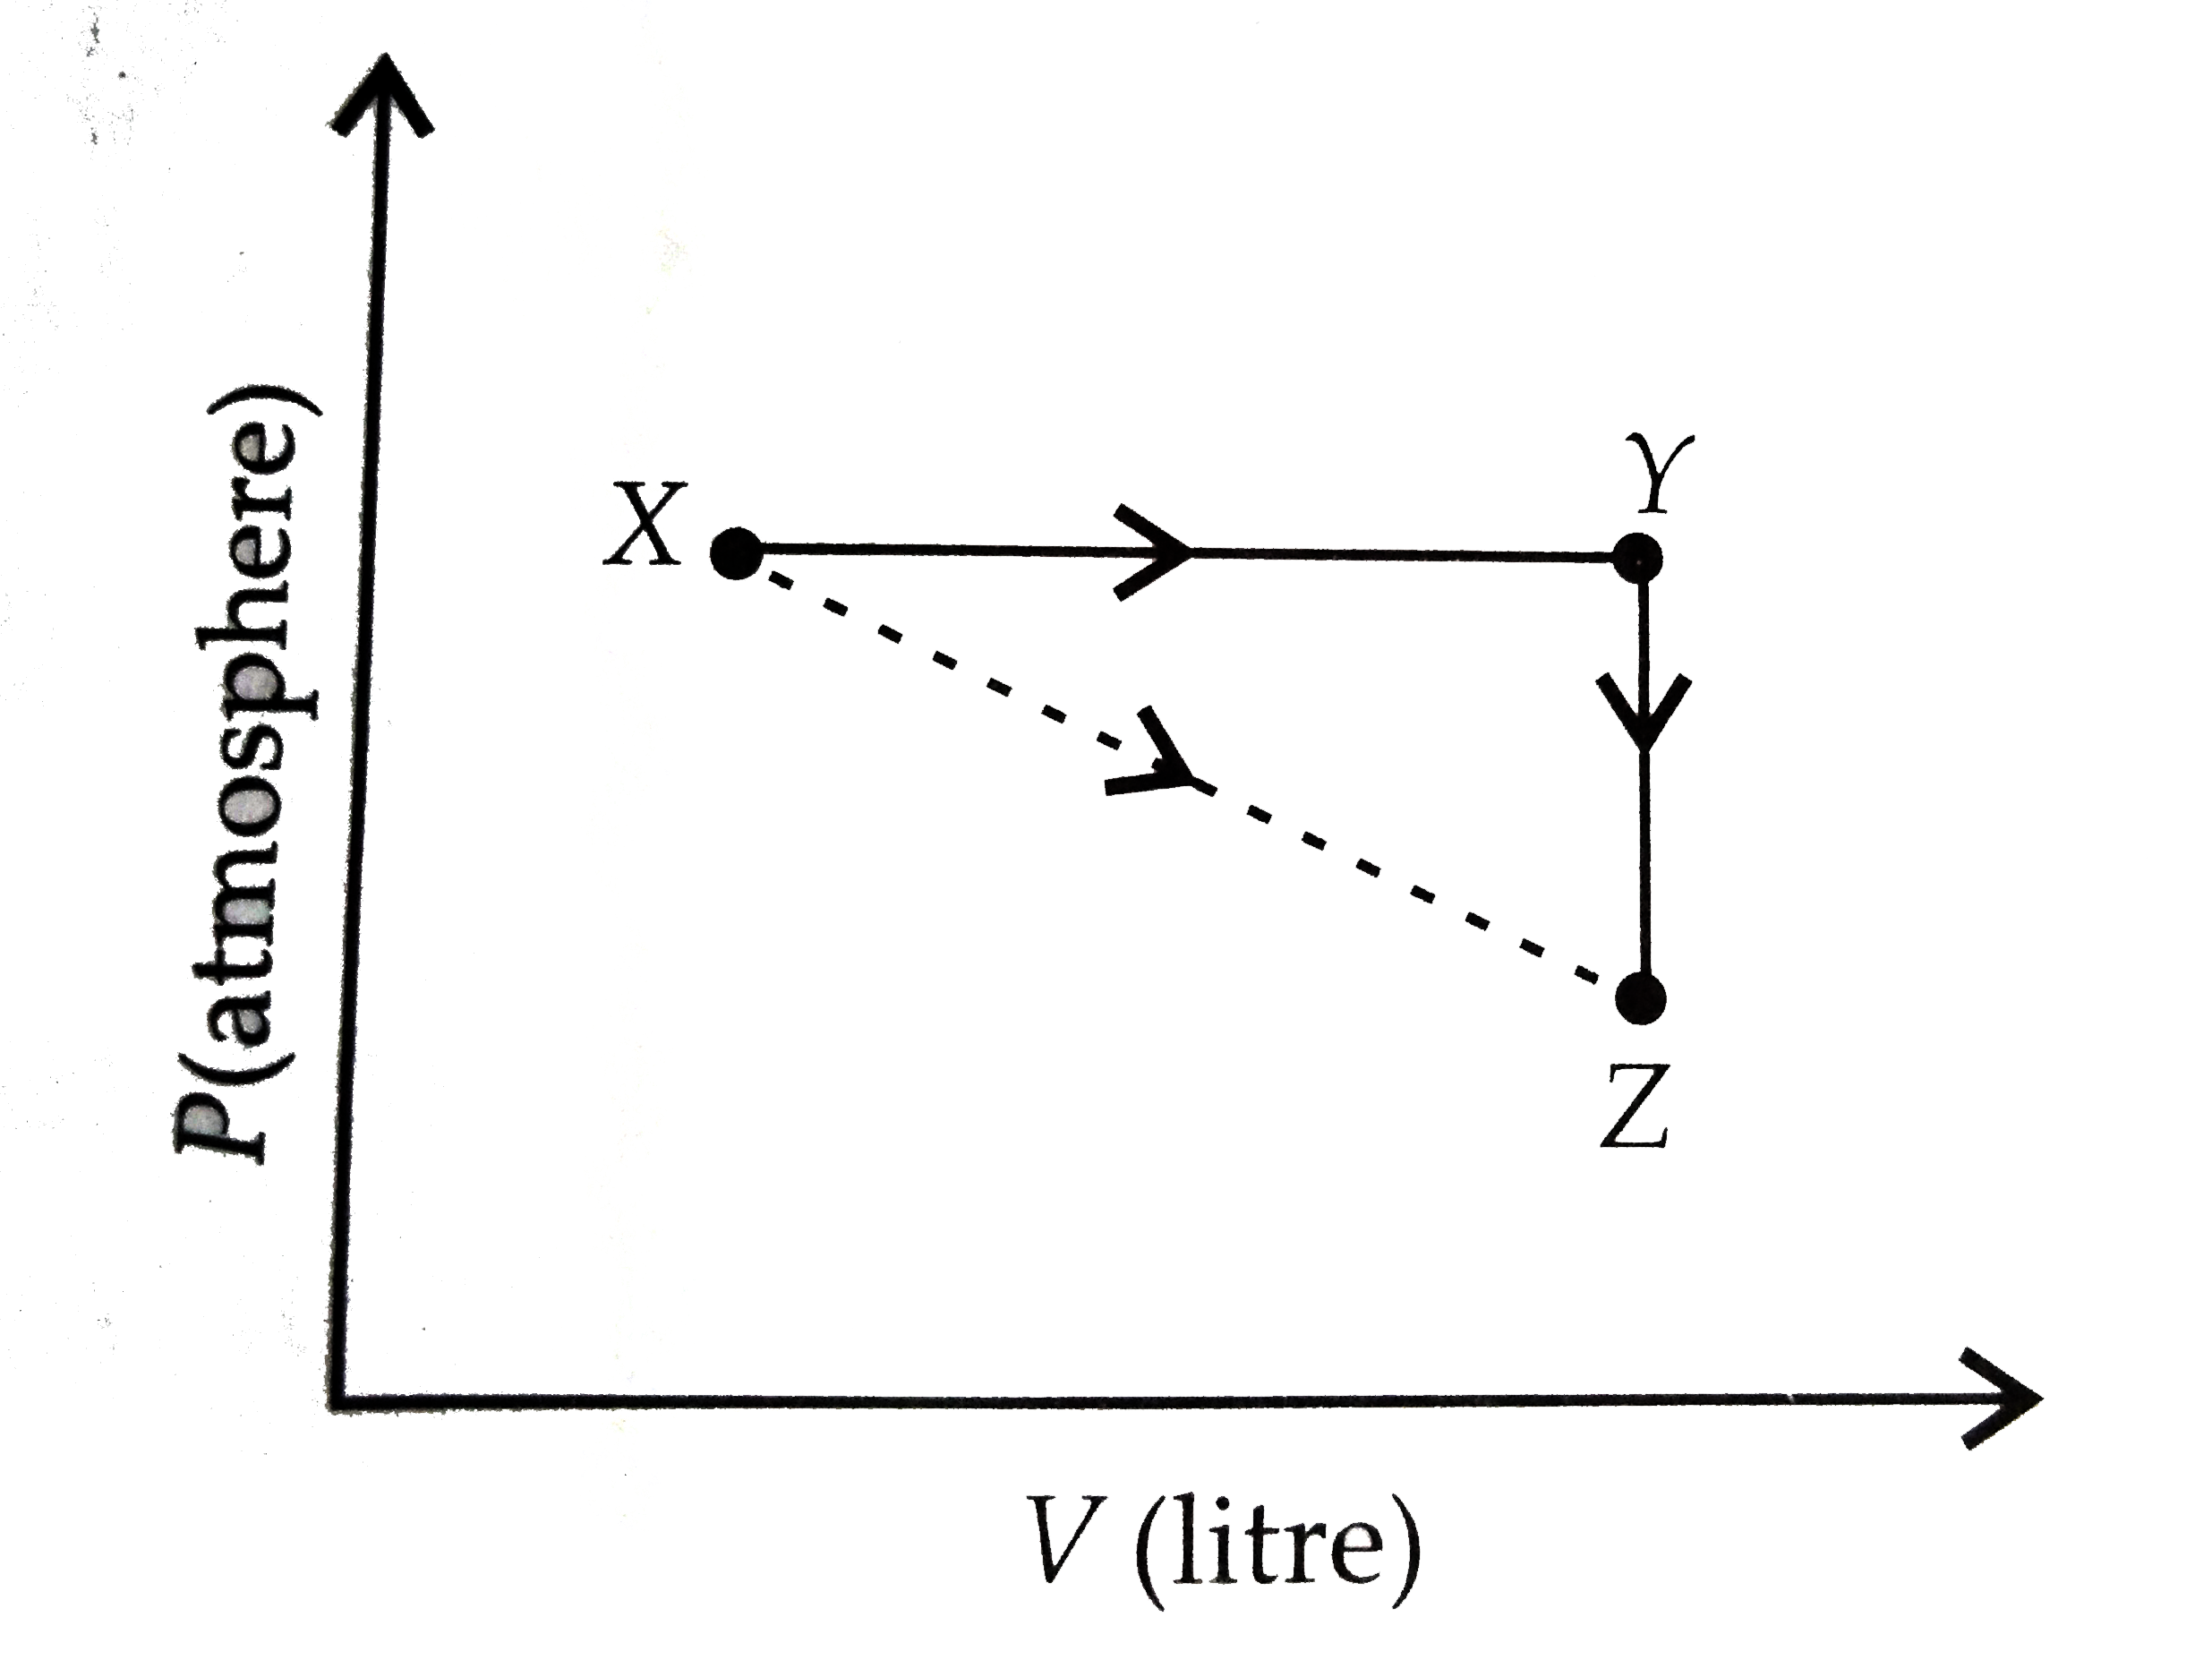
View SolutionFor an ideal gas, consider only P-V work in going from an initial state X to the final state Z. The final state Z can be reached by either of the two paths shown in the figure. Which of the following choice(s) is(are) correct? [Take ΔS as change in entropy and w as work done]
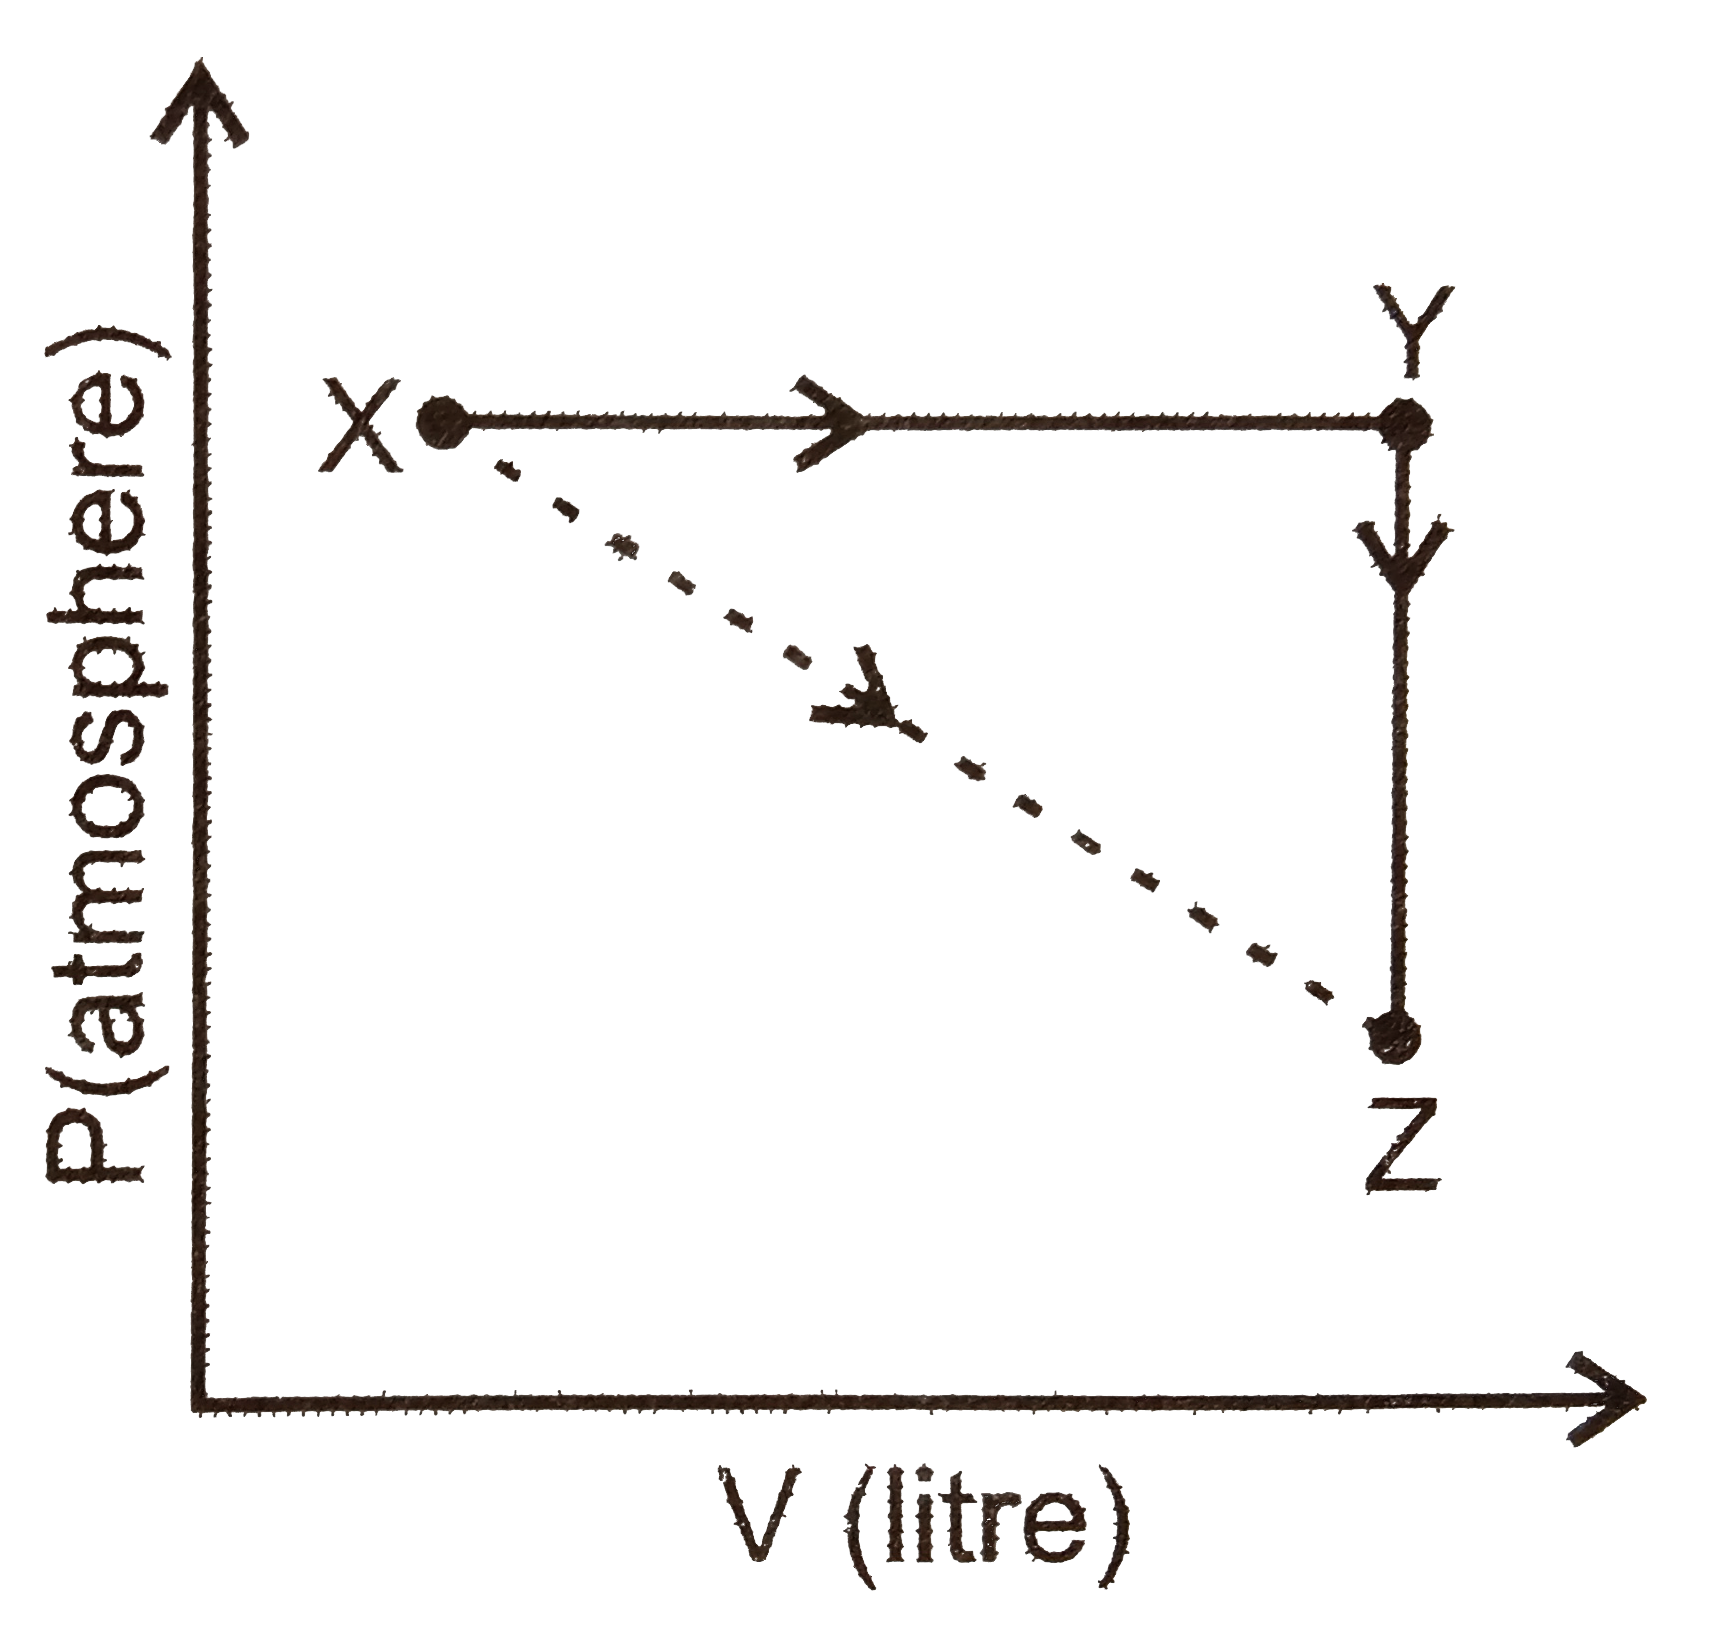
View SolutionFor an ideal gas, consider only P−V work in going from an initial state X to the final state Z. The final state Z can be reached by either of the two paths shown in the figure. Which of the following choice(s) is (are) correct? [Take ΔS as change in entropy and w as work done]
View SolutionWhen a sample of ideal gas is changed from an initial state to a final state, various curves can be plotted for the process like P-V curve, V-T curve,P-T curve etc.
For example, P-V curve for a fixed amount of an ideal gas at constant temperature is a rectangular hyperbola, V-T curve for a fixed amount of an ideal gas at constant volume is again a straight line. However, the shapes may vary if the constant parameters are also changed.
Now, answer the following questions :
Which of the following graphs is not possible for a fixed amount of ideal gas upon moving from initial state A to final state B :
View SolutionCan we use Boyle's law to calculate the volume of a real gas from its initial state to final state during adiabatic expansion?
View Solution
