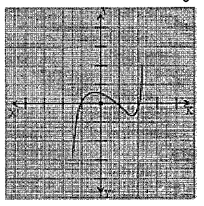
Look at the graphs in the fiures given below. Each is the graph of y - p(x), where p(x) is a polynomial. In each of the graphs, find the number of zeroes of p(x) in the given range of x.
 Solution in Telugu
Step by step video & image solution for Look at the graphs in the fiures given below. Each is the graph of y - p(x), where p(x) is a polynomial. In each of the graphs, find the number of zeroes of p(x) in the given range of x. by Maths experts to help you in doubts & scoring excellent marks in Class 10 exams.
Updated on:21/07/2023Topper's Solved these Questions
- POLYNOMIALSBOOK - BEYOND PUBLICATIONCHAPTER - POLYNOMIALSEXERCISE - EXERCISE
56 Videos
- PAIR OF LINEAR EQUATIONS IN TWO VARIABLESBOOK - BEYOND PUBLICATIONCHAPTER - PAIR OF LINEAR EQUATIONS IN TWO VARIABLESEXERCISE - EXERCISE
174 Videos
- PROBABILITYBOOK - BEYOND PUBLICATIONCHAPTER - PROBABILITYEXERCISE - EXERCISE
136 Videos
Similar Questions
If p(x) = 2x5−6x4+3x−8, find
coefficient of x
View SolutionBy comparing the ratios a1a2,b1b2,c1c2, find out whether the represented by the following pairs of linear equations intersect at a point, are parallel or are coincident. 6x-3y+10=0 , 2x-y+9=0.
View SolutionCards marked with numbers 13,14,15…………,60 are placed in a box and mixed throughly. One card is drawn at random from the box. Find the probability that number on the card drawn is
divisible by 5.
View SolutionThe inequation represented by the graph given below is :
View SolutionThe inequation that best describes the graph given below is _________
View SolutionThe inequation that best describes the following graph is _________
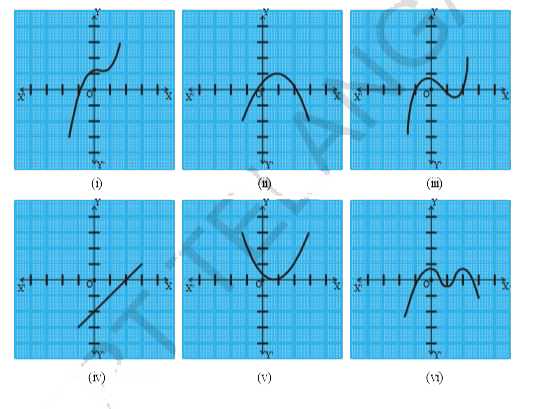
View SolutionLook at the graph in the figures given below. Each is the graph of y = p(x), where p(x) is a polynomial. In each of the graphs, find the number of zeroes of p(x) in the given range of x.
View SolutionLook at graphs in the figures below. Each is the graph of y=p(x), where p(x) is a polynomial. In each of the graphs, find the number of zeroes of p(x) in the given range of x .
View Solutionx3−2x+5 find coefficient of x2,x1,x0.
View SolutionLook at graphs in the figures below. Each is the graph of y=p(x), where p(x) is a polynomial. In each of the graphs, find the number of zeroes of p(x) in the given range of x .
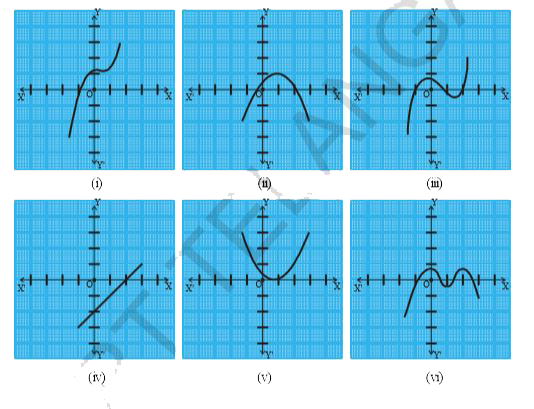
View SolutionLook at the graphs in Figure given below. Each is the graph of y=p(x), where p(x) is a polynomial. For each of the graphs, find the number of zeroes of p(x).
View SolutionLook at the graphs in the figures given below. Each is the graph of y=p(x), where p(x) is a polynomial. For each of the graphs, find the number of zeroes of p(x).
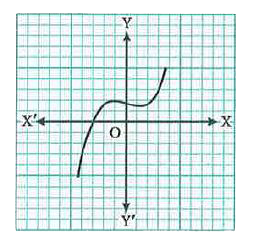
View SolutionLook at the graphs in the figures given below. Each is the graph of y=p(x), where p(x) is a polynomial. For each of the graphs, find the number of zeroes of p(x).
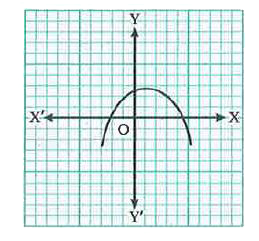
View SolutionLook at the graphs in the figures given below. Each is the graph of y=p(x), where p(x) is a polynomial. For each of the graphs, find the number of zeroes of p(x).
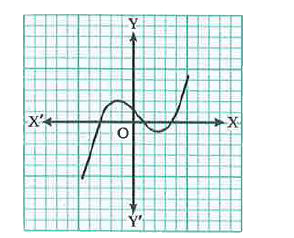
View SolutionLook at the graphs in the figures given below. Each is the graph of y=p(x), where p(x) is a polynomial. For each of the graphs, find the number of zeroes of p(x).
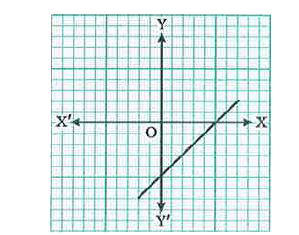
View SolutionLook at the graphs in the figures given below. Each is the graph of y=p(x), where p(x) is a polynomial. For each of the graphs, find the number of zeroes of p(x).
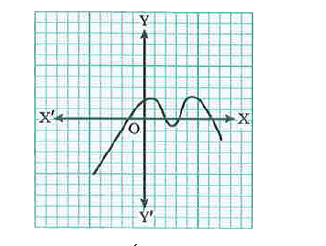
View Solution
