Draw the graph of y=sin2x−cosxSolution in Tamil
Video Solution
Text Solution
Clearly, the domain of the function is R.
Also f(x) is a periodic function is R.
Lets first draw the graph of y=f(x) for 0≤x≤2π.
f(0)=0−1=−1
f(x)=0∴sin2x−cosx=0
or cos2x+cosx−1=0
or cosx=−1±√52
or cosx=−1+√52(∴cosx≠−1−√52(<−1))
Now, f′(x)=0∴sinx(2cosx+1)=0
∴x=π (considering 0<x<2π) or x=(2π/3),4π/3
Now the sign scheme of f′(x) is as follows:

So x=2π/3,4π/3 are the points of maximum and x=π is the point of minima.
f(π)=1,f(2π/3)=f(4π/3)=34+12=54
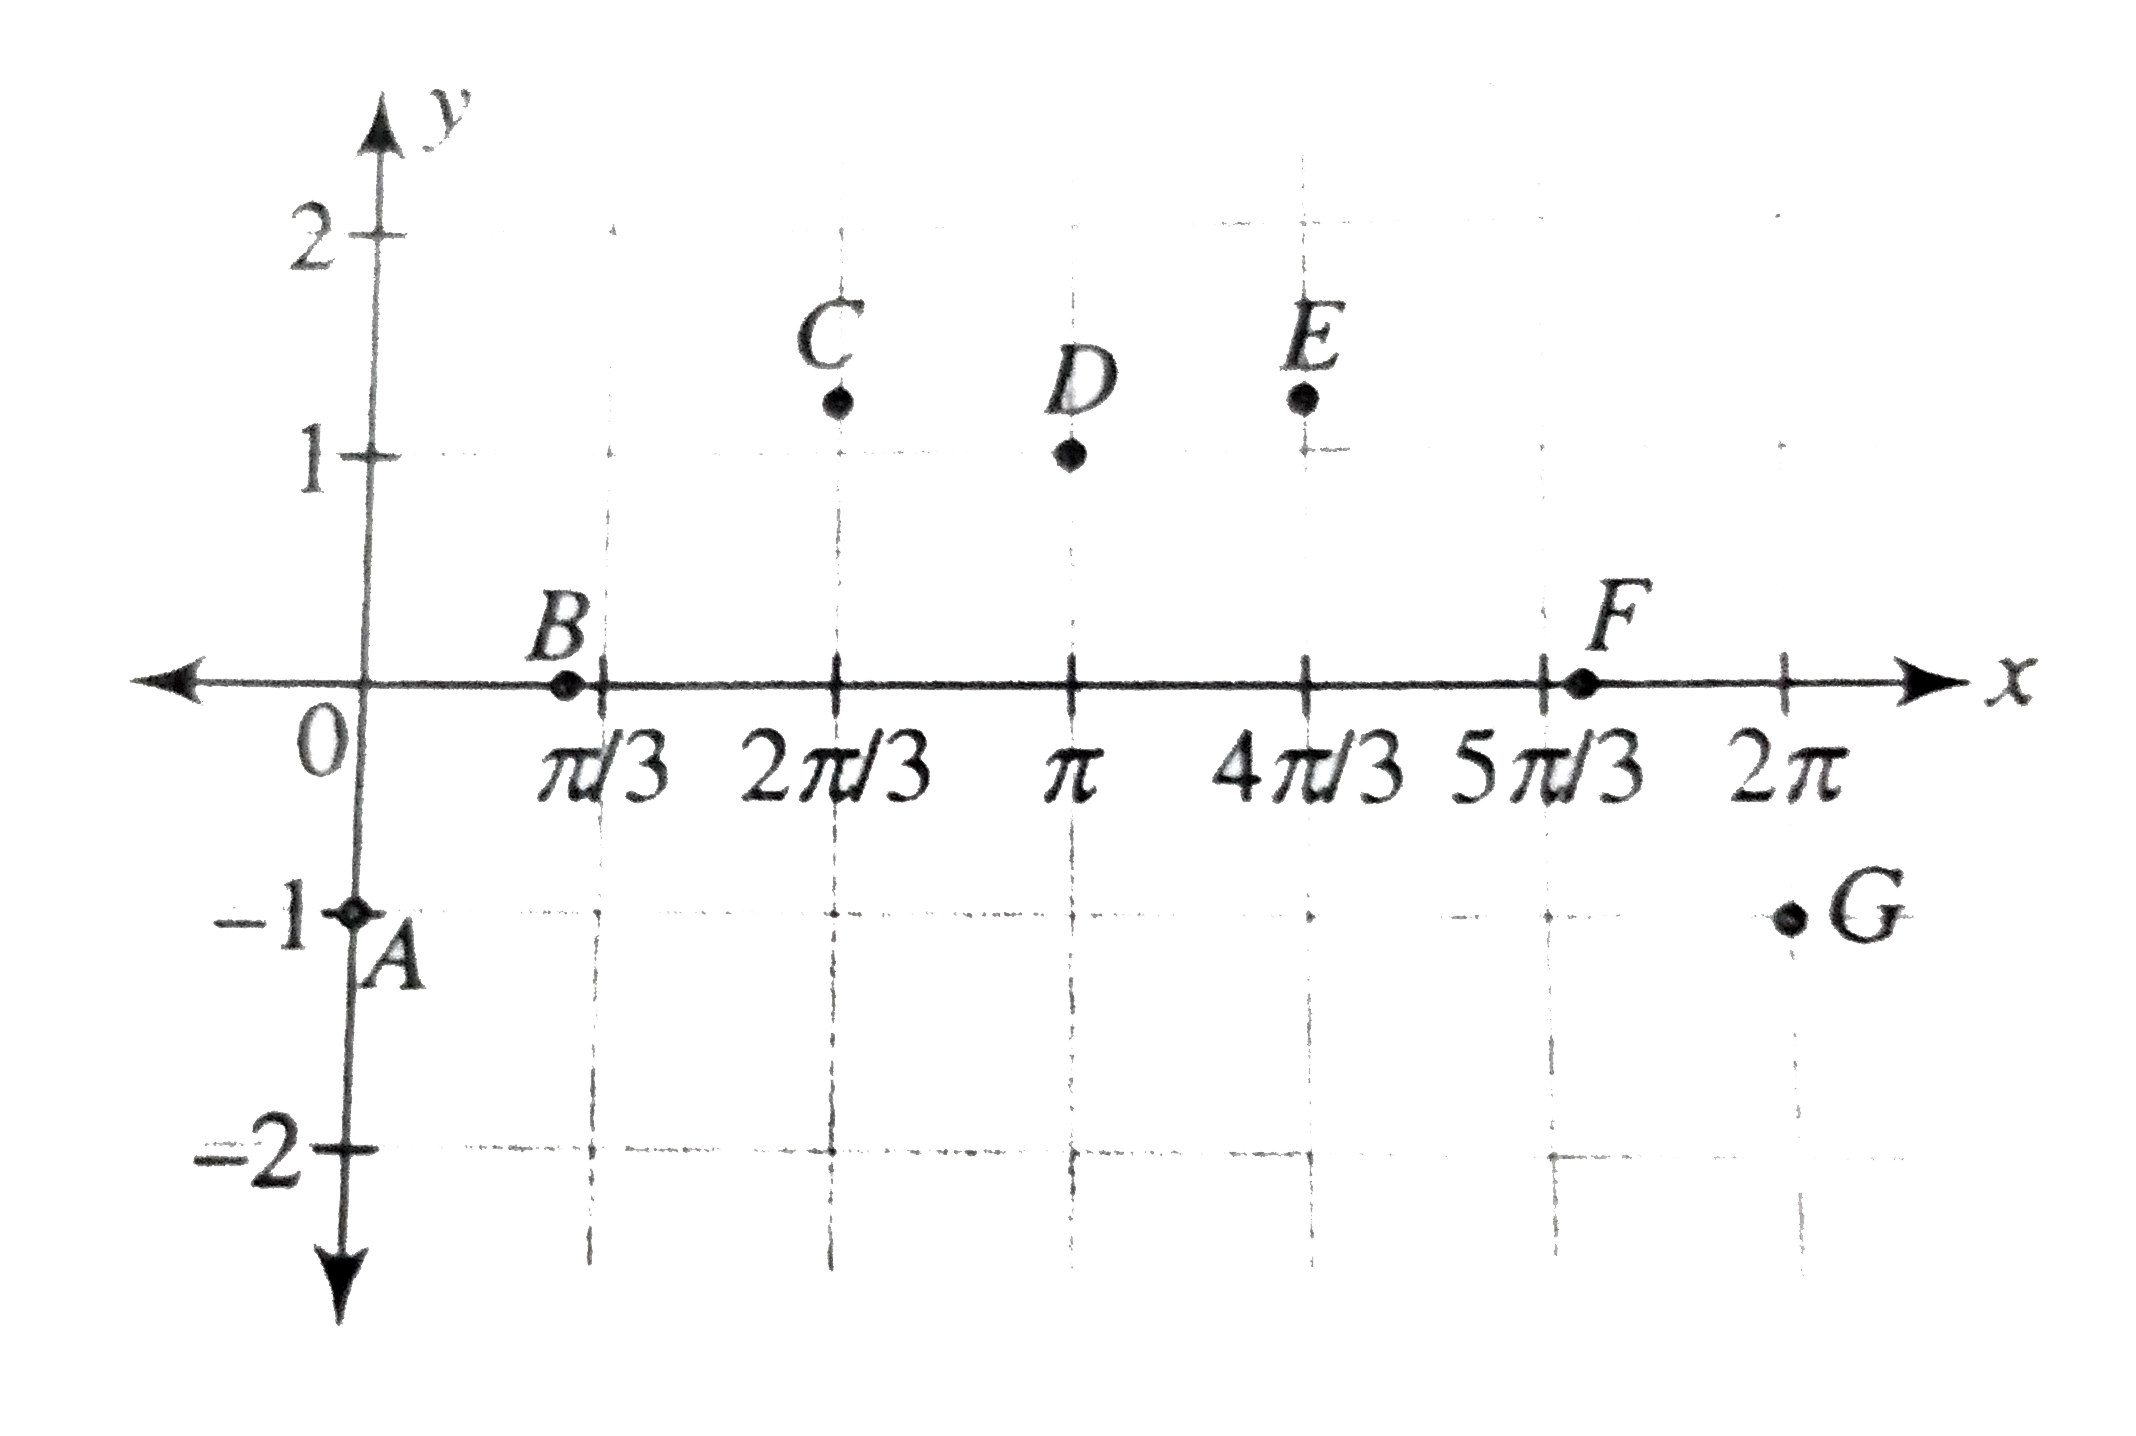
From the above discussion, we have the following important points on graph paper.

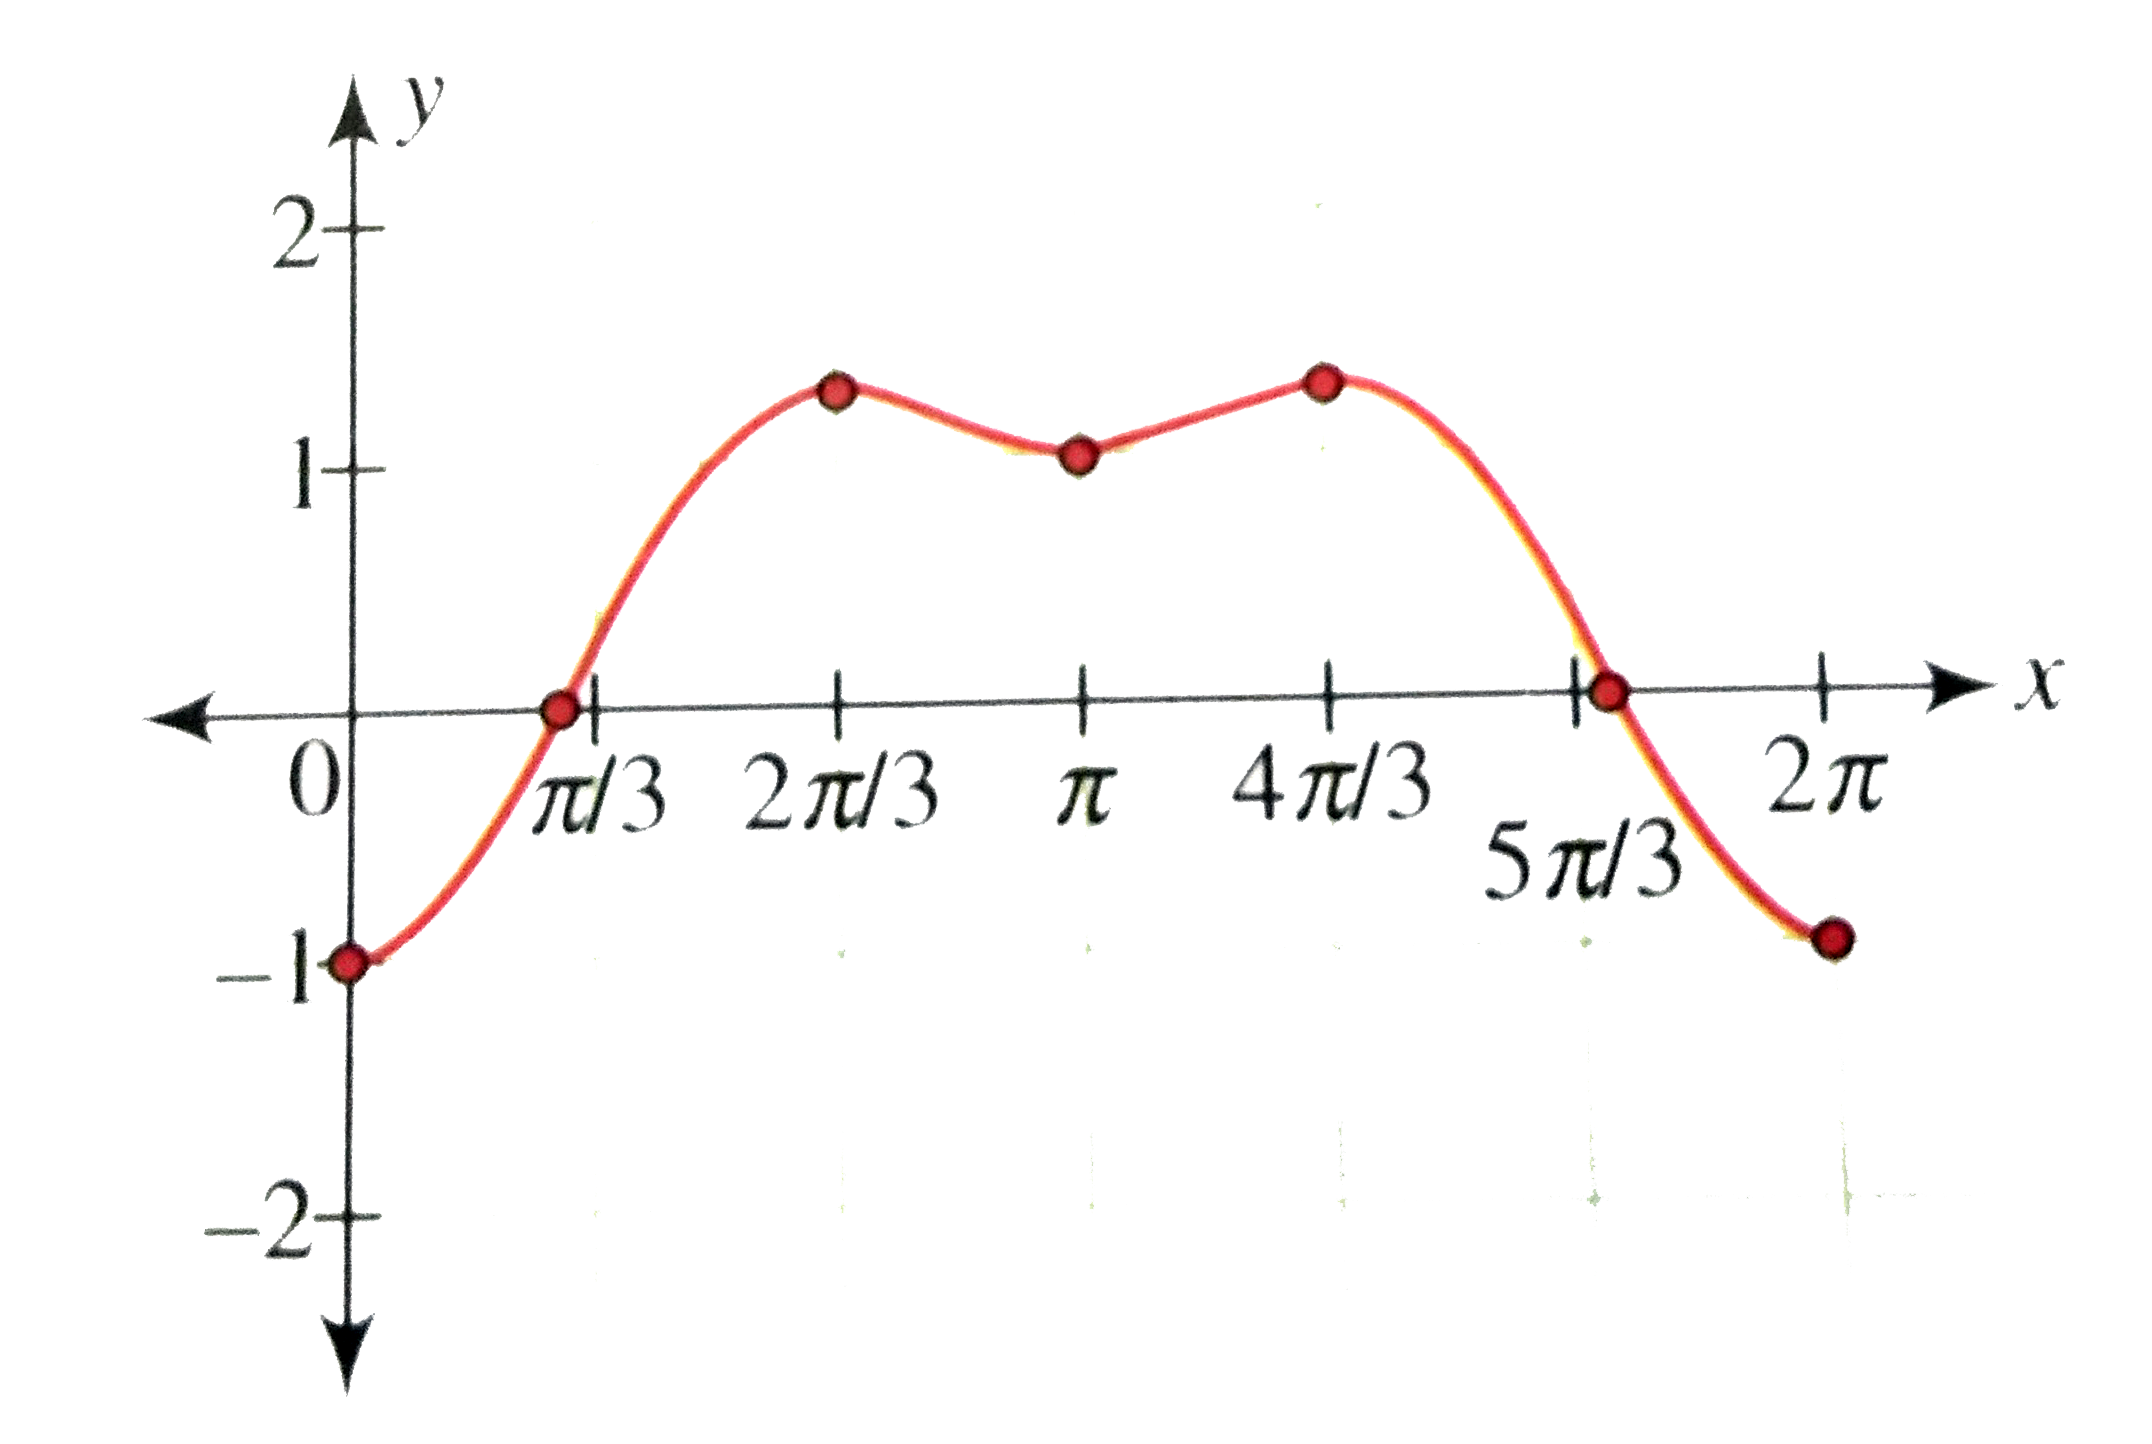
From points A to C, f(x) increases, from C to D, f(x) decreases, from D to E, f(x) increases, from E to G, f(x) decreases.
Hence, the graph of y=f(x) for 0<x<2π is as shown in the following figure.

Now f(x) is periodic with period 2π, repeat the above graph for other intervals as shown in the following figure.

|
Topper's Solved these Questions
Similar Questions
Let →a and →b be two vectors of equal magnitude 5 units. Let →p,→q be vectors such that →p=→a−→b and →q=→a+→b. If |→p×→q|=2{λ−(→a.→b)2}12, then value of λ is
View SolutionSolve: (x+2)3=2x(x2−1)
View SolutionDraw the graph of y=sin−1(cosx).
View SolutionDraw the graph of y=sin2x.
View SolutionDraw the graph y=sin2x.
View SolutionDraw the graph of y=sin−1(x2)
View SolutionDraw the graph of y=sin2x−cosx
View SolutionDraw the graph of y=sinx and y=sin.x2.
View SolutionDraw the graph of y=sinx and y=cosx,0≤x≤2π
View SolutionDraw the graph of y=sin−1(cosx).
View SolutionDraw the graph y=sin2x.
View SolutionDraw the graph of y=sin2x−cosx
View SolutionDraw the graph of y=sinx and y=sin.x2.
View SolutionDraw the graph of y=sinx and y=cosx,0≤x≤2π
View SolutionDraw the graph of y=sin^(-1)(cosx) .
View Solution
