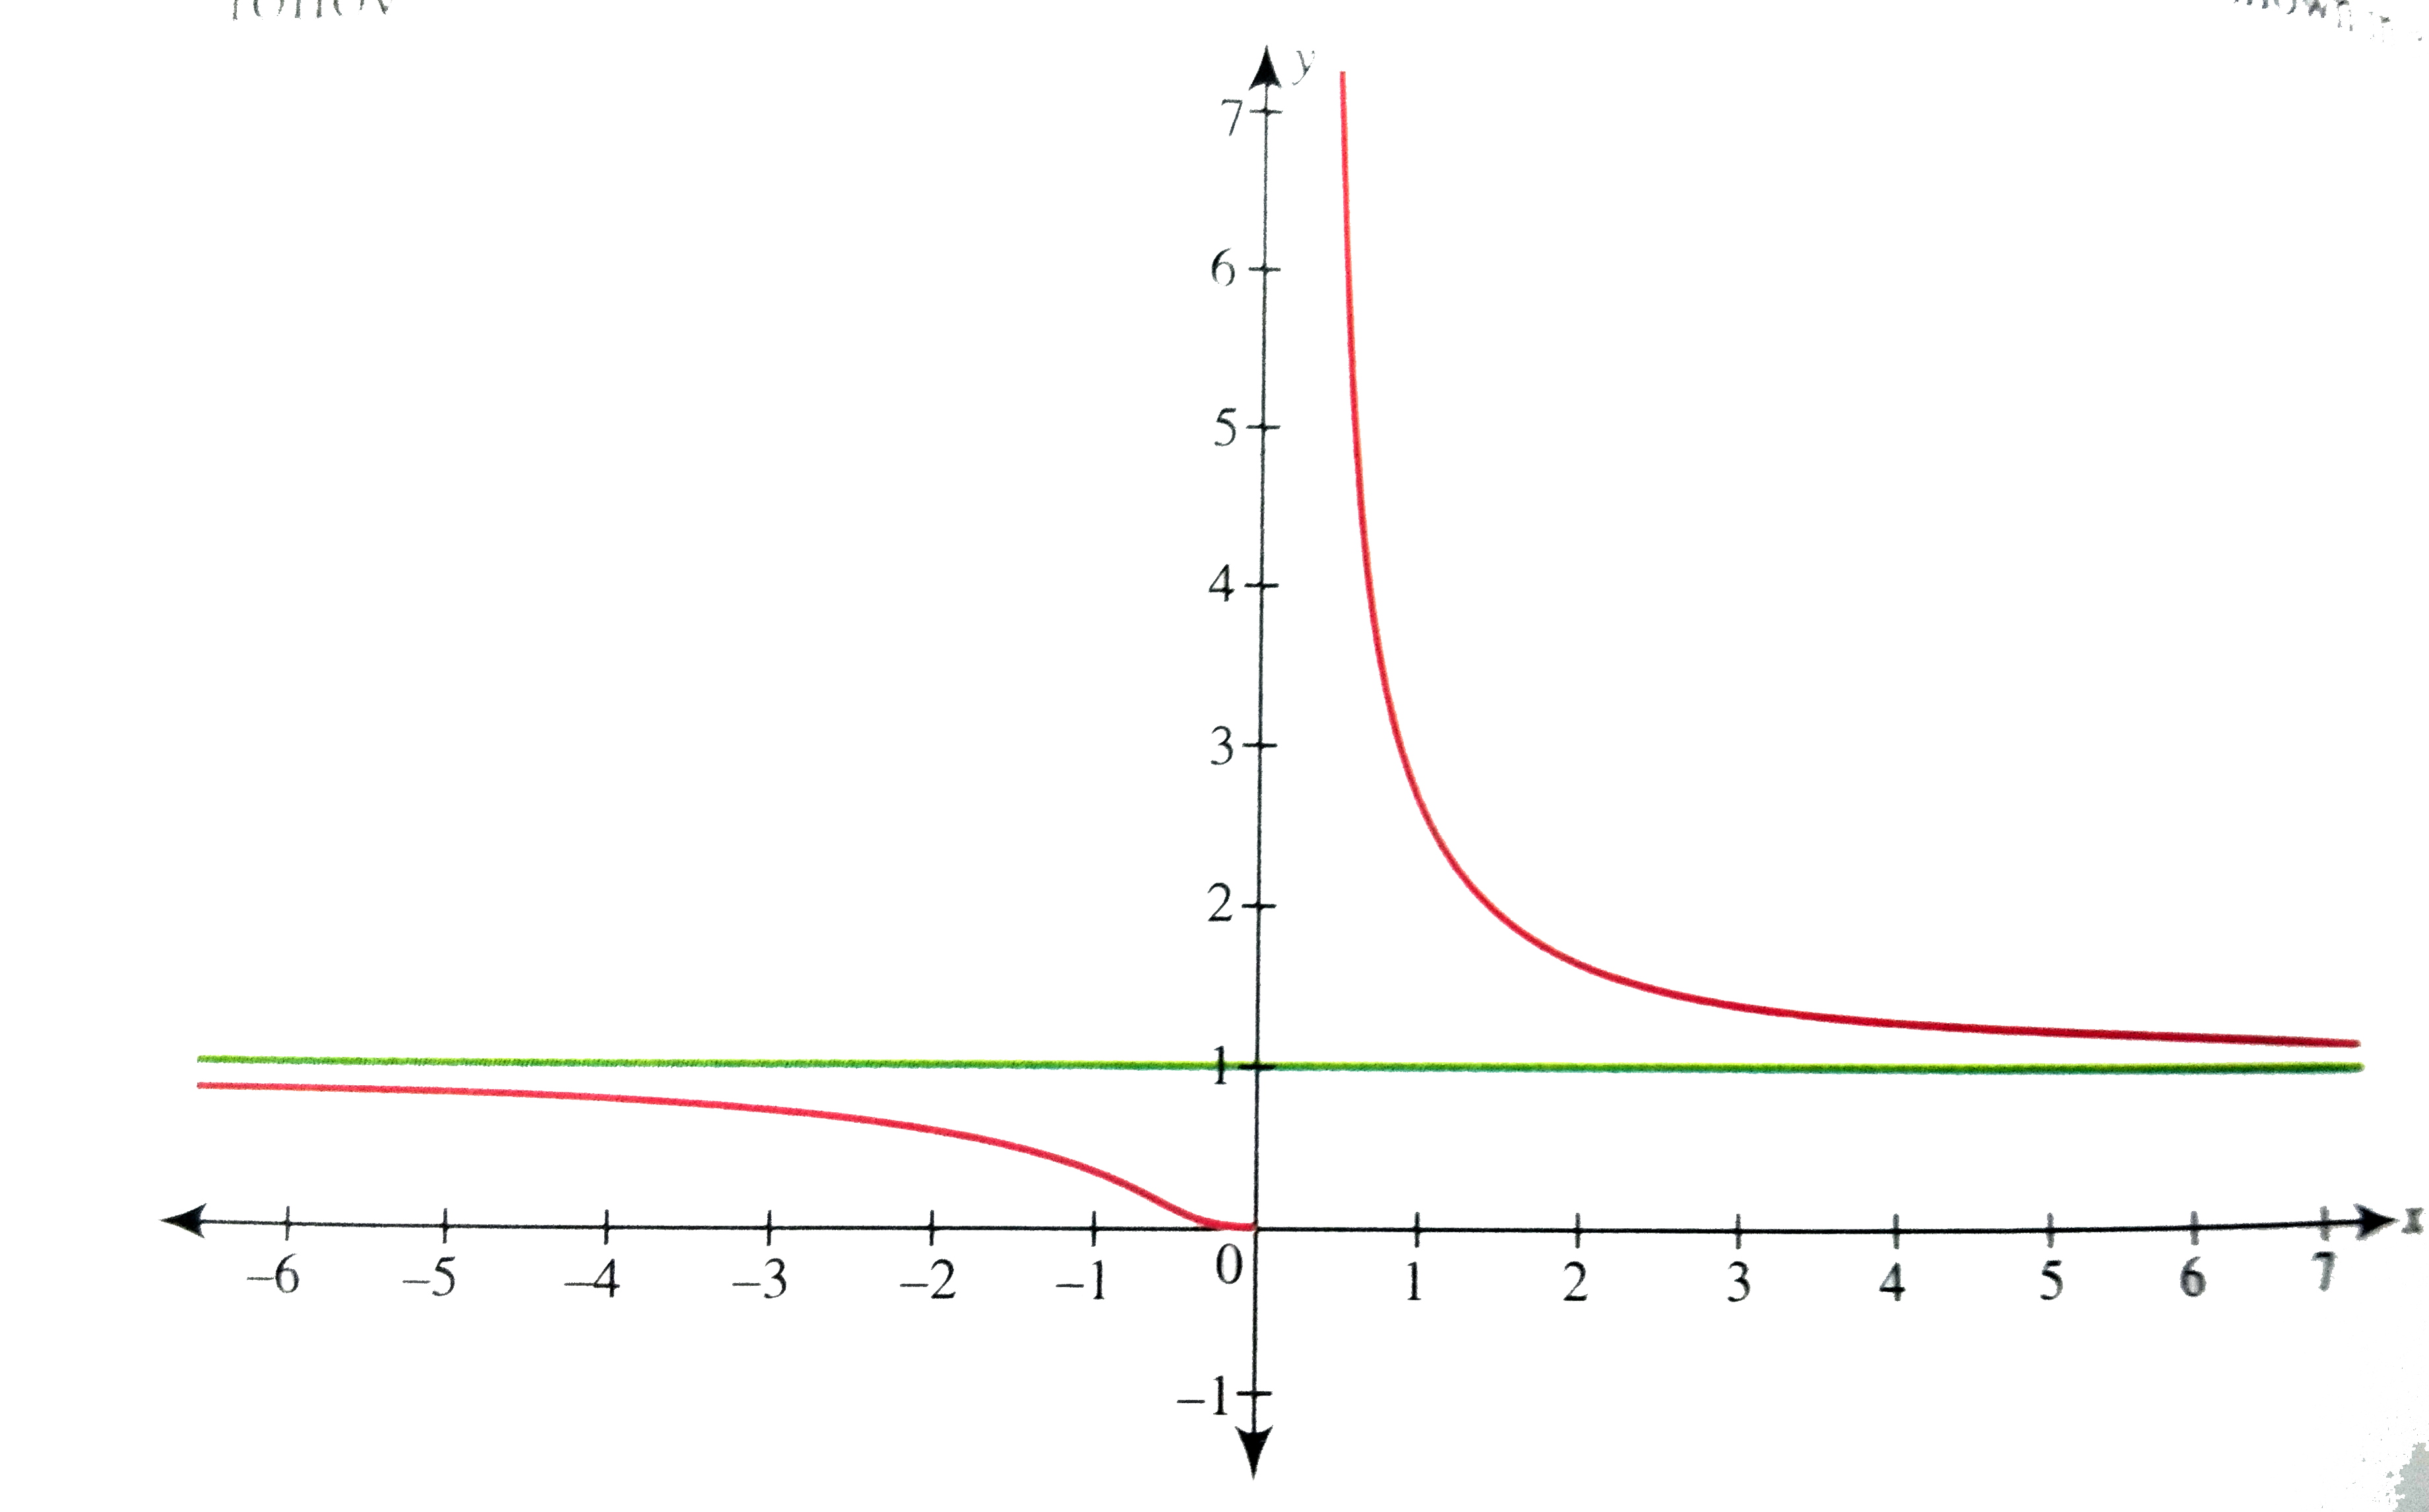
Draw and discuss the graph of the function f(x)=e1/xSolution in Tamil
We have f(x)=e1/x
Clearly, the domain of function is R−{0}
Also e1/x>0, hence the graph of the function lies above the x-axis.
limx→0+e1x=e∞=∞ and limx→0−e1x=e−∞=0
limx→±∞e1x=e0=1
f′(x)=e1x(−1x2)<0. Hence, f(x) is a decreasing function in the domain.
From the above discussion, the graph of y=f(x) can be drawn as shown in the following figure.

As shown in the figure, y=1 is an asymptote.
Topper's Solved these Questions
Similar Questions
Draw the graph of y=sin2x−cosx
02:32View SolutionLet →a and →b be two vectors of equal magnitude 5 units. Let →p,→q be vectors such that →p=→a−→b and →q=→a+→b. If |→p×→q|=2{λ−(→a.→b)2}12, then value of λ is
View SolutionSolve: (x+2)3=2x(x2−1)
02:30View SolutionDraw the graph of the function f(x)=x-|x-x^(2)|,-1<=x<=1 and discuss the continuity or discontinuity of f in the interval -1<=x<=1
02:54View SolutionDraw the graph of the function f(x)=2x2−loge|x|
02:50View SolutionDraw and discuss the graph of f(x)=x+√x−1
05:09View SolutionDraw and discuss the graph of the function f(x)=e1/x
07:03View SolutionDraw the graph of f(x)=e−x2. Discuss the concavity of the graph.
02:34View SolutionDraw the rough sketch of the graph and discuss the continuity of the function f(x)=|x−1|+|x−2|.
03:20View SolutionDraw the graph of the function, f(x)=1x.
05:15View SolutionDraw the graph of the function, f(x)=ex.
02:52View SolutionDraw the graph of the function, f(x)=logex(x>0).
02:44View SolutionDraw the graph of the function f(x)=2x2−loge|x|
03:13View SolutionDraw and discuss the graph of f(x)=x+√x−1
02:31View SolutionDraw and discuss the graph of the function f(x)=e1/x
05:06View SolutionDraw the graph of f(x)=e−x2. Discuss the concavity of the graph.
04:17View Solution

