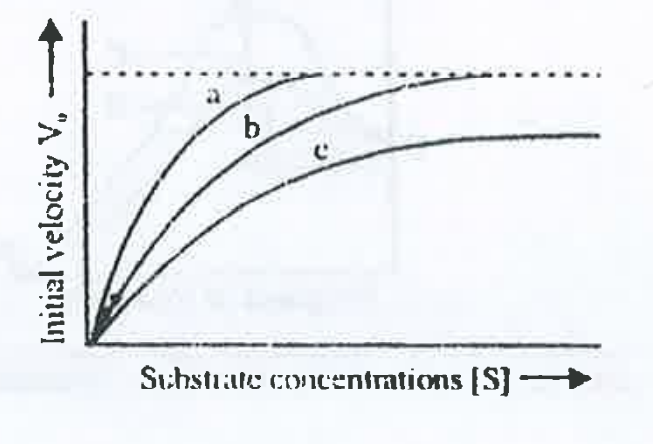
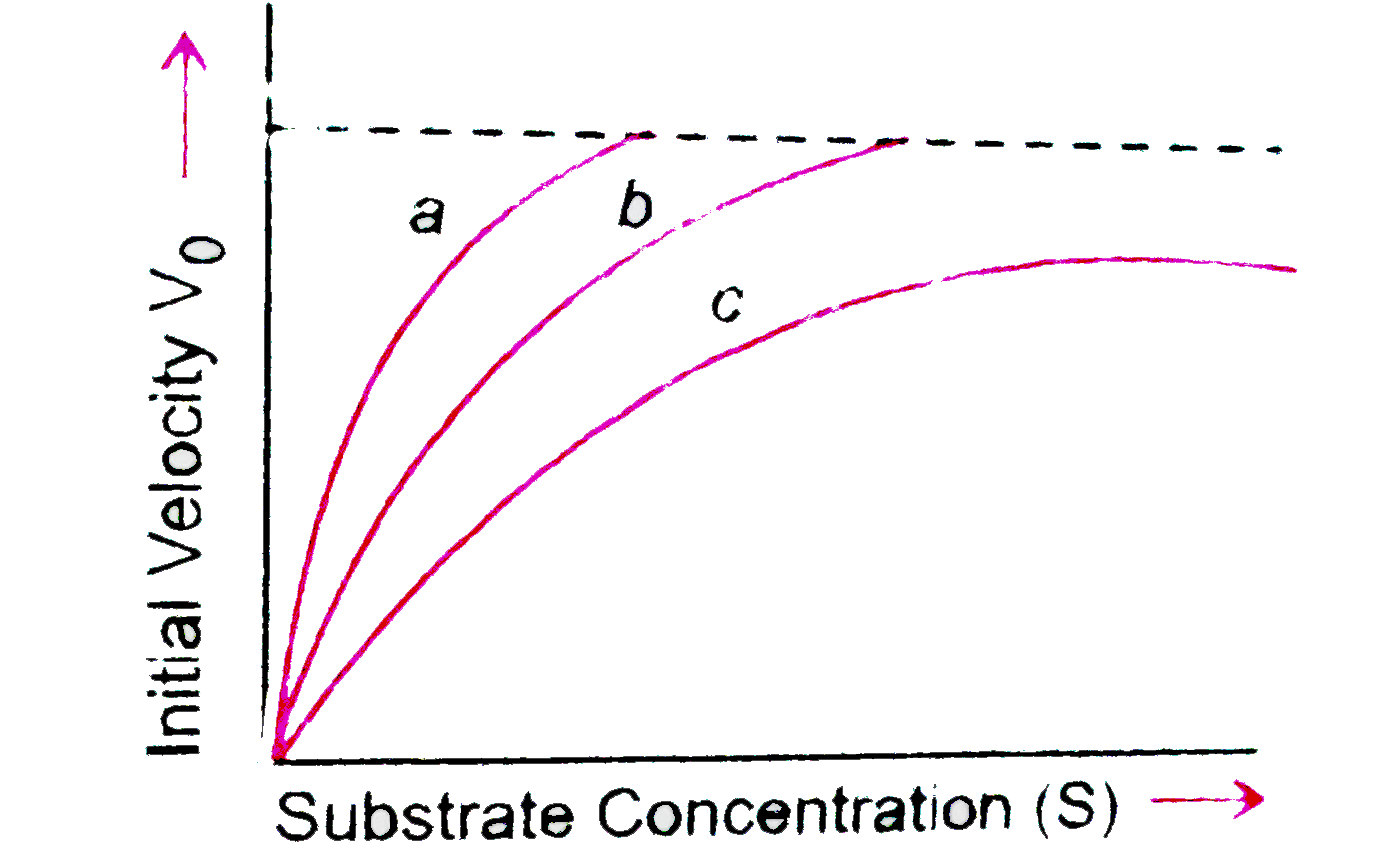
The figure given below shows three velocity -substrate concentration curves for an enzyme reaction. What do the curves a,b and c depit respectively ?
 Solution in Kannada
a-normal enzyme reaction, b-competitive inhibtion, c-non-competitive inhibition .
a-enzyme with an allosteric modulator added, b-normal enzyme activity, c-competitive inhibition .
a-enzyme with an allosteric stimulator, b-competitive inhibition added, c-normal enzyme reaction
a-normal enzyme reaction, b-non-copetitive inhibitor added, c-allosteric inhibitior added
The correct Answer is:A
Step by step video & image solution for The figure given below shows three velocity -substrate concentration curves for an enzyme reaction. What do the curves a,b and c depit respectively ? by Biology experts to help you in doubts & scoring excellent marks in Class 11 exams.
Updated on:21/07/2023Topper's Solved these Questions
- ANIMAL TISSUES BOOK - TRUEMAN BIOLOGYCHAPTER - ANIMAL TISSUES EXERCISE - MULTIPLE CHOICE QUESTIONS
194 Videos
- CELL- THE BASIC UNIT OF LIFE ( CELL AND ITS STRUCTURAL ORGANISATION )BOOK - TRUEMAN BIOLOGYCHAPTER - CELL- THE BASIC UNIT OF LIFE ( CELL AND ITS STRUCTURAL ORGANISATION )EXERCISE - MULTIPLE CHOICE ANSWER TYPE
311 Videos
Similar Questions
Who established Histology as a separate
branch of Zoology ?
View SolutionAn example of enucleated living plant cell is
View SolutionFigure given below shows three velocity-substrate concentration curves for an enzyme reaxtion. What do the curves for an enzyme reaction. What do the curves depict
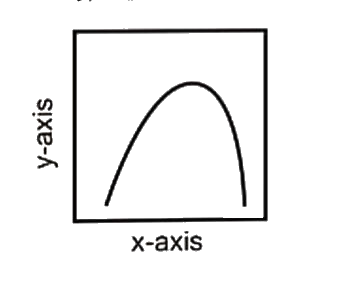
View Solutionthe curve given below shows wnzymatic acitvity with relation to three conditions (pH , temperature and substrate concentration ).
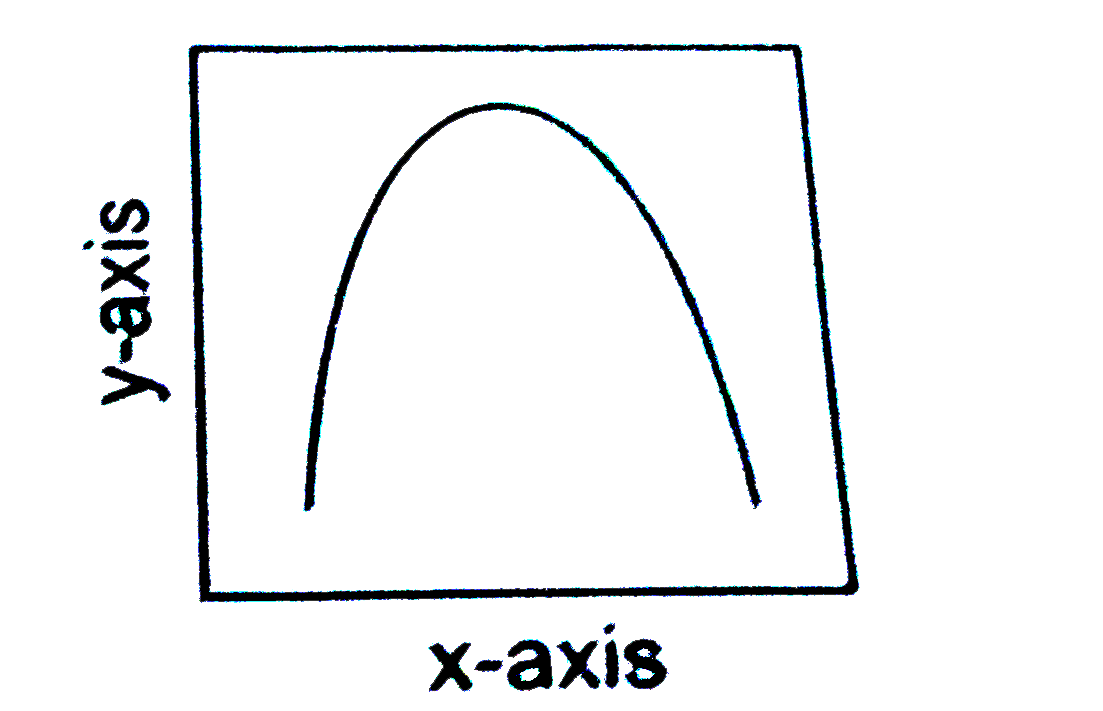
what do the two axes ( x and y) represent ?
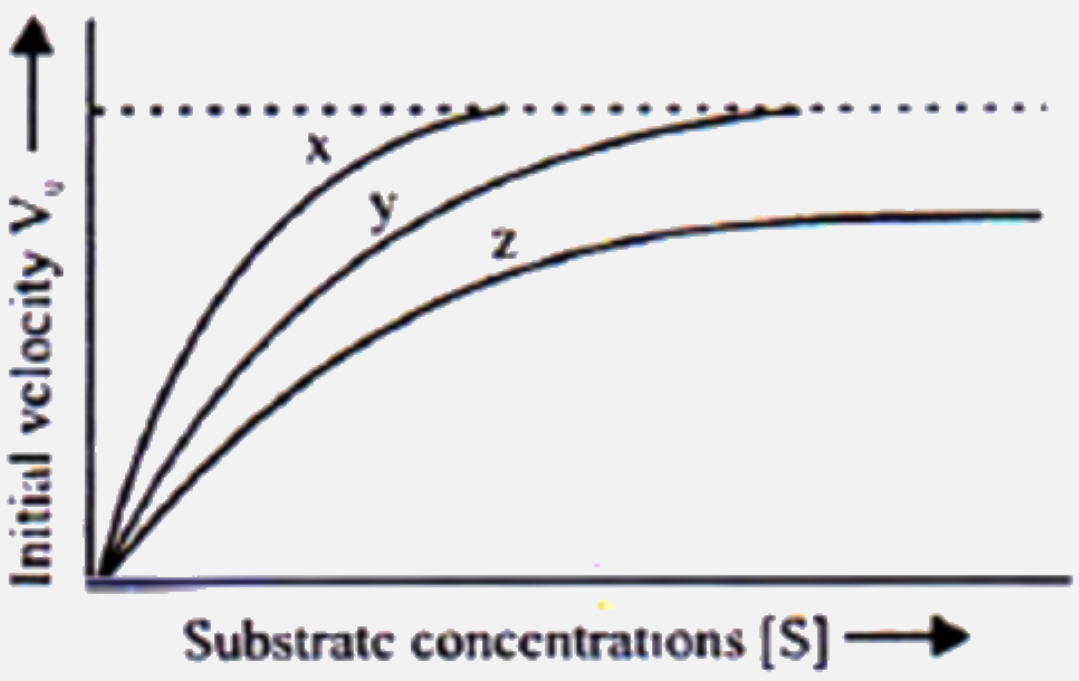
View SolutionThe Given figure shows three velocity-substrate concentration curves of an enzyme reaction. What do the curves X Y and Z depict respectively ?
View SolutionThree velocity base concentrations are given in the figure below for an enzyme reaction. What is known from the curves a, b and c respectively
View SolutionThe shape of the curve obtained when substrate concentration is plotted against velocity of reaction
View Solutionनीचे दिखाये गये वक्र में तीन दशाओं (pH, तापमान तथा क्रियाधार सांद्रण) के संबंध के साथ एंजाइम-क्रिया दर्शायी गयी है। इसमें दो अक्षा (x तथा y) क्या दर्शाते हैं ?
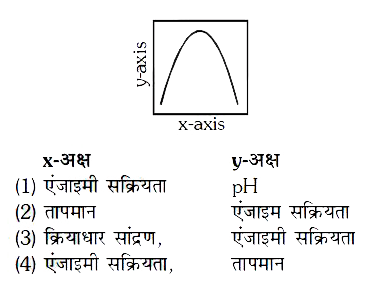
View SolutionThe curve given below show enzymatic activity with relation to three conditions (pH, temperature and substrate concentration)
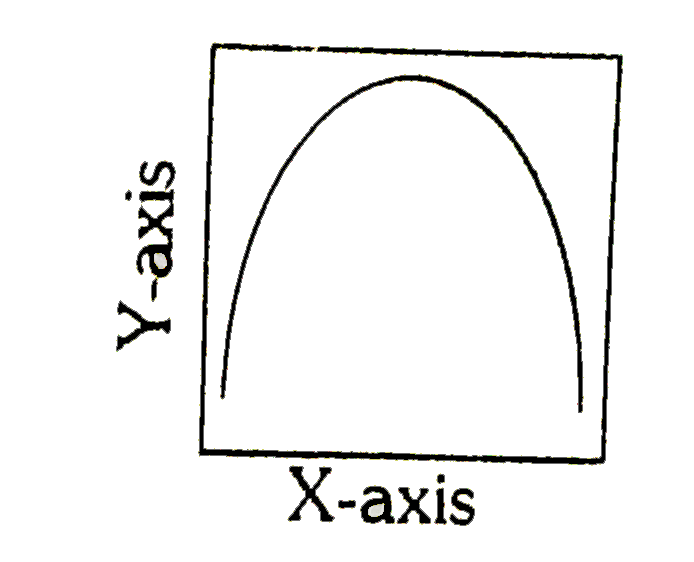
What do the two axises (x and y) represent
View Solutionthe curve given below shows wnzymatic acitvity with relation to three conditions (pH , temperature and substrate concentration ).

what do the two axes ( x and y) represent ?
View SolutionThe given figure shows three velocity-substrate concentration curves for an enzyme reaction. What do the curves x, y and z depict respectively?
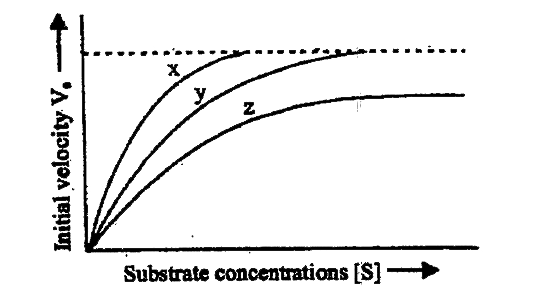
View SolutionFigure given below shows three velocity-substrate concentration curves for an enzyme reaxtion. What do the curves for an enzyme reaction. What do the curves depict
View SolutionThe Given figure shows three velocity-substrate concentration curves of an enzyme reaction. What do the curves X Y and Z depict respectively ?
View SolutionThe curve given below shows enzymatic activity with relation to three conditions (pH, temperature and substrate concentration). What does the two axis (x and y) represent ?
View SolutionThe figure given below shows three velocity -substrate concentration curves for an enzyme reaction. What do the curves a,b and c depit respectively ?

View Solution
