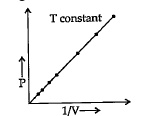
With the help of graph answer the following At constant temperature

Graph shows relation between pressure and volume Represent the relation mathematically.Solution in Marathi
Step by step video & image solution for With the help of graph answer the following At constant temperature Graph shows relation between pressure and volume Represent the relation mathematically. by Chemistry experts to help you in doubts & scoring excellent marks in Class 11 exams.
Updated on:21/07/2023Similar Questions
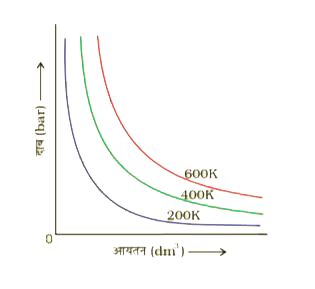
विभिन्न तापमानों पर आयतन के साथ दाब में परिवर्तन को चित्र 5.3 में दिए ग्राफ द्वारा दर्शाया जा सकता है|
इस ग्राफ़ के आधार पर निम्नलिखित प्रश्नों के उत्तर दीजिए -
(i) स्थिर ताप पर, दाब बढ़ाने से गैस का आयतन किस प्रकार परिवर्तित होगा?
(ii) स्थिर दाब पर ताप को 200K से 400K बढ़ाने पर गैस का आयतन किस प्रकार परिवर्तित होगा?

View SolutionWhat is the relation between pressure and temperature of a gas at constant volume ?
View SolutionWhat is the shape of graph between volume and temperature, if pressure is kept constant?
View SolutionDraw a graph showing the relationship between volume and temperature of an ideal gas at a constant pressure.
View SolutionExplain the relation between pressure & volume of a gas-when the temperature is kept constant.
View SolutionExplain the relation between temperature and volume of gas- when the pressure is kept constant.
View SolutionDraw a graph showing the relation between resistivity and temperature of a super conductor.
View Solution
