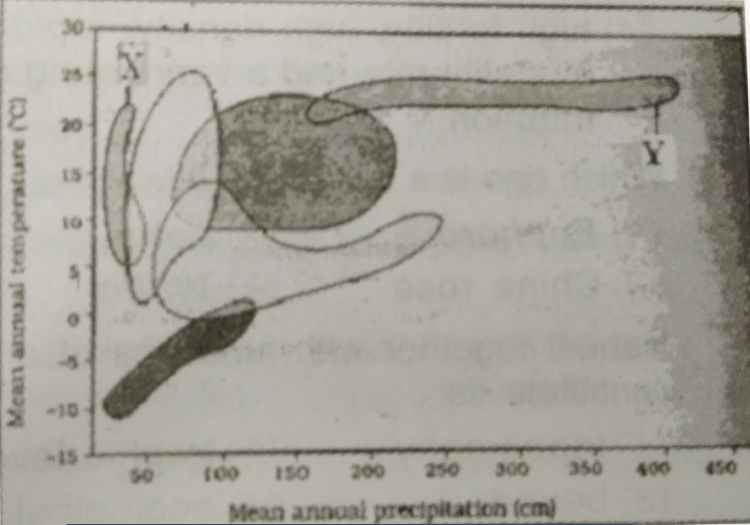
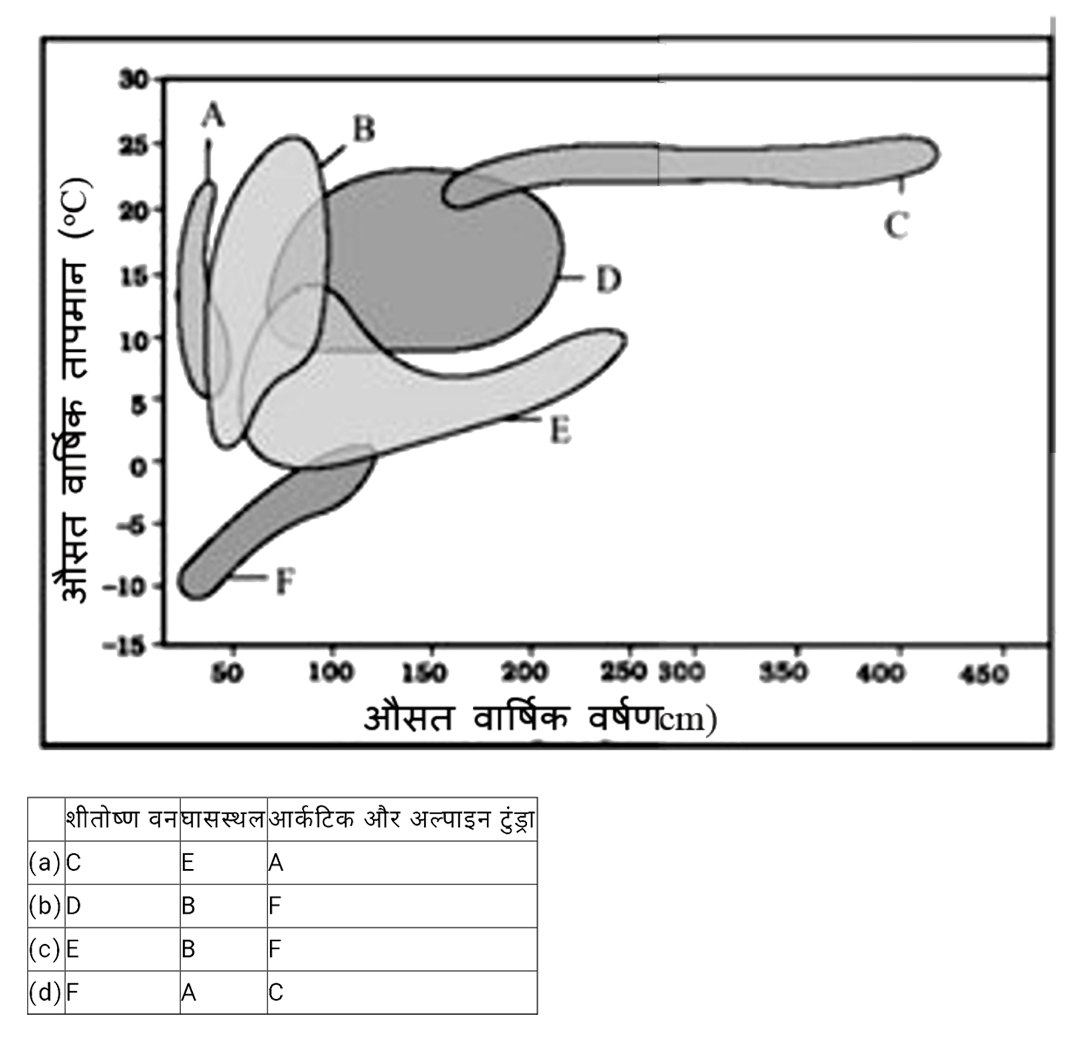
The given figure shows biome distribution with respect to temperature and precipitation. The option which correctly identifies the biomes marked X and Y respectively is.
 Solution in Bengali
Coniferous forest, Temperature forest
Tundra , Temperature forest
Desert, Tropical forest
Grassland , Coniferous forest
The correct Answer is:C
Step by step video & image solution for The given figure shows biome distribution with respect to temperature and precipitation. The option which correctly identifies the biomes marked X and Y respectively is. by Biology experts to help you in doubts & scoring excellent marks in Class 12 exams.
Updated on:21/07/2023Topper's Solved these Questions
Similar Questions
Cluster of neuron cell bodies within peripheral nervous system are:
1. Nuclei
2. Ganglia
3. Laminae
4. Fascicles
View SolutionAbscisic acid is synthesized more abundantly in
View SolutionBiome distribution with respect to annual temperature and precipitation is given below. Identify grassland and coniferous forest by selecting the correct option:
View SolutionWhich biome shows maximum range of annual precipitation and maximum range of annual temperature respectively ?
View SolutionThe graph given below is showing biome distribution with respect to annual temperature and precipitation. Identify A, B and C, respectively.
View SolutionIn the given diagram , Biome distribution is shown with respect to annual temperatrue and precipitation. Select the correct option.
View SolutionBiome distribution with respect to annual temperature and precipitation is given below. Identify grassland and coniferous forest by selecting the CORRECT option .
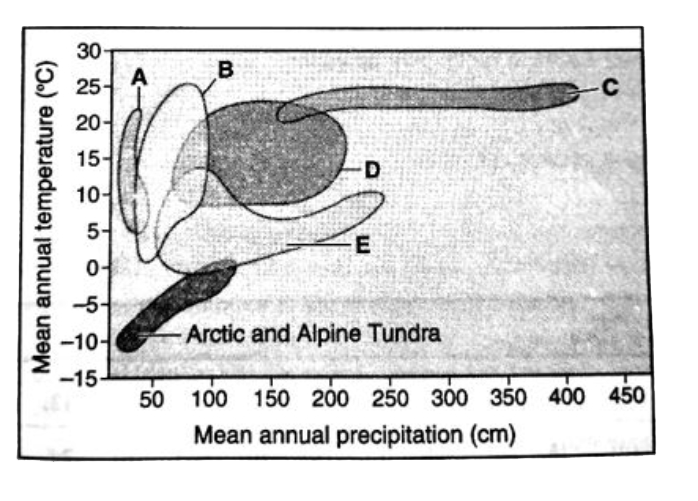
View Solution(a) Explain how Mediterranean orchids achieve pollination. (b) Draw a graph showing biome distribution with respect to annual temperature and precipitation.
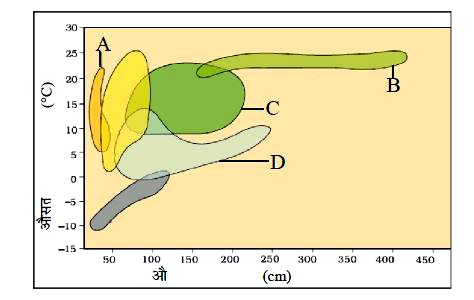
View Solutionनीचे दिये गये चित्र में जीवोम/बायोम को पहचानिए :
View SolutionThe given figure shows biome distribution with respect to temperature and precipitation. The option which correctly identifies the biomes marked X and Y respectively is.
View SolutionWhich of the following biomes has low temperature and low precipitation?
View SolutionThe graph given below shows the distribution of biomes:
(a)What do the 'X' and 'Y' axis represent?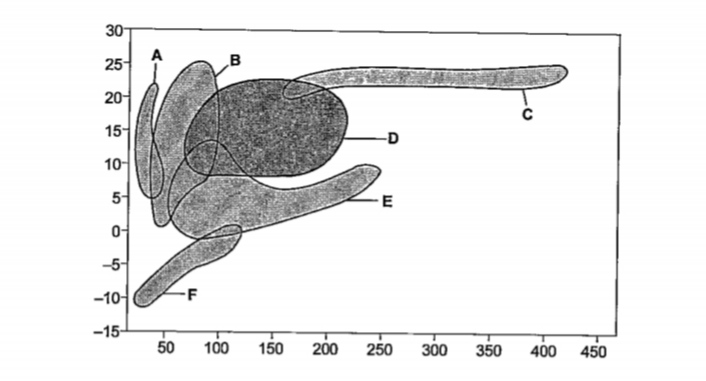
View SolutionThe graph given below shows the distribution of biomes: (b) Mark 'grassland' and coniferous forest' biomes.
View SolutionClimatic Zones and Biomes on Earth || Graph on Biome Distribution
View Solutionदिए गए आरेख में जीवोम वितरण को वर्षिक ताप और वर्षण के संदर्भ में दर्शाया गया है | सही विकल्प को चुनिए |
View SolutionThe graph given below is showing biome distribution with respect to annual temperature and precipitation. Identify A, B and C, respectively.
View Solution
