Students of a class voted for their favourite colour. If 400 students voted in all, then how many did vote 'Others' colour as their favourite? .
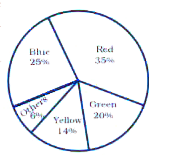
6
20
24
40
Step by step video & image solution for Students of a class voted for their favourite colour. If 400 students voted in all, then how many did vote 'Others' colour as their favourite? . by Maths experts to help you in doubts & scoring excellent marks in Class 8 exams.
Updated on:21/07/2023Topper's Solved these Questions
- DATA HANDLINGBOOK - NCERT EXEMPLARCHAPTER - DATA HANDLINGEXERCISE - EXERCISE (Fill in the blanks )
23 Videos
- DATA HANDLINGBOOK - NCERT EXEMPLARCHAPTER - DATA HANDLINGEXERCISE - EXERCISE (True or False)
23 Videos
- DATA HANDLINGBOOK - NCERT EXEMPLARCHAPTER - DATA HANDLINGEXERCISE - THINK AND DISCUSS
2 Videos
- COMPARING QUANTITIESBOOK - NCERT EXEMPLARCHAPTER - COMPARING QUANTITIESEXERCISE - Think and Discuss
2 Videos
- DIRECT AND INVERSE PROPORTIONS BOOK - NCERT EXEMPLARCHAPTER - DIRECT AND INVERSE PROPORTIONS EXERCISE - THINK AND DISCUSS
2 Videos
Similar Questions
Students of a class voted for their favourite colour and a pie chart was prepared based on the data collected.
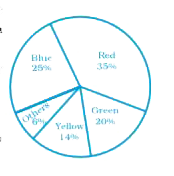
Observe the pie chart given below and answer questions based on it.
Which of the following is a reasonable conclusion for the given data?
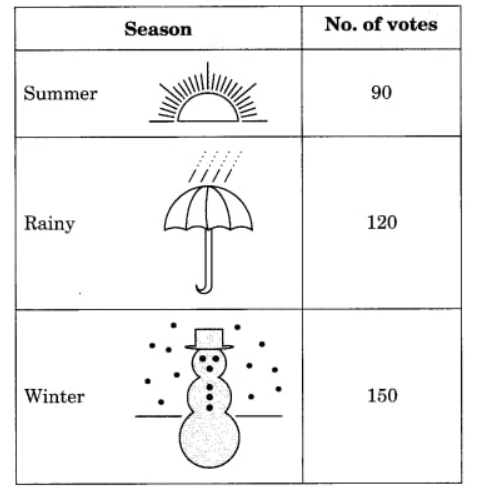
View SolutionA group of 360 people were asked to vote for their favourite season from the three seasons rainy, winter and summer.
(i) Which season got the most votes?
(ii) Find the central angle of each sector.
(iii) Draw a pie chart to show this information.
View Solution
Knowledge Check
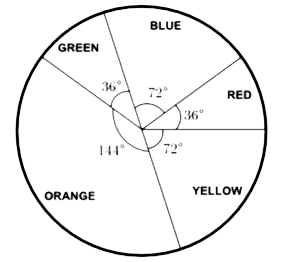
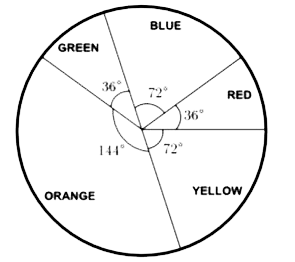
A survey was taken at a high school, and the results were put in a circle graph. The students were asked to list their favourite colours. The measurement of each central angle is shown. If a person is chosen at random from the school, find the probability of each response.
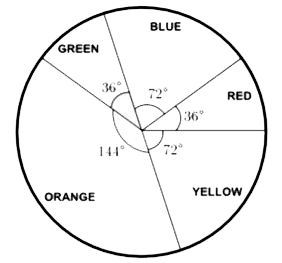
What is the probability of favourite colour being red ?A0.1B0.2C0.3D0.4A survey was taken at a high school, and the results were put in a circle graph. The students were asked to list their favourite colours. The measurement of each central angle is shown. If a person is chosen at random from the school, find the probability of each response.
What is the probability of favourite colour being blue or green ?A0.1B0.2C0.3D0.4A survey was taken at a high school, and the results were put in a circle graph. The students were asked to list their favourite colours. The measurement of each central angle is shown. If a person is chosen at random from the school, find the probability of each response.
What is the probability of favourite colour not being orange or green ?A0.65B0.75C0.25D0.50
In an election between two candidates, one got 55% of the total valid votes, 20% of the votes were invalid. If the total number of votes was 7500, the number of valid votes that the other candidate got, was :
View SolutionA survey was taken at a high school, and the results were put in a circle graph. The students were asked to list their favourite colours. The measurement of each central angle is shown. If a person is chosen at random from the school, find the probability of each response.
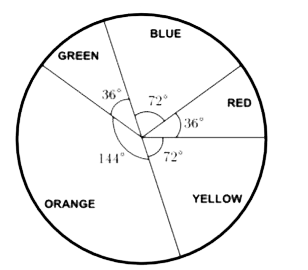
What is the probability of favourite colour being red or blue?
View SolutionA survey was taken at a high school, and the results were put in a circle graph. The students were asked to list their favourite colours. The measurement of each central angle is shown. If a person is chosen at random from the school, find the probability of each response.
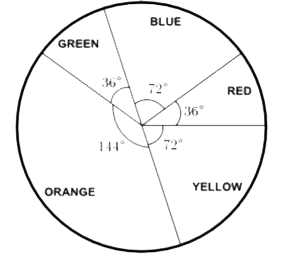
What is the probability of favourite colour not being red or blue?
View SolutionBy how many votes did the winner defeat his nearest rival?
View SolutionIn an election two candidate have participated. 10% of total voters did not cast their votes of the polled votes, 10% are declared as invalid. If the winner got 70% of valid votes, and won by 7290 votes, then find , how many voters are there in the voting list ?
View Solution
