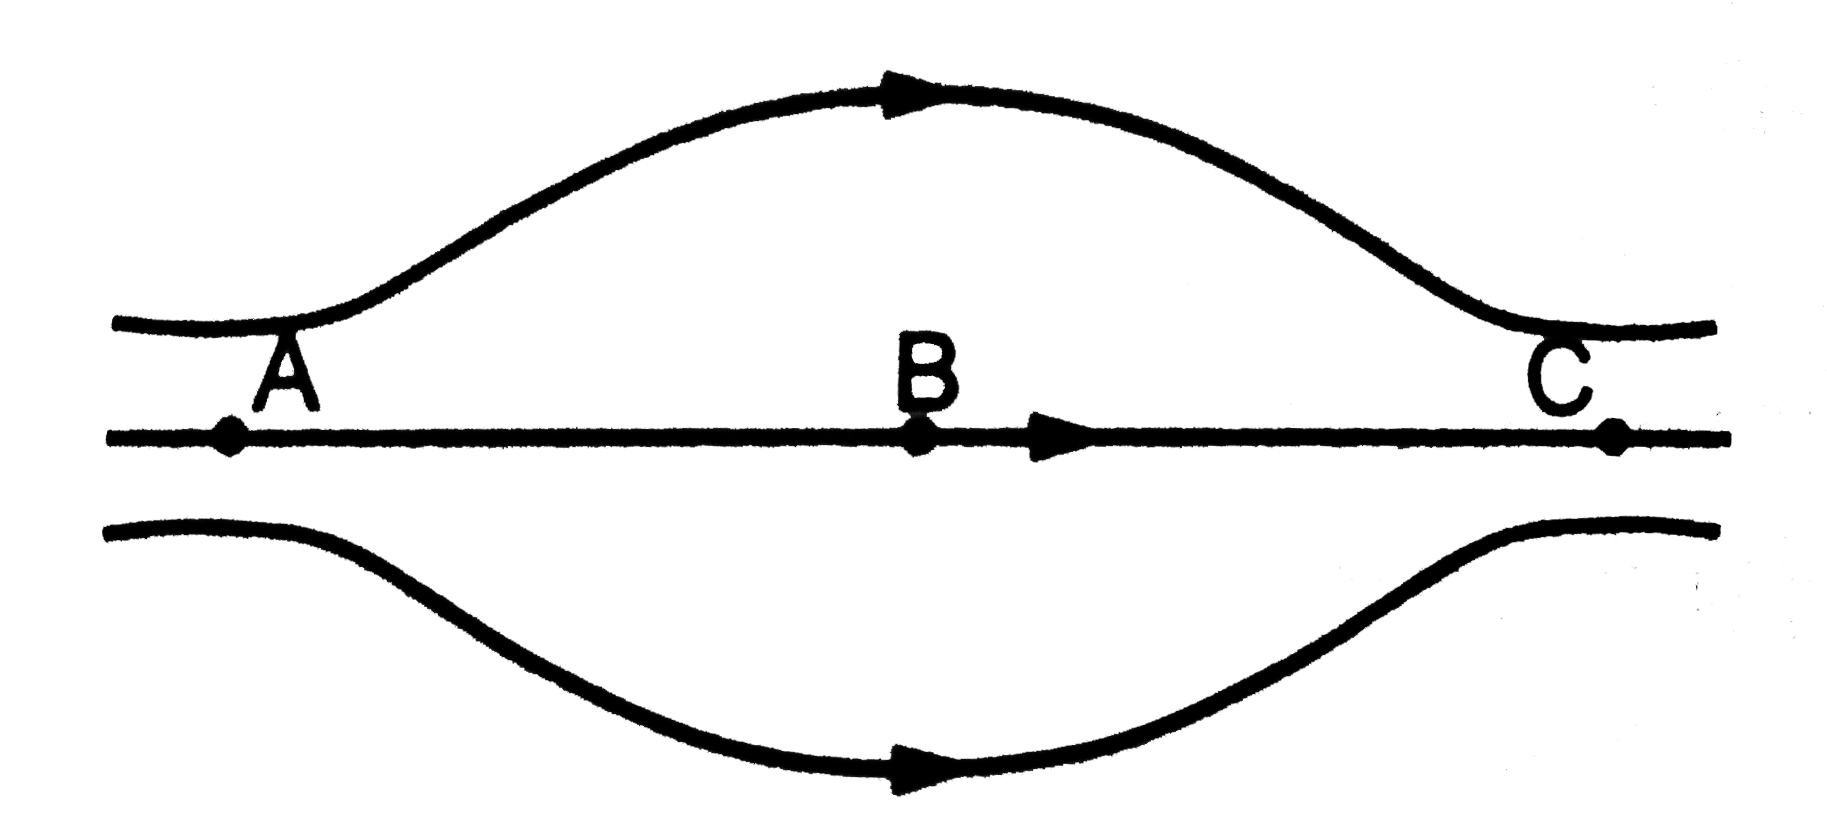
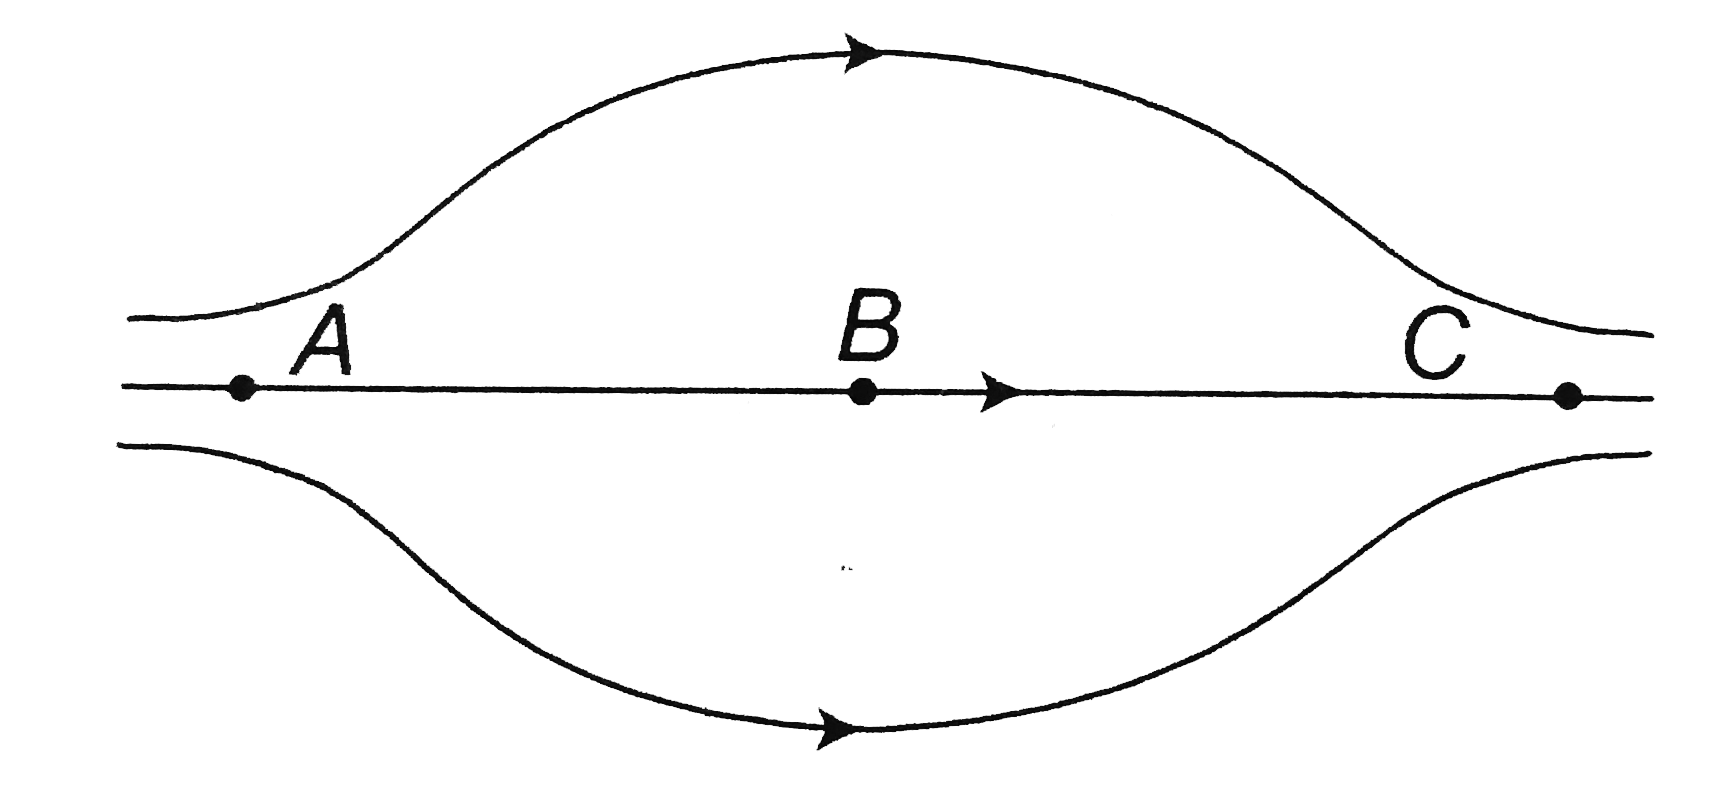
The figure shows some of the electric field lines corresponding to an electric field. The figure suggests
A
Ea>EB>EC
B
EA=EB=EC
C
Ea=EC>EB
D
EA>EC>EB
Video Solution
Text Solution
The correct Answer is:C
Electric field intensity at a particular point is directly proportional to the number of electric line of forces crossing per unit area ,
⇒EA=EC .... (i)
As , density of electric line of force in region A and C is more as compared to B .
Hence Eqs , (i) and (ii) , were get
EA=EC>EB
|
Topper's Solved these Questions
- ELECTRIC CHARGES AND FIELDS BOOK - PHYSICS WALLAHCHAPTER - ELECTRIC CHARGES AND FIELDS EXERCISE - NEET PAST 5 YEARS QUESTIONS
7 Videos
- ELECTRIC CHARGES AND FIELDS BOOK - PHYSICS WALLAHCHAPTER - ELECTRIC CHARGES AND FIELDS EXERCISE - NEET PAST 5 YEARS QUESTIONS
7 Videos
- DUAL NATURE OF RADIATION AND MATTERBOOK - PHYSICS WALLAHCHAPTER - DUAL NATURE OF RADIATION AND MATTEREXERCISE - Neet past 5 years questions
16 Videos
- ELECTROMAGNETIC INDUCTION BOOK - PHYSICS WALLAHCHAPTER - ELECTROMAGNETIC INDUCTION EXERCISE - NEET PAST 5 YEARS QUESTIONS
10 Videos
Similar Questions
Knowledge Check
The figure shows some of the electric field lines corresponding to an electric field. The figure suggests
 AEa>EB>ECBEA=EB=ECCEa=EC>EBDEA>EC>EB
The figure shows some of the elective field lines corresponding to an elective filed. The figure suggests
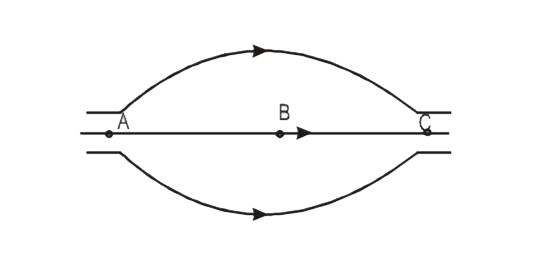 AEA>EB>ECBEA=EB=ECCEA=EC>CBDEA=EC<EB
Figure 1.24 shows electric field lines corresponding to an electric field E. Figure suggests that.
 AEA<EBotECBEA=EB=ECCEA=EC<EBDEA=EC>EB
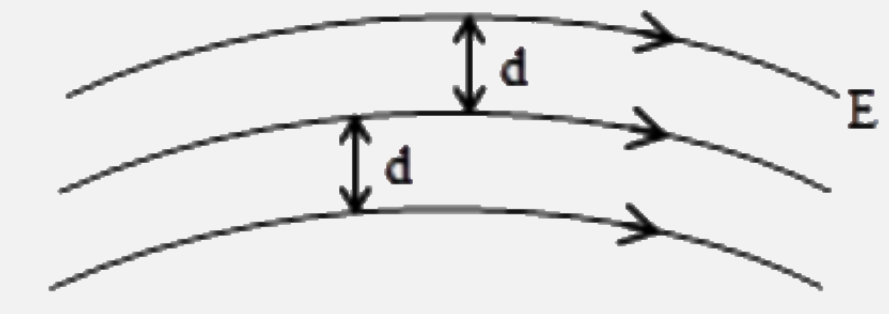
For the following electric field lines, the the electric field is
View SolutionFigure shows some of the electric field lines due to three point charges q,q2 and q3 of equal magnitude. What are the signs of each of the three charges?

View SolutionFigure shows the electric field lines around an electric dipole. Which of the arrows best represents the electric field at point P ?

View SolutionThe diagram shows the electric field lines produced by an electrostalic focusing device.
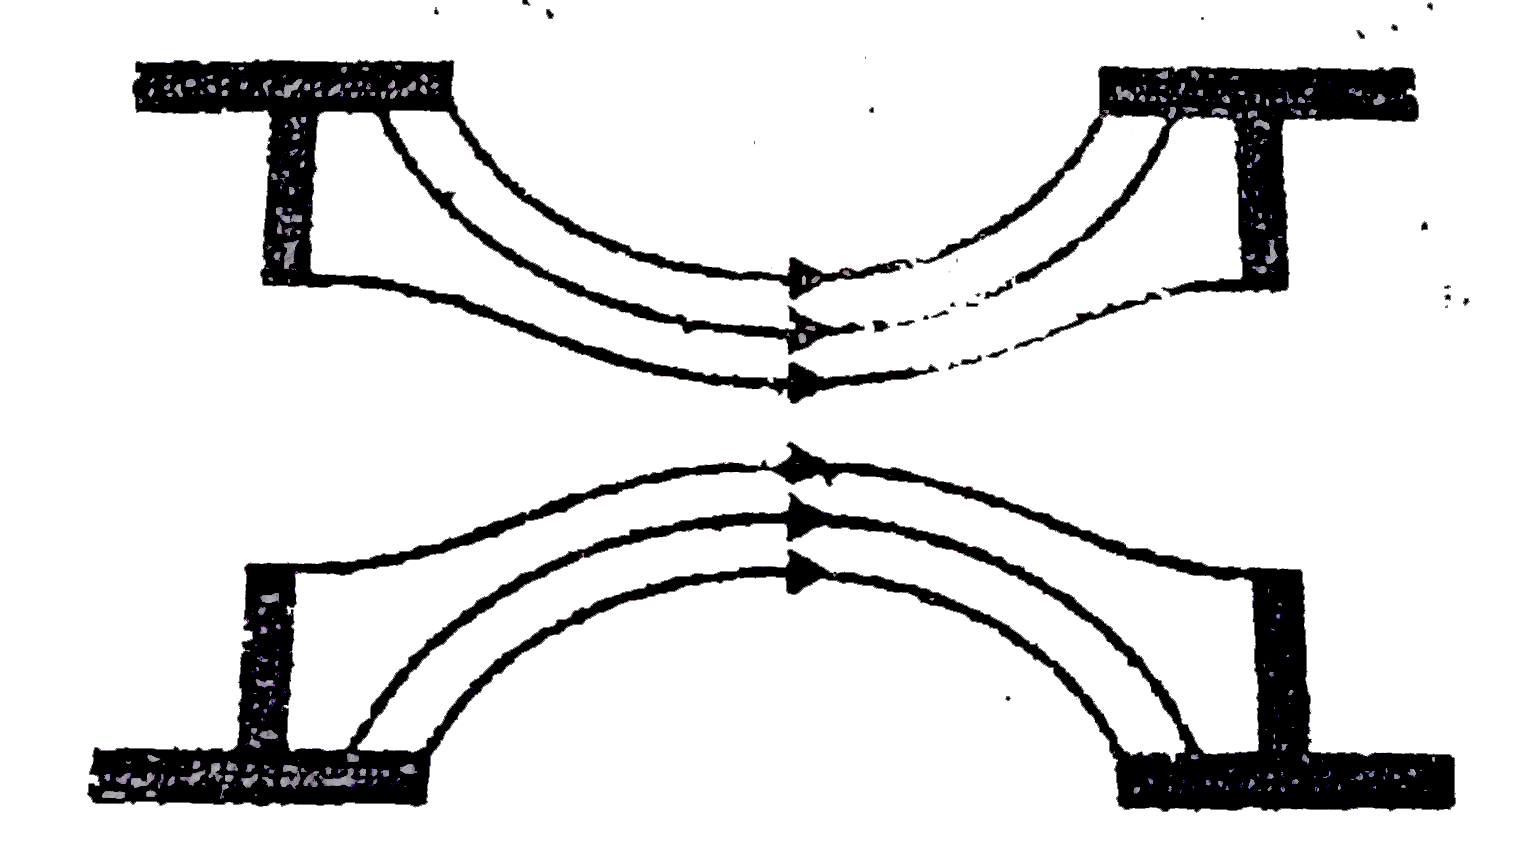
Which one of the following diagrams best shows the corresponding equipotential lines? The electric field are shown as broken lines on each of the diagrams.
View SolutionFind the electric field in region II as shown in figure.
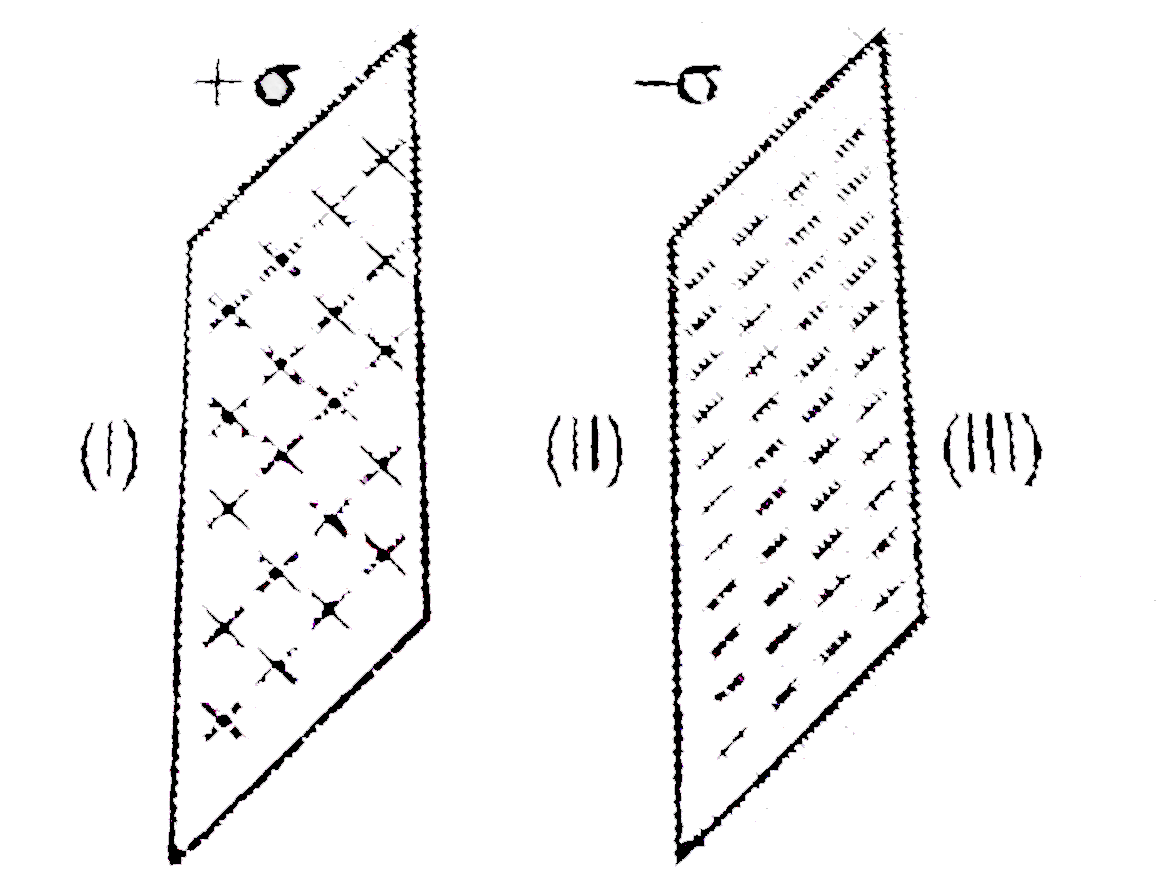
View Solution
