A cell having an emf ε and internal resistance r is connected across a variable external resistance R. As the resistance R is increased, the plot of potential difference V across R is given by:

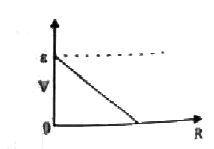
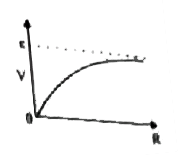
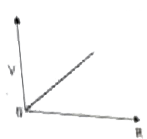
The correct Answer is:C
To solve the problem, we need to analyze the relationship between the potential difference V across the external resistance R and the resistance R itself, given a cell with an electromotive force (emf) ϵ and internal resistance r.
1. Understanding the Circuit:
- We have a cell with emf ϵ and internal resistance r.
- This cell is connected to a variable external resistance R.
- We need to find the potential difference V across the external resistance R as R is varied.
2. Finding the Current in the Circuit:
- The total resistance in the circuit is the sum of the internal resistance r and the external resistance R:
Rtotal=R+r
- Using Ohm's Law, the current I flowing through the circuit can be expressed as:
I=ϵR+r
3. Calculating the Potential Difference V:
- The potential difference V across the external resistance R can be calculated using Ohm's Law:
V=I⋅R
- Substituting the expression for I:
V=(ϵR+r)⋅R
- Simplifying this, we get:
V=ϵRR+r
4. Analyzing the Expression for V:
- The expression V=ϵRR+r shows how V changes as R varies.
- As R increases, we can analyze the behavior of V:
- If R approaches infinity, the term R+r will also approach infinity, leading to:
V \to \epsilon \quad \text{(as R \to \infty )}
- If R is very small (approaching 0), then:
V \to 0 \quad \text{(as R \to 0 )}
5. Graphical Representation:
- The relationship between V and R is hyperbolic because V is proportional to R but divided by a term that increases with R.
- As R increases, V increases initially and approaches ϵ but never exceeds it.
- Therefore, the plot of V versus R will be a hyperbola that approaches the line V=ϵ as R increases.
6. Choosing the Correct Option:
- Based on the analysis, we can eliminate options that suggest a linear relationship.
- The correct option is the one that shows a hyperbolic curve approaching ϵ as R increases.
Final Answer:
The correct plot of potential difference V across R as R is increased is represented by option 3.
- We have a cell with emf ϵ and internal resistance r.
- This cell is connected to a variable external resistance R.
- We need to find the potential difference V across the external resistance R as R is varied.
- The total resistance in the circuit is the sum of the internal resistance r and the external resistance R:
Rtotal=R+r
- Using Ohm's Law, the current I flowing through the circuit can be expressed as:
I=ϵR+r
- The potential difference V across the external resistance R can be calculated using Ohm's Law:
V=I⋅R
- Substituting the expression for I:
V=(ϵR+r)⋅R
- Simplifying this, we get:
V=ϵRR+r
- The expression V=ϵRR+r shows how V changes as R varies.
- As R increases, we can analyze the behavior of V:
- If R approaches infinity, the term R+r will also approach infinity, leading to:
V \to \epsilon \quad \text{(as R \to \infty )}
- If R is very small (approaching 0), then:
V \to 0 \quad \text{(as R \to 0 )}
- The relationship between V and R is hyperbolic because V is proportional to R but divided by a term that increases with R.
- As R increases, V increases initially and approaches ϵ but never exceeds it.
- Therefore, the plot of V versus R will be a hyperbola that approaches the line V=ϵ as R increases.
- Based on the analysis, we can eliminate options that suggest a linear relationship.
- The correct option is the one that shows a hyperbolic curve approaching ϵ as R increases.
The correct plot of potential difference V across R as R is increased is represented by option 3.
Topper's Solved these Questions
- CURRENT ELECTRICITYBOOK - PHYSICS WALLAHCHAPTER - CURRENT ELECTRICITYEXERCISE - Level-2
30 Videos
- CURRENT ELECTRICITYBOOK - PHYSICS WALLAHCHAPTER - CURRENT ELECTRICITYEXERCISE - NEET Past 5 Years Questions
23 Videos
- ALTERNATING CURRENT BOOK - PHYSICS WALLAHCHAPTER - ALTERNATING CURRENT EXERCISE - NEET PAST 5 YEARS QUESTIONS
8 Videos
- DUAL NATURE OF RADIATION AND MATTERBOOK - PHYSICS WALLAHCHAPTER - DUAL NATURE OF RADIATION AND MATTEREXERCISE - Neet past 5 years questions
16 Videos
Similar Questions
A cell of emf ε and internal resistance (r) is connected in series with an external resistance (nr) then the ratio of the terminal potential difference to emf is:
View SolutionA cell of emf E and internal resistance r is connected across an external resistance R. Plot a graph showing the variation o P.D. Across R, versesR.
View Solution
Knowledge Check
A cell having an emf E and internal resistance r is connected across a variable external resistance R. As the resistance R is increased, the plot of potential difference V across R is given by
A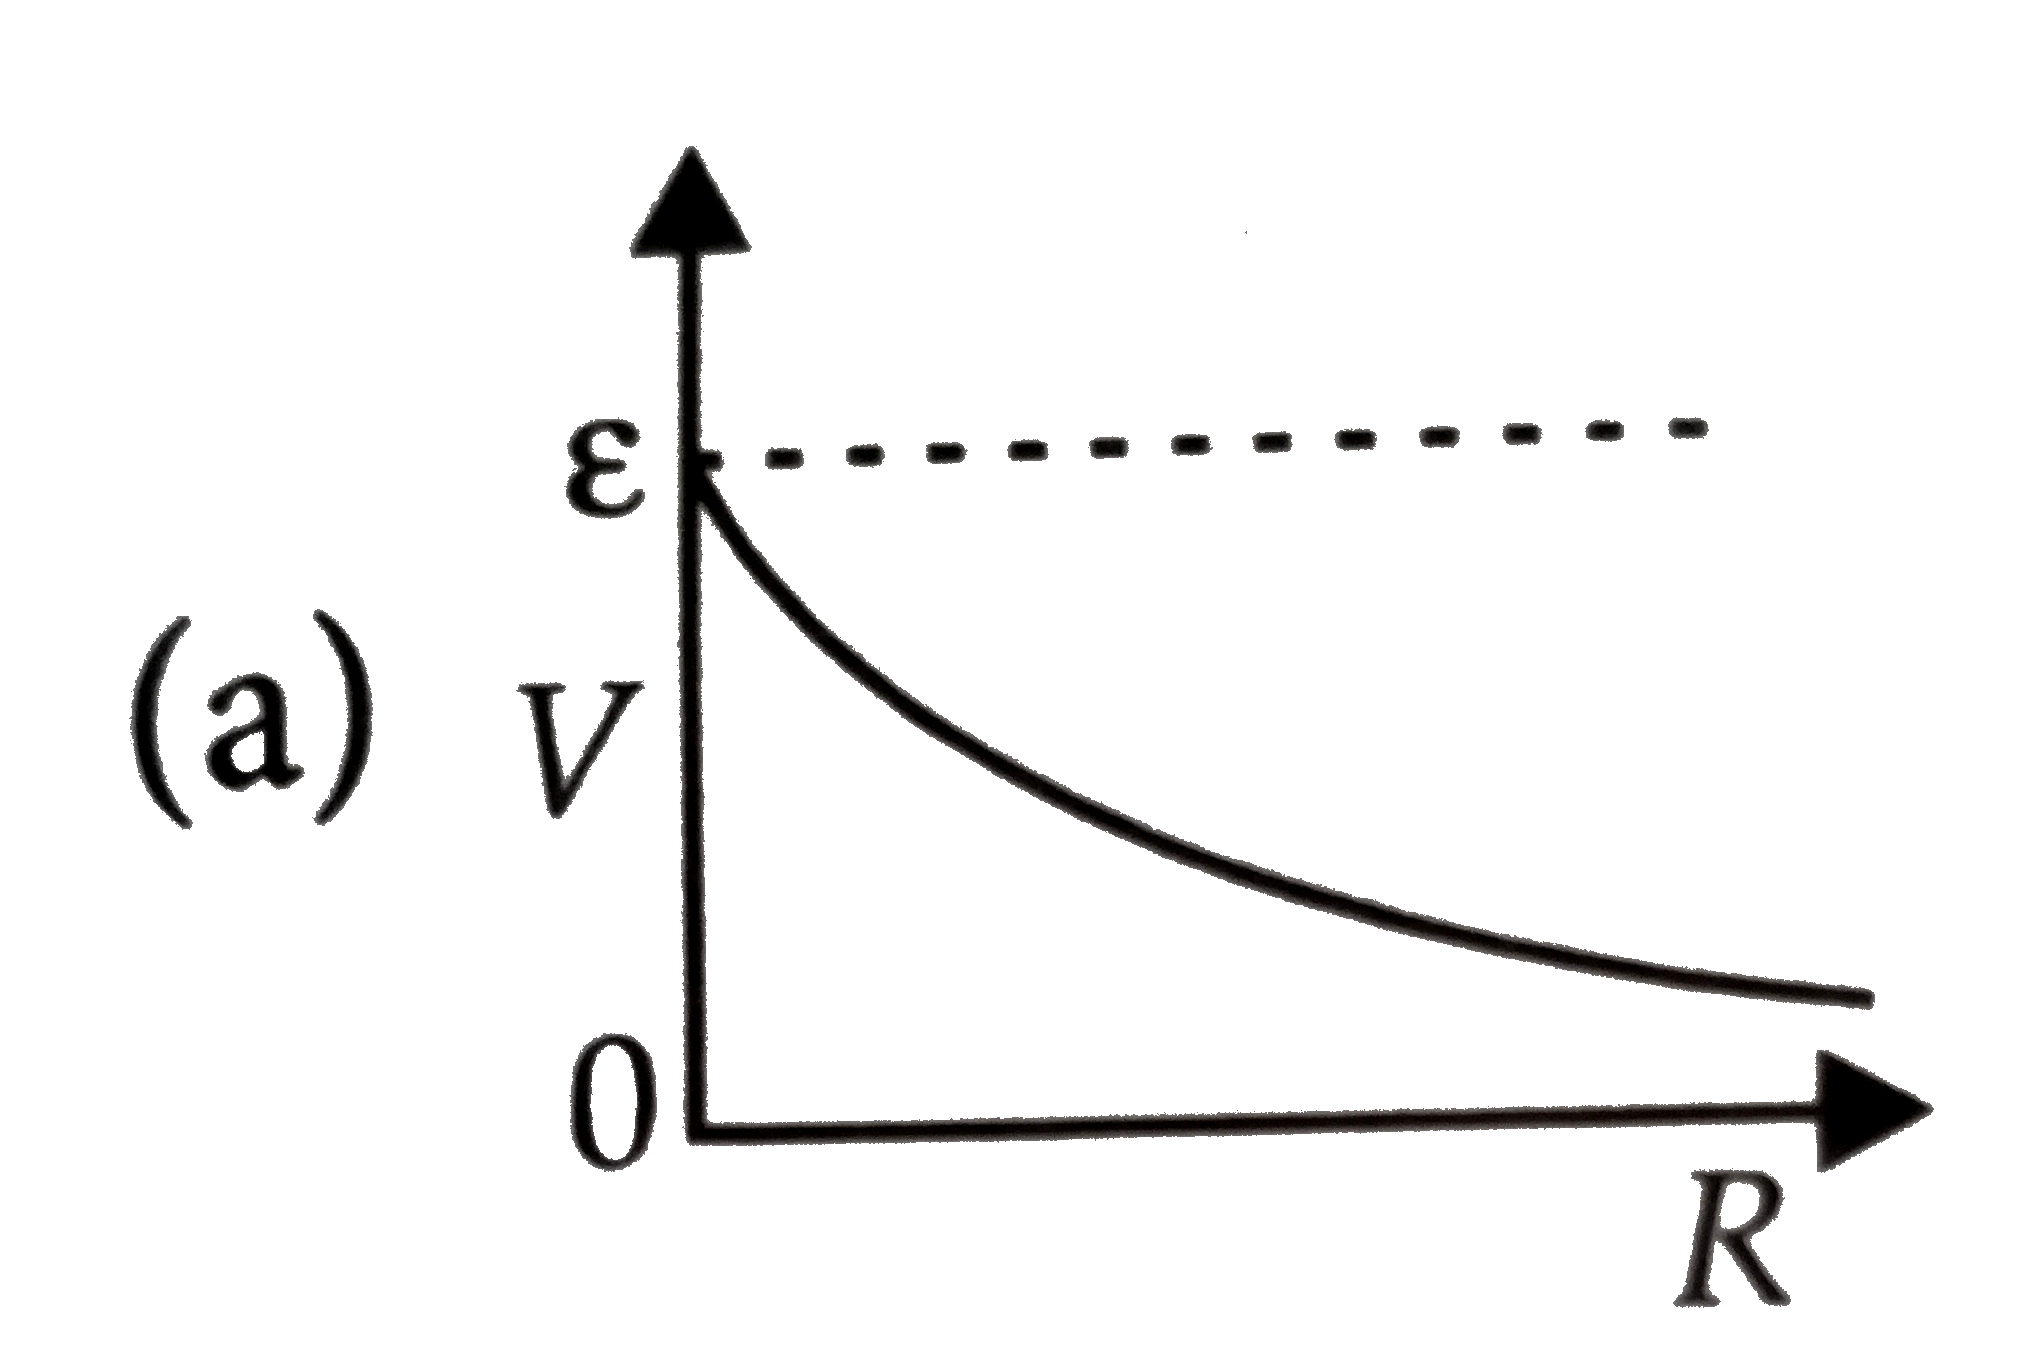 B
B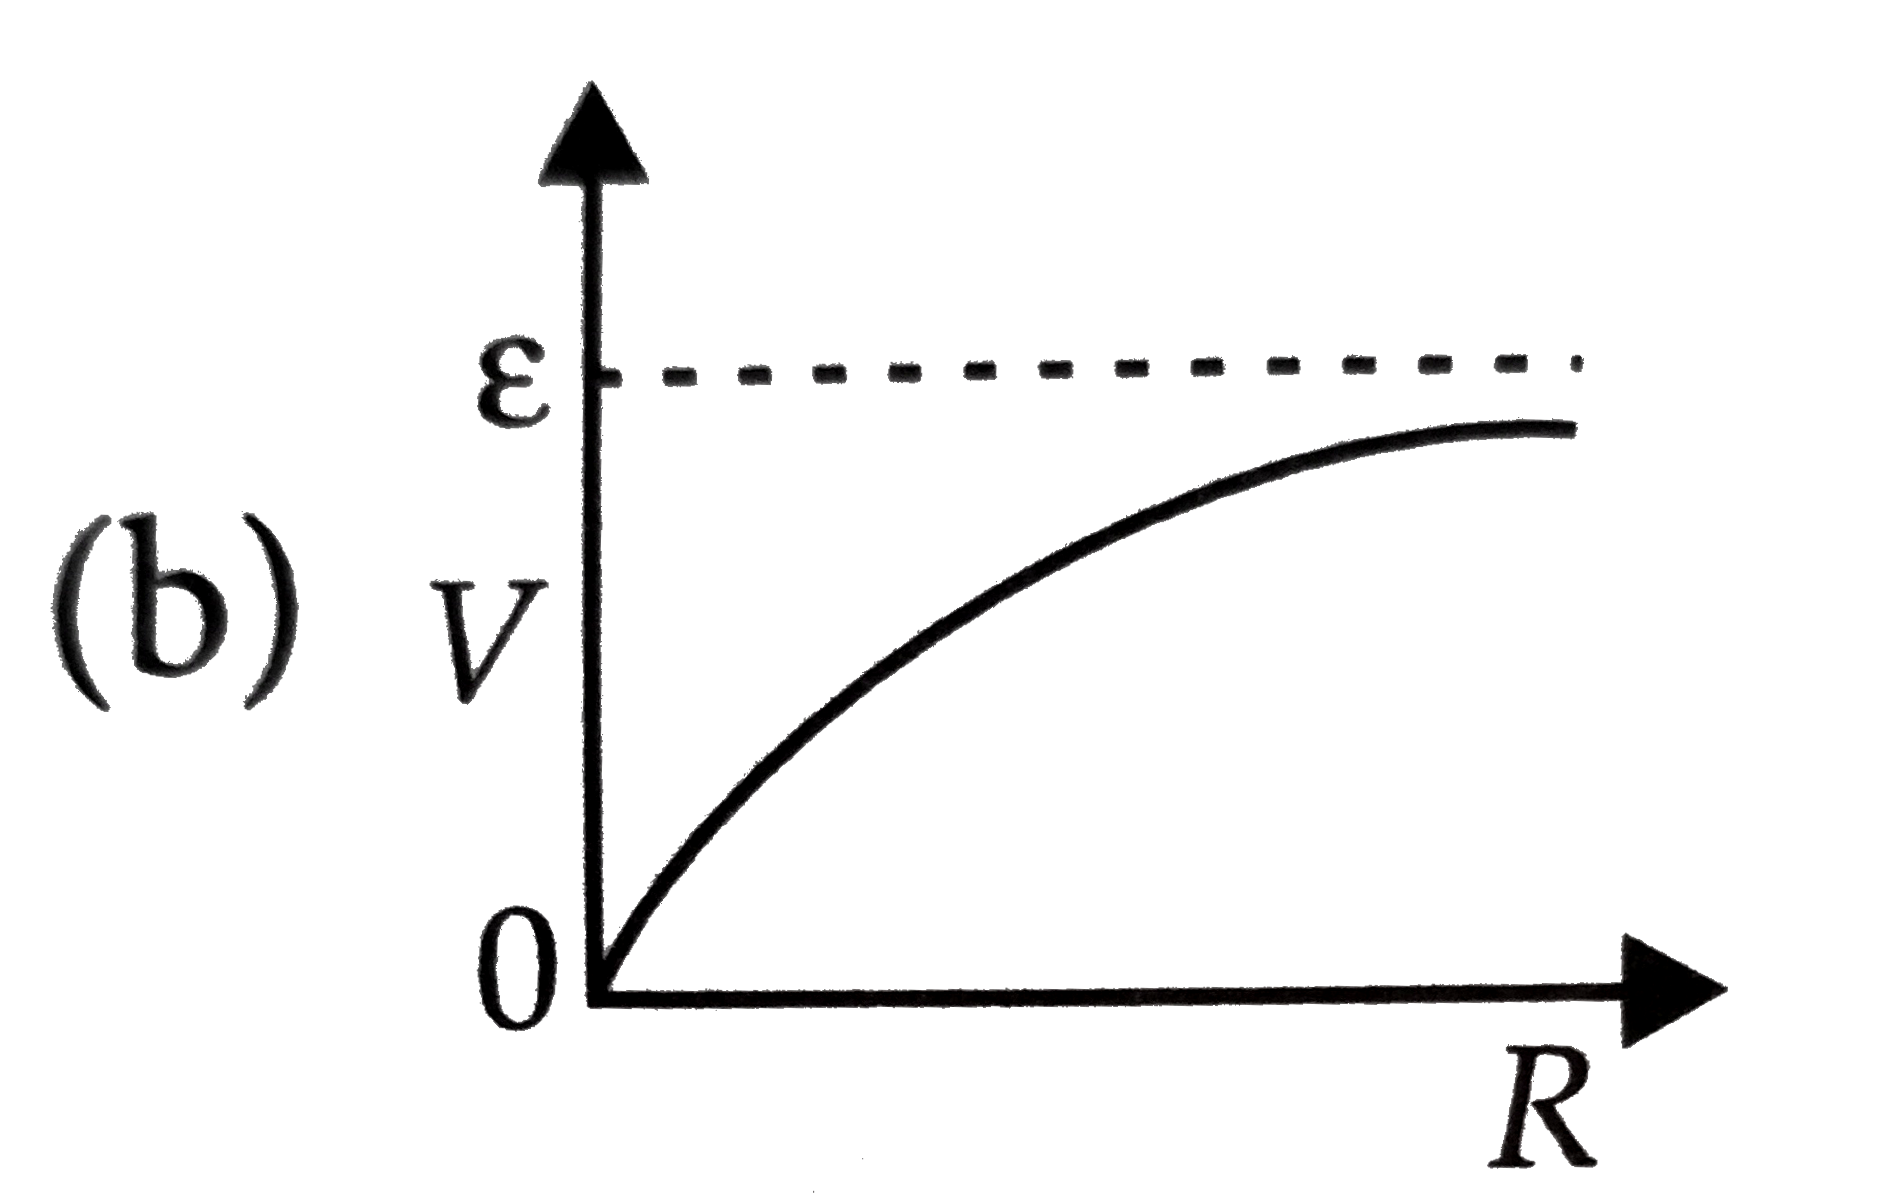 C
C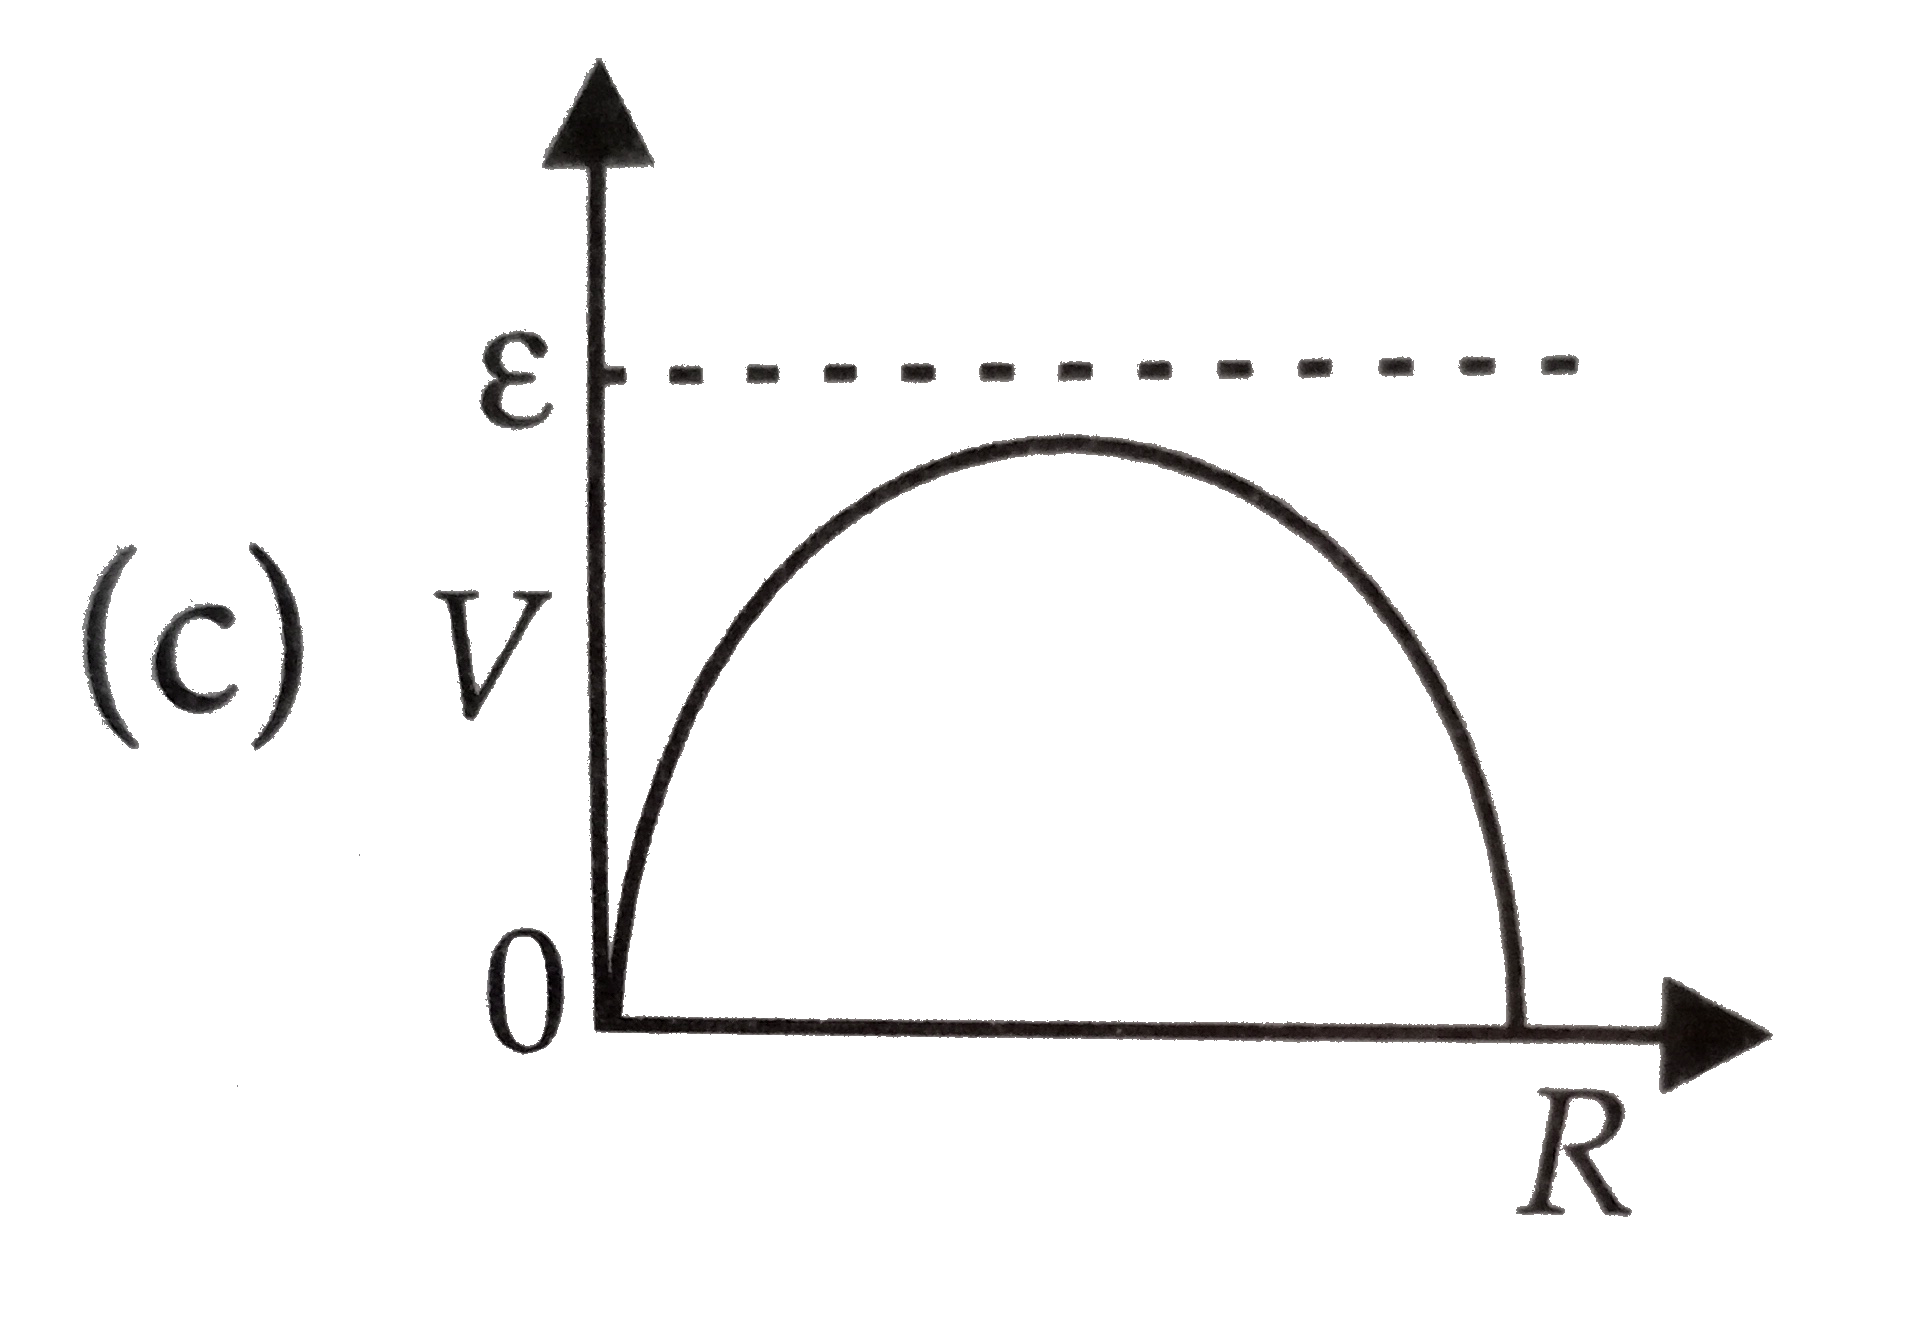 D
D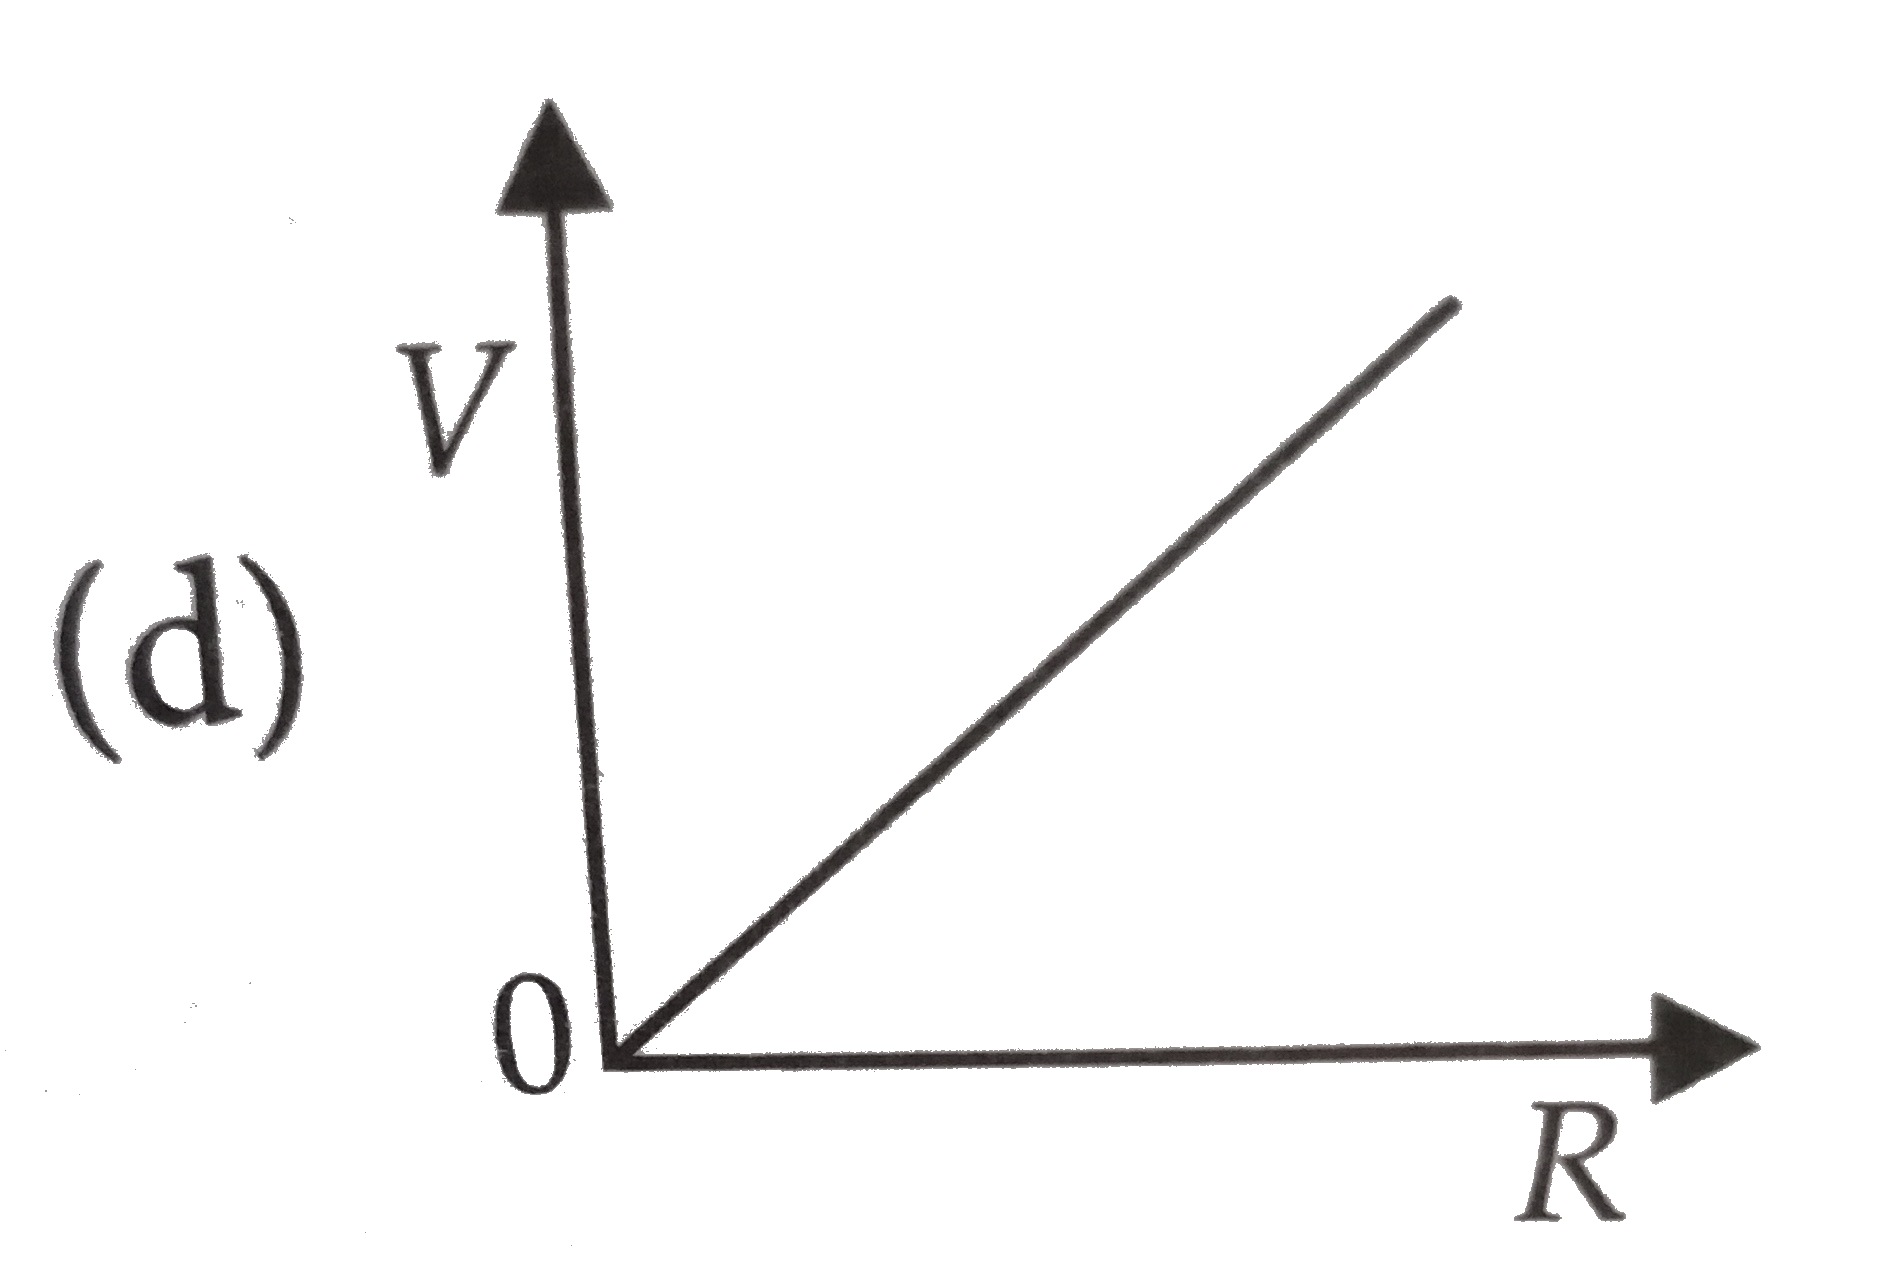
Cell having an emfε internal resistance r is connected a variable external resistance R As the resistance R is increased the piot of potential difference V across R is given by
A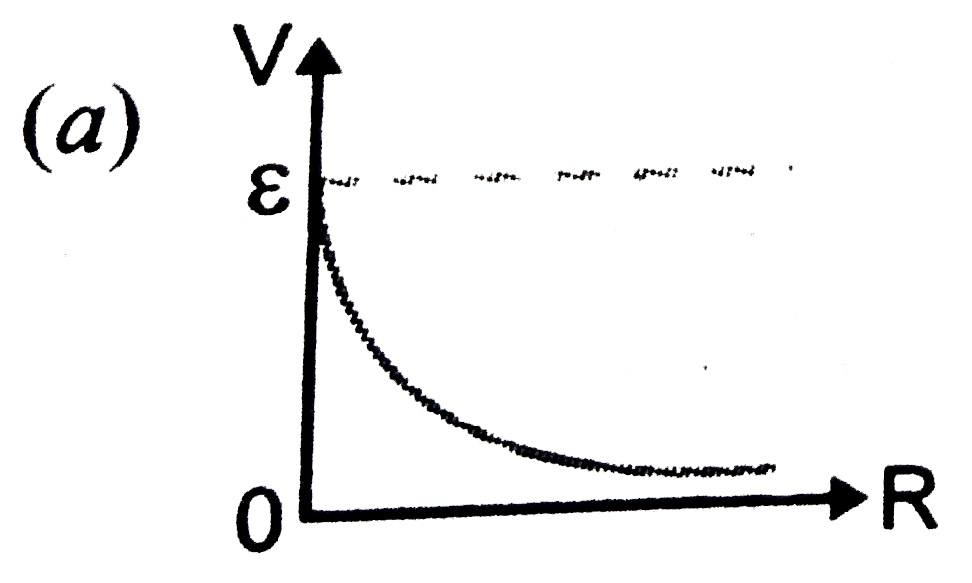 B
B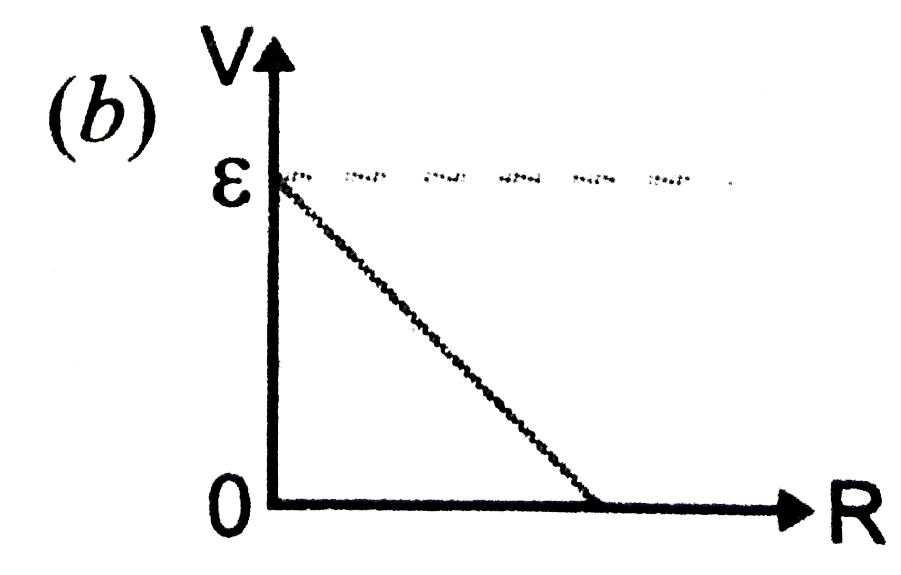 C
C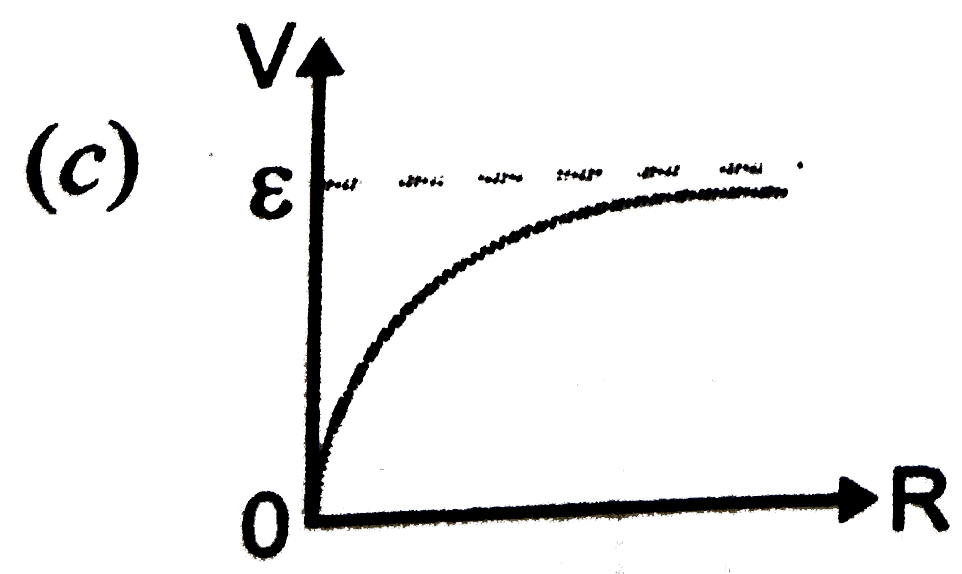 D
D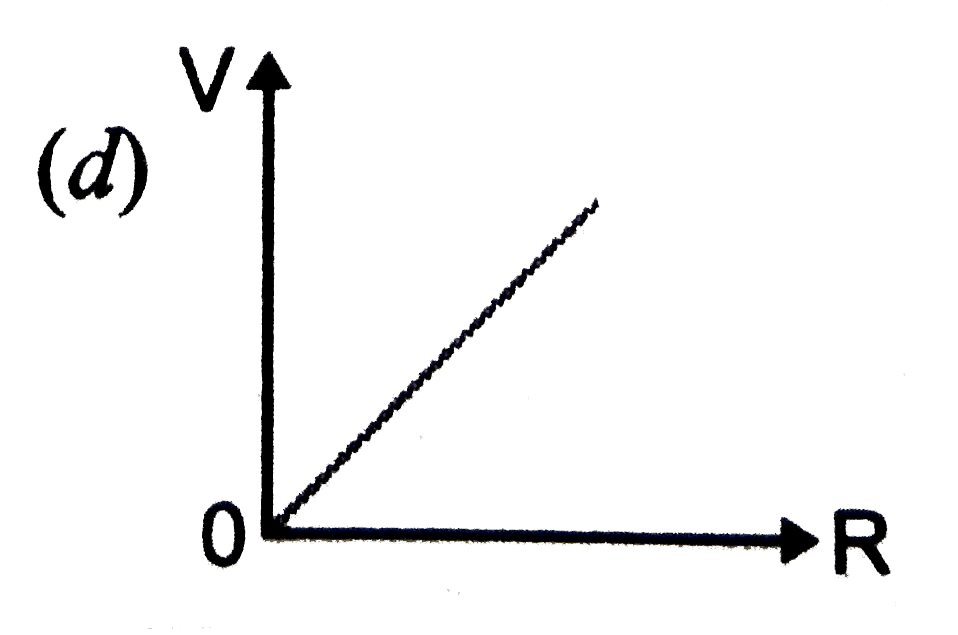
A cell of emf (E) and internal resistance r is connected across a variable external resistance . R. The graph of terminal potential difference V as a function of R is
A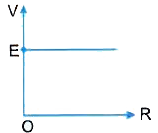 B
B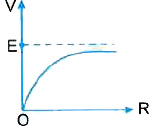 C
C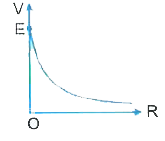 D
D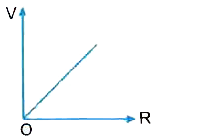
A cell of emf ε and internal resistance r is connected across a variable load resistance R. It is found that when R=4Ω the current is 1A and when R is increased to 9Ω, the current reduces to 0.5A. Find the value of the emf ε and internal resistancer
View SolutionA cell of internal resistance r connected across an external resistance R can supply maximum current when
View SolutionIf E is the emf of a cell of internal resistance r and external resistance R, then potential difference across R is given as
View SolutionA cell of emf E has an internal resistance r and is connected to rheostat. When resistance R of rheostat is changed, correct graph of potentail difference across it is
View SolutionA cell of e.mf. E and internal resistance r is connected in series with an external resistance nr. Then, the ratio of the terminal potential difference to E.M.F.is
View Solution
