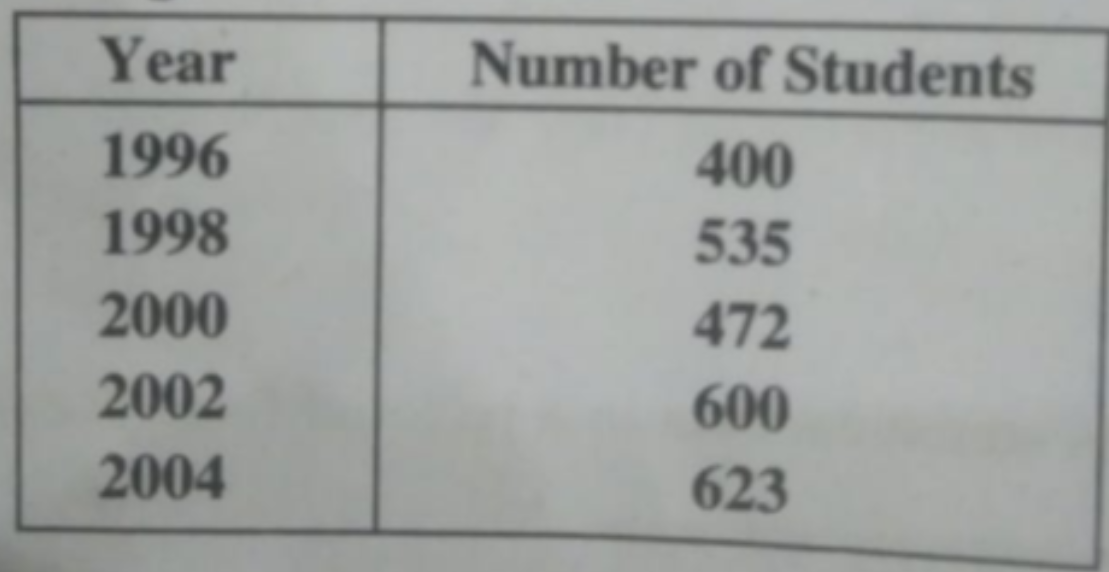
Total number of students of a school in different years is shown in the following table:
Prepare another pictograph of students using any other symbol each representing 50 students.Which pictograph do you find more informative?
 .Solution in Punjabi
Step by step video & image solution for Total number of students of a school in different years is shown in the following table:Prepare another pictograph of students using any other symbol each representing 50 students.Which pictograph do you find more informative?. by Maths experts to help you in doubts & scoring excellent marks in Class 6 exams.
Topper's Solved these Questions
Similar Questions
The following data is of the ages(in years) of 20 students of class VI.Arrange the data in a table using tally marks.
How many students are 10 years of age?04:51View SolutionFrom a basket of mangoes when counted in twos there was one extra, when counted in threes there were two extra, when counted in fours there were three extra, when counted in fives there were four extra, when counted in sixes there were five extra . But when counted in sevens there no extra.Ateast how many mangoes were thee in the basket?
02:11View SolutionWrite the following numbers in the place value tables:
20.502:45View SolutionTotal number of students of a school in different years is shown in the following table: Year, No. of Students 1996 1998 2000 2002 2004, 400 550 450 600 650 Represent the above data by a pictograph. Prepare a pictograph of students using one symbol an icon of a student to represent 100 students and answer the following questions: How many symbols represent total number of students in the year 2002? How many symbols represent total number of students in the year 1998? Prepare another pictograph of students using any other symbol each representing 50 students. Which pictograph do you find more informative?
02:17View SolutionDetermine the point of symmetry of a regular hexagon.
05:41View SolutionMatch the following Column A to Column B
 02:10View Solution
Match the following Column A to Column B
 02:17View Solution
Match the following Column A to Column B
 02:10View Solution
The inequation represented by the graph given below is :
04:23View SolutionThe inequation that best describes the graph given below is _________
01:32View SolutionThe inequation that best describes the following graph is _________
04:05View SolutionWhich inequations represent the shaded region in the given figure
06:52View SolutionFor shown situation find ∠BCA :-
ltimg src="https://d10lpgp6xz60nq.cloudfront.net/physics_images/ALN_PHY_R05_E01_035_Q01.png" width="80%"gt05:06View SolutionFind the magnitude of the resultant of shown forces :-
ltimg src="https://d10lpgp6xz60nq.cloudfront.net/physics_images/ALN_PHY_R02_E02_009_Q01.png" width="80%"gt07:06View SolutionTotal number of students of a school in different years is shown in the following table: Year, No. of Students 1996 1998 2000 2002 2004, 400 550 450 600 650 Represent the above data by a pictograph. Prepare a pictograph of students using one symbol an icon of a student to represent 100 students and answer the following questions: How many symbols represent total number of students in the year 2002? How many symbols represent total number of students in the year 1998? Prepare another pictograph of students using any other symbol each representing 50 students. Which pictograph do you find more informative?
10:54View Solution

