Total number of students of a school in different years is shown in the following table A. Prepare a pictograph of students using one symbol ? To represent 100 students and answer the following questions: (a) How many symbols represent total number of students in the year 2002?

 Solution in Kannada
Step by step video & image solution for Total number of students of a school in different years is shown in the following table A. Prepare a pictograph of students using one symbol ? To represent 100 students and answer the following questions: (a) How many symbols represent total number of students in the year 2002? by Maths experts to help you in doubts & scoring excellent marks in Class 6 exams.
Updated on:21/07/2023Topper's Solved these Questions
Similar Questions
Find the rule which gives the number of matchsticks required to make the following matchstick patterns. Use a variable to write the rule. (a) A pattern f letter Z as
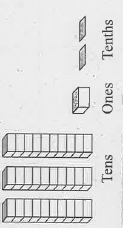
View SolutionWrite the fraction representing the place value blocks. (a)

View SolutionTotal number of students of a school in different years is shown in the following table: Year, No. of Students 1996 1998 2000 2002 2004, 400 550 450 600 650 Represent the above data by a pictograph. Prepare a pictograph of students using one symbol an icon of a student to represent 100 students and answer the following questions: How many symbols represent total number of students in the year 2002? How many symbols represent total number of students in the year 1998? Prepare another pictograph of students using any other symbol each representing 50 students. Which pictograph do you find more informative?
View SolutionFollowing information is available for the year 2016-17, calculate gross profit ratio:
View SolutionHow many lines of symmetry does the above figure have ?
View SolutionWhich of the following are correct chain isomers of butane ? (i)
View SolutionDetermine the point of symmetry of a regular hexagon.
View SolutionDtermine the images of the following figure about the given line :
View SolutionMatch the following Column A to Column B

View SolutionMatch the following Column A to Column B

View SolutionMatch the following Column A to Column B

View SolutionThe inequation represented by the graph given below is :
View SolutionThe inequation that best describes the graph given below is _________
View SolutionThe inequation that best describes the following graph is _________
View SolutionWhich inequations represent the shaded region in the given figure
View Solution
