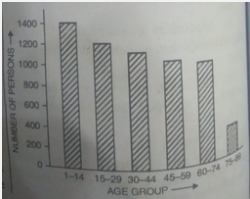
The bar graph given in the adjoining figure represents the various age groups of people in a town.Study the bar graph and answer the following questions:
Write the no. of people in the youngest age group?
 .Solution in Punjabi
Step by step video & image solution for The bar graph given in the adjoining figure represents the various age groups of people in a town.Study the bar graph and answer the following questions:Write the no. of people in the youngest age group?. by Maths experts to help you in doubts & scoring excellent marks in Class 6 exams.
Topper's Solved these Questions
Similar Questions
The following data is of the ages(in years) of 20 students of class VI.Arrange the data in a table using tally marks.
How many students are 10 years of age?01:37View SolutionFrom a basket of mangoes when counted in twos there was one extra, when counted in threes there were two extra, when counted in fours there were three extra, when counted in fives there were four extra, when counted in sixes there were five extra . But when counted in sevens there no extra.Ateast how many mangoes were thee in the basket?
02:11View SolutionWrite the following numbers in the place value tables:
20.501:31View SolutionHow many lines of symmetry does the above figure have ?
02:45View SolutionDetermine the point of symmetry of a regular hexagon.
02:17View SolutionDtermine the images of the following figure about the given line :
05:41View SolutionMatch the following Column A to Column B
 03:28View Solution
Match the following Column A to Column B
 02:31View Solution
Match the following Column A to Column B
 02:21View Solution
Find the area of figure given below.
 02:03View Solution
Find the perimeter of the figure given below.
 02:10View Solution
Find the area of the figure given below.
 02:17View Solution
The area of the shaded part in the figure given below is ______.
 02:10View Solution
The inequation represented by the graph given below is :
04:23View SolutionThe inequation that best describes the graph given below is _________
02:02View SolutionThe inequation that best describes the following graph is _________
03:02View Solution

