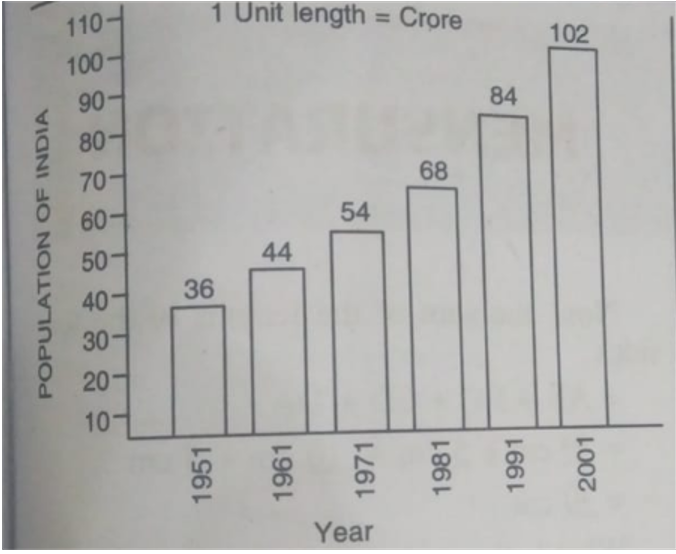
In the adjoining bar graph the growth of population of India from 1951 to 2001 is shown.Observe the graph and find in which two consecutive years the population growth is maximum?
 .Solution in Punjabi
Year 1951 to year 1961
Year 1971 to year 1981
Year 1981 to year 1991
Year 1991 to year 2001.
Step by step video & image solution for In the adjoining bar graph the growth of population of India from 1951 to 2001 is shown.Observe the graph and find in which two consecutive years the population growth is maximum?. by Maths experts to help you in doubts & scoring excellent marks in Class 6 exams.
Topper's Solved these Questions
Similar Questions
The following data is of the ages(in years) of 20 students of class VI.Arrange the data in a table using tally marks.
How many students are 10 years of age?06:07View SolutionFrom a basket of mangoes when counted in twos there was one extra, when counted in threes there were two extra, when counted in fours there were three extra, when counted in fives there were four extra, when counted in sixes there were five extra . But when counted in sevens there no extra.Ateast how many mangoes were thee in the basket?
02:11View SolutionWrite the following numbers in the place value tables:
20.502:45View SolutionWhich of the following are correct chain isomers of butane ? (i)
02:17View SolutionDetermine the point of symmetry of a regular hexagon.
05:41View SolutionMatch the following Column A to Column B
 02:21View Solution
Match the following Column A to Column B
 02:10View Solution
Match the following Column A to Column B
 02:17View Solution
Find the area of the figure given below.
 02:10View Solution
The inequation represented by the graph given below is :
04:23View SolutionThe inequation that best describes the graph given below is _________
01:13View SolutionThe inequation that best describes the following graph is _________
02:24View SolutionWhich inequations represent the shaded region in the given figure
04:05View SolutionIn Fig, find the value of x.
ltimg src="https://d10lpgp6xz60nq.cloudfront.net/physics_images/PS_MATH_IX_C12_S01_032_Q01.png" width="80%"gt03:10View SolutionWhich of the following statement is not correc for following straight line graph :-
ltimg src="https://d10lpgp6xz60nq.cloudfront.net/physics_images/ALN_PHY_R04_E01_015_Q01.png" width="80%"gt02:04View Solution

