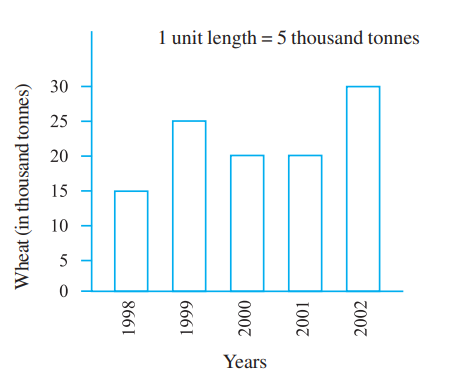
Bar graph given below shows the amount of wheat purchased by government during the year 1988-2002
Read the bar graph and write down your observations.
In which year was the wheat production maximum?
 .Solution in Punjabi
1998
1999
2001
2002
Step by step video & image solution for Bar graph given below shows the amount of wheat purchased by government during the year 1988-2002Read the bar graph and write down your observations.In which year was the wheat production maximum?. by Maths experts to help you in doubts & scoring excellent marks in Class 6 exams.
Topper's Solved these Questions
Similar Questions
The following data is of the ages(in years) of 20 students of class VI.Arrange the data in a table using tally marks.
How many students are 10 years of age?01:39View SolutionFrom a basket of mangoes when counted in twos there was one extra, when counted in threes there were two extra, when counted in fours there were three extra, when counted in fives there were four extra, when counted in sixes there were five extra . But when counted in sevens there no extra.Ateast how many mangoes were thee in the basket?
02:11View SolutionWrite the following numbers in the place value tables:
20.502:45View SolutionThe bar graph given alongside shows the amount of wheat purchasedby government during the year 1998-2002. Read the bar graph andwrite down your observations. In which year was(a) the wheat production maximum?(b) the wheat production minimum?
 02:17View Solution
Determine the point of symmetry of a regular hexagon.
05:41View SolutionMatch the following Column A to Column B
 02:10View Solution
Match the following Column A to Column B
 02:17View Solution
Match the following Column A to Column B
 02:10View Solution
The inequation represented by the graph given below is :
03:02View SolutionThe inequation that best describes the graph given below is _________
03:13View SolutionThe inequation that best describes the following graph is _________
01:51View SolutionIn the given figure, PQRS is a parallelogram. A and B are the mid-point of ¯¯¯¯¯¯PQ and ¯¯¯¯¯SR respectively. If PS=BR, then the quadrilateral ADBC is a…………………… ,
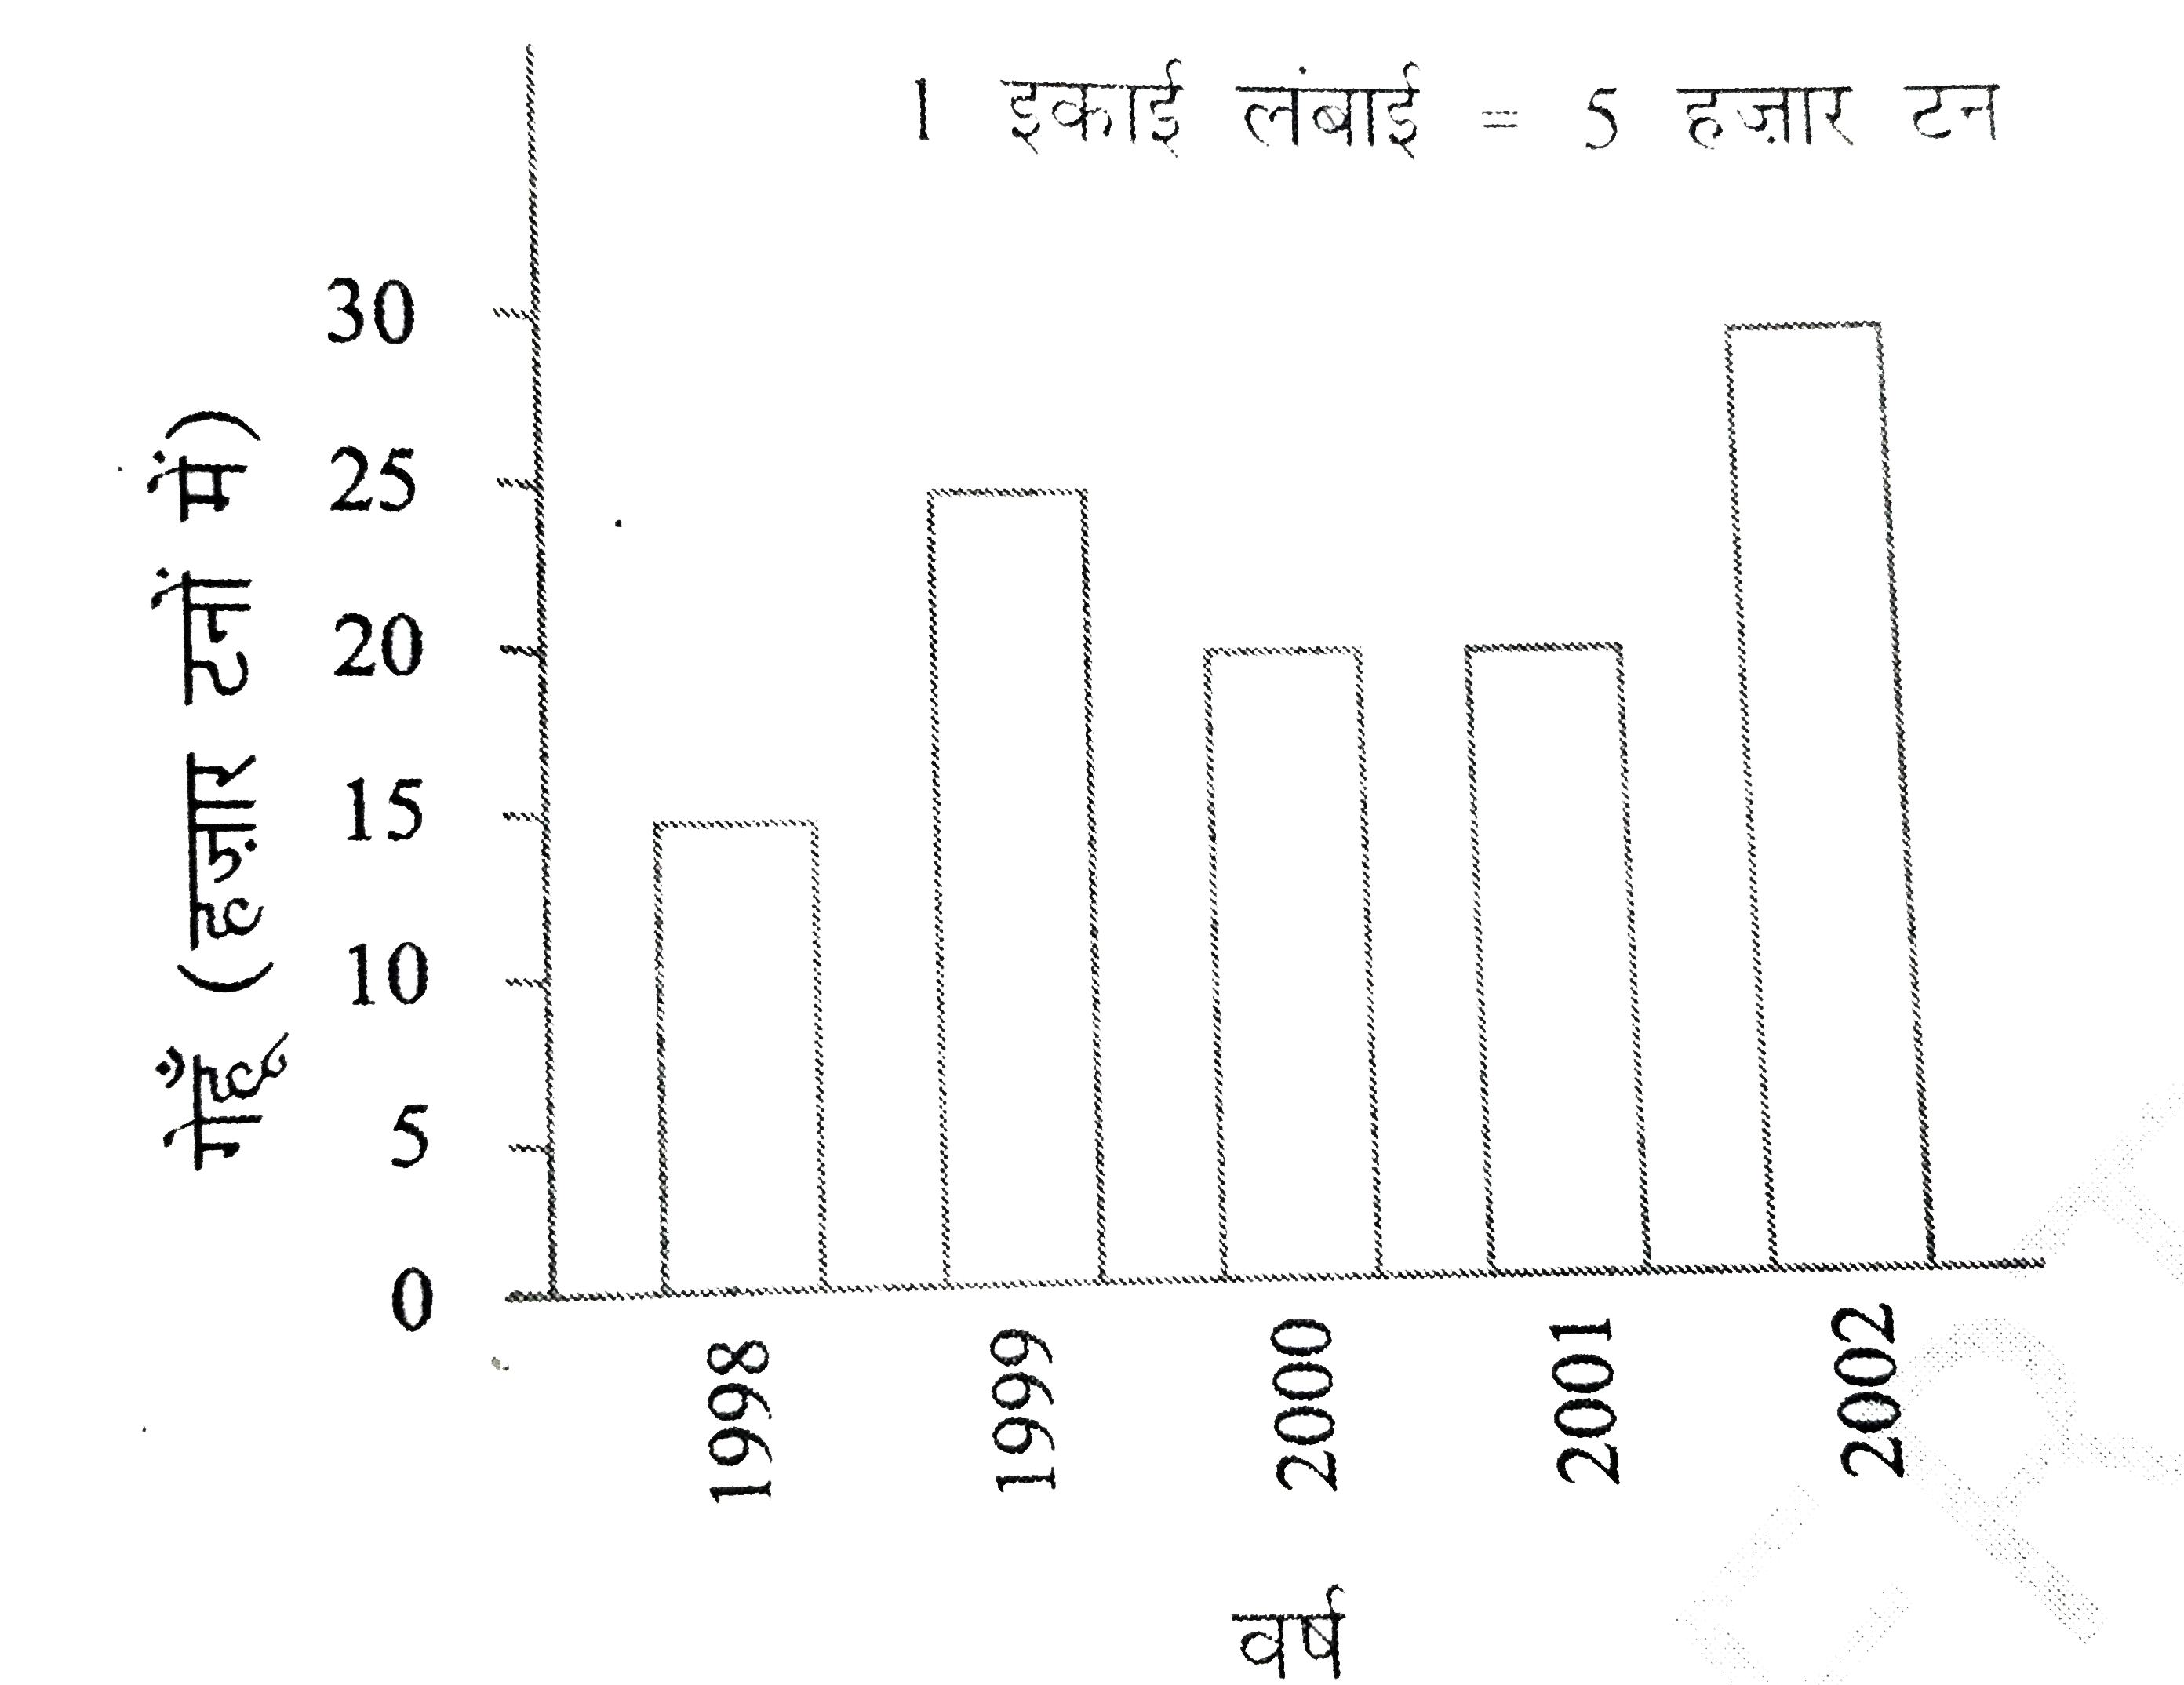
ltimg src="https://d10lpgp6xz60nq.cloudfront.net/physics_images/PS_MATH_IX_C12_E05_020_Q01.png" width="80%"gt02:51View Solutionनीचे दिया हुआ दंड आलेख वर्ष 1998−2002 में सरकार द्वारा खरीदे गए गेहु की मात्रा दर्शाता है :

इस दंड आलेख को पढ़िए और अपने प्रेक्षणो को लिखिए ।
(a) किस वर्ष में गेहू का अधिकतम उत्पादन हुआ ?
(b) किस वर्ष में गेहू का न्यूनतम उत्पादन हुआ ?02:57View SolutionThe bar graph given alongside shows the amount of wheat purchasedby government during the year 1998-2002. Read the bar graph andwrite down your observations. In which year was(a) the wheat production maximum?(b) the wheat production minimum?
01:06View SolutionThe baar graph given alongside shows the amount of wheat purchased by government during the year 1998-2002. read the bar graph andwrite down your observations. In which year was (a) the wheat production maximum?
04:11View SolutionThe baar graph given alongside shows the amount of wheat purchased by government during the year 1998-2002. Read the bar graph and write down your observations. In which year was (b) the wheat production minimum?
01:40View Solution

