The Table shows the number of cars sold by three showrooms over a period of six years.
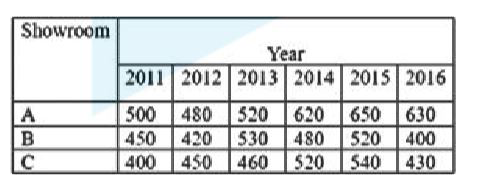
What is the ratio of the total cars sold by showroom B during the years 2014 and 2016 and the total cars sold by showroom C during 2015 and 2016?
86 : 97
88 : 97
85 : 97
88 : 95
The correct Answer is:B
Step by step video & image solution for The Table shows the number of cars sold by three showrooms over a period of six years. What is the ratio of the total cars sold by showroom B during the years 2014 and 2016 and the total cars sold by showroom C during 2015 and 2016? by Maths experts to help you in doubts & scoring excellent marks in Class 14 exams.
Updated on:21/07/2023Topper's Solved these Questions
Similar Questions
Directions: Refer to the following graph and answer the given questions. Data related to the number of shoes sold by two stores (A and B )during five years:
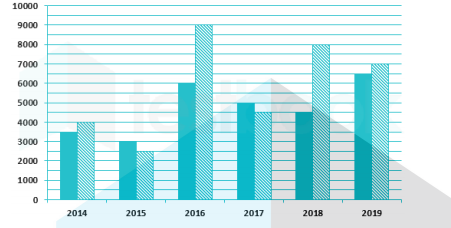
What is the difference between the total number of shoes sold by store A in 2018 and 2019 together and the total number of shoes sold by store B in 2014 and 2015 together?
View SolutionThe bar graph shows the exports of Cars of Type A and B (in ₹ millions).
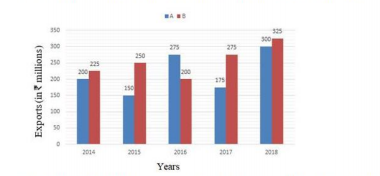 What is the ratio of the total exports of cars of type A in 2014 and 2018 to the total exports of cars of type B in 2015 and 2016?
View Solution
Knowledge Check
The table shows the number of cars sold by three showrooms over a period of six year.
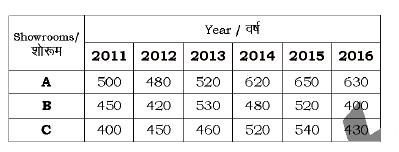
What is the ratio of the total cars sold by showrooms B during the years 2014 and 2016 and the total cars sold by showrooms C during 2015 and 2016?A86:97B88:97C85:97D88:95The table shows the number of cars sold by three showrooms over a period of six years.
यह तालिका तीन शोरूम द्वारा छः वर्षों की अवधि में बेची गयी कारों की संख्या दर्शाती है |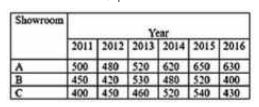 What is the average number of cars sold by showroom A over the given six years (nearest to one decimal place)?
दिए गए छः वर्षों में शोरूम A द्वारा बेची गयी कारों की औसत संख्या कितनी है ? (एक दशमलव स्थान के निकटतम )A586.7B566.7C594.7D592.7The table shows the number of cars sold by three showrooms over a period of six year.

The total number of cars sold by all three showrooms over the years is represented as a pie chart, what is the central angle of the sector representing the total number of cars sold in the year 2013A58∘B62∘C60∘D56∘
The given table represents the sale (in thousands) of cars by four companies A,B,C and D in six years. Study the table and answer the questions that follow:
दी गयी तालिका चार कंपनियों - A, B, C और D के द्वारा छः वर्षों में की गयी कारों की बिक्री ( हज़ार में ) दर्शाती है | इस तालिका का अध्ययन करें तथा फिर पूछे गए प्रश्नों के उत्तर दें |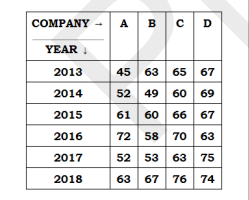 What is the ratio of total number of cars sold by companies A,B and D in 2017 to the total number
of cars sold by all companies in 2018?
कंपनी A, B और D के द्वारा 2017 में बेची गयी कारों की कुल संख्या तथा 2018 में सभी कंपनियों के द्वारा बेची गयी कारों की कुल संख्या के बीच क्या अनुपात है ?
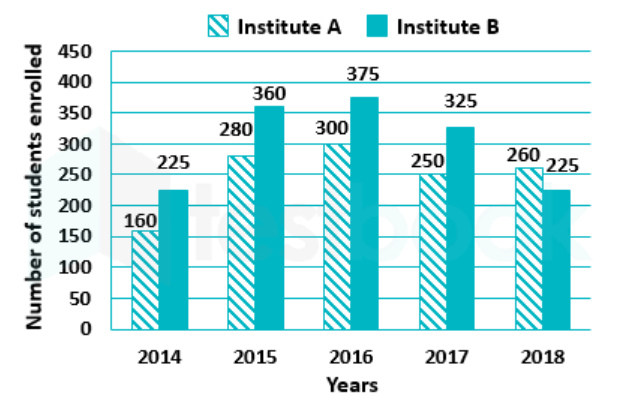
View SolutionWhat is the ratio of the total numbers of students enrolled in A during 2015 and 2018 to that of students enrolled in B during 2014 and 2016.
View SolutionTable shows the production of rice of three states over six years
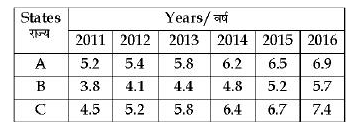
What is the ratio of the production of rice in all three states in the year 2014 to that in 2016?
View SolutionWhat was the average number of cars sold by A during Feb-Apr 2016
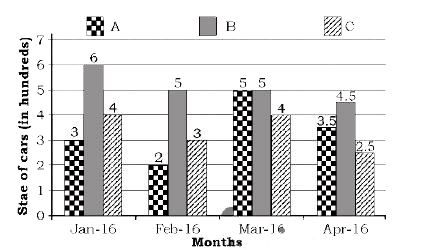
View SolutionWhat is the ratio of the total exports of cars of type A in 2014 and 2018 to the total exports of cars of type B in 2015 and 2016
View Solution
