Table shows the percentage distribution of the expenditure incurred on different items for publishing a book.
यह तालिका एक पुस्तक को
प्रकाशित करने में अलग-अलग मदों पर हुए व्यय का प्रतिशत वितरण दर्शाती है |
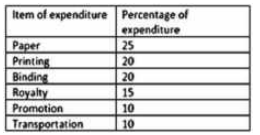 Expenditure on Royalty is less than that on Printing by:
रॉयल्टी पर किया गया खर्च प्रिंटिंग से
कितना कम है ?
0.2
0.25
0.15
0.1
Step by step video & image solution for Table shows the percentage distribution of the expenditure incurred on different items for publishing a book. यह तालिका एक पुस्तक को प्रकाशित करने में अलग-अलग मदों पर हुए व्यय का प्रतिशत वितरण दर्शाती है | Expenditure on Royalty is less than that on Printing by: रॉयल्टी पर किया गया खर्च प्रिंटिंग से कितना कम है ? by Maths experts to help you in doubts & scoring excellent marks in Class 14 exams.
Topper's Solved these Questions
Similar Questions
Table shows the percentage distribution of the expenditure incurred on different items for publishing a book.
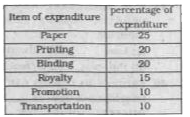
Expenditure on Promotion is less than that on the Paper by:View SolutionThe given pie-chart, shows the percentage distribution of the expenditure incurred in publishing a book. Study the pie-chart and the answer the question based on it. /
दिया गया पाई चार्ट किसी पुस्तक के प्रकाशन में हुए व्ययों के प्रतिशत वितरण को दर्शाता है | इस पाई चार्ट का अध्ययन करें तथा इस पर आधारित प्रश्न का उत्तर दें | In the given pie-chart, by what percentage the Royalty on the book is less than the Printing cost? /
दिए गए पाई चार्ट के अनुसार, इस पुस्तक पर रॉयल्टी प्रकाशन की लागत से कितना प्रतिशत कम है ?View Solution
Knowledge Check
- Question 1 - Select One
Table shows the percentage distribution of the expenditure incurred on different items for publishing a book.
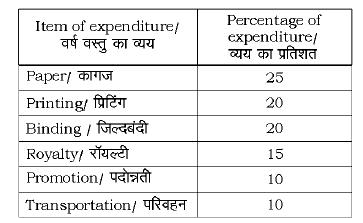
Expenditure on Royalty is less than that on printing by:A0.2B0.25C0.15D0.1
The following table shows the number of students enrolled in different faculties in a college.
निम्नलिखित तालिका एक कॉलेज में अलग-अलग विषयों में नामांकित छात्रों की संख्या को दर्शाती है | The percentage of students studying in faculties other than Science is:
विज्ञान के अतिरिक्त अन्य विषयों की पढ़ाई करने वाले छात्रों का प्रतिशत हैView SolutionThe following table shows the percentage distribution of students in various disciplines from five different colleges.
निम्नलेखित तालिका पांच अलग-अलग कॉलेजों के विभिन्न विषयों में छात्रों का प्रतिशत वितरण दर्शाती है |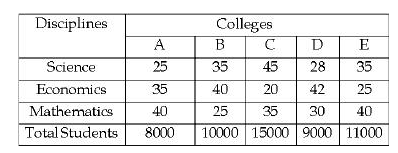 If the data of the total students’ college wise, is represented by a pie-chart, what is the central
angle of the sector representing college E (to nearest whole number)?
यदि कॉलेज वार कुल छात्रों के आंकड़ों को एक पाई-चार्ट में प्रस्तुत किया जाए, तो कॉलेज E को दर्शन वाले खंड का केंद्रीय कोण क्या होगा ? ( निकटतम पूर्ण संख्या में )View SolutionThe following table gives the frequency of vowels used in the page of a book.
निम्नलिखित तालिका एक पुस्तक के पन्नों में प्रयोग किये गए स्वर ( vowels) की आवृत्ति को दर्शाती है | As per the given data, which vowels occur less than 80 times?
दिए गए आंकड़ों के अनुसार, किन स्वरों का प्रयोग 80 बार से कम किया गया है ?View SolutionThe given graph represents the percentage distribution of the total expenditure of a company. Study the graph and answer the question that follows.
दिया गया आरेख एक कंपनी के कुल व्यय के प्रतिशत वितरण को दर्शाता है। आरेख का अध्ययन कीजिए और फिर पूछे गए प्रश्न का उत्तर दीजिए। The expenditure on .Interest on loans. is what percentage more than the expenditure on
.Transport.?
.ऋण पर ब्याज. (Interest on loans) में किया गया व्यय “परिवहन (Transport) पर किये गए व्यय से कितना प्रतिशत अधिक है ?View SolutionThe table shows the production of different types of cars (in thousands).
यह तालिका एक कंपनी द्वारा अलग-अलग कारों के उत्पादन ( हज़ार में ) को दर्शाती है |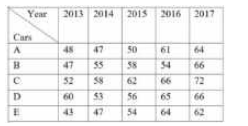 The total production of type B cars during 2013 to 2016 is approximately what percent less than the total production of cars in 2017?
2013 से 2016 के दौरान B प्रकार की कारों का कुल उत्पादन 2017 में कारों के कुल उत्पादन से लगभग कितना प्रतिशत कम है ?View SolutionThe table shows the production of different types of cars (in thousands).
यह तालिका एक कंपनी द्वारा अलग-अलग कारों के उत्पादन (हज़ार में ) को दर्शाती है |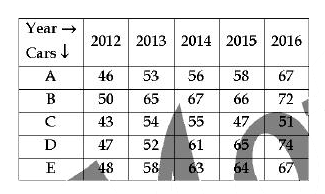 The total production of type B cars in 2015 and type D cars 2016 is what percent less than the total production of type E cars in five years?
2015 में B प्रकार तथा 2016 में D प्रकार की कारों का कुल उत्पादन पांच वर्षों में E प्रकार की कारों के कुल उत्पादन से कितना प्रतिशत कम है?View SolutionThe table shows the production of different types of cars (in thousands).
यह तालिका एक कंपनी द्वारा अलग-अलग कारों के उत्पादन (हज़ार में ) को दर्शाती है |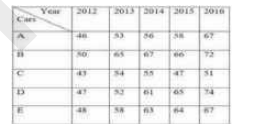 The average production of type A cars during the five years is what percent of the total production of type C cars during the five years?
पांच वर्षों के दौरान A प्रकार की कारों का औसत उत्पादन पांच वर्षों के दौरान C प्रकार की कारों के कुल उत्पादन का कितना प्रतिशत है ?View Solution

