The following table gives the frequency of vowels used in the page of a book.
निम्नलिखित तालिका एक पुस्तक के पन्नों में प्रयोग किये गए स्वर ( vowels) की आवृत्ति को दर्शाती है |
 As per the given data, which vowels occur less than 80 times?
दिए गए आंकड़ों के अनुसार, किन
स्वरों का प्रयोग 80 बार से कम किया गया है ?
a,e,i
a,i,o,u
a,o,u
a,e
The correct Answer is:C
Step by step video & image solution for The following table gives the frequency of vowels used in the page of a book. निम्नलिखित तालिका एक पुस्तक के पन्नों में प्रयोग किये गए स्वर ( vowels) की आवृत्ति को दर्शाती है | As per the given data, which vowels occur less than 80 times? दिए गए आंकड़ों के अनुसार, किन स्वरों का प्रयोग 80 बार से कम किया गया है ? by Maths experts to help you in doubts & scoring excellent marks in Class 14 exams.
Updated on:21/07/2023Topper's Solved these Questions
Similar Questions
The following table shows the number of students enrolled in different faculties in a college.
निम्नलिखित तालिका एक कॉलेज में अलग-अलग विषयों में नामांकित छात्रों की संख्या को दर्शाती है | The percentage of students studying in faculties other than Science is:
विज्ञान के अतिरिक्त अन्य विषयों की पढ़ाई करने वाले छात्रों का प्रतिशत है
View SolutionAs per the data shown in the following table, what is the percentage of students who got less than 50 marks?
निम्नलिखित तालिका में दिए गए आंकड़ों के अनुसार, उन छात्रों का प्रतिशत क्या है जिन्हें 50 अंक से कम अंक आए हैं ?
View SolutionTable shows the percentage distribution of the expenditure incurred on different items for publishing a book.
यह तालिका एक पुस्तक को प्रकाशित करने में अलग-अलग मदों पर हुए व्यय का प्रतिशत वितरण दर्शाती है |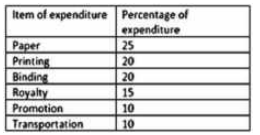 Expenditure on Royalty is less than that on Printing by:
रॉयल्टी पर किया गया खर्च प्रिंटिंग से कितना कम है ?
View SolutionThe Table given below presents the marks obtained by three students in five examinations.
नीचे दी गयी तालिका पांच परीक्षाओं के तीन विषयों में छात्रों के द्वारा प्राप्त किये गए अंकों को दर्शाती है |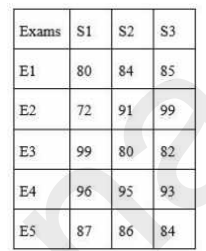 What is the average of marks obtained by S3 per exam?
S3 द्वारा हर परीक्षा में प्राप्त किये गए अंकों का औसत कितना है ?
View SolutionThe following table shows the items of expenditure of a company (in ₹ lakh per annum), from 2015 to 2019.
निम्नलिखित तालिका 2015-2019 तक एक कंपनी के व्यय की मदों को ( लाख रुपये प्रति वर्ष में ) दर्शाती है | What is the average amount of interest per year which the company had to pay during this
period?
इस अवधि के दौरान प्रति वर्ष कंपनी को ब्याज की कितनी औसत राशि का भुगतान करना पड़ा है ?
View SolutionThe following table shows the daily earnings of 45 skilled workers: How many workers earn less than ₹ 1,100 in a day?
निम्नलिखित तालिका 45 कुशल श्रमिकों की दैनिक आय को दर्शाती है |
कितने श्रमिक एक दिन में 1,100 रुपये से कम कमाते हैं ?
View SolutionThe table shows the production of different types of cars (in thousands).
यह तालिका अलग-अलग प्रकार के कारों का उत्पादन ( हज़ार में) दर्शाती है |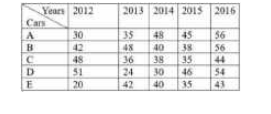 The number of years, in which the production of cars of type B is less than the average production of type D cars over the years is:
कितने वर्ष B प्रकार की कारों का उत्पादन इन वर्षों के दौरान D प्रकार की कारों के औसत उत्पादन से कम रहा है ?
View SolutionThe table given below shows the number of units of a product produced and sold by a company in 6 years.
निम्न तालिका एक कंपनी द्वारा छह वर्षों के दौरान उत्पादित और बेचे गए उत्पाद की यूनिटों की संख्या दर्शाती है|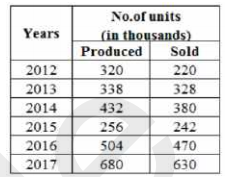 In which year, the production of product units is about 31.4% lower than units sold in 2017?
किस वर्ष में, उत्पाद की यूनिटों का उत्पादन 2017 में बेची गई यूनिटों की तुलना में लगभग 31.4% कम है ?
View SolutionThe heights of some girls in a school were noted and the data obtained are as shown in the table.
एक विद्यालय में कुछ लड़कियों की लंबाई को दर्ज किया गया तथा इस प्रकार प्राप्त आंकड़ों को इस तालिका में दर्शाया गया है | How many girls have a height of 135 cm or more but less than 150 cm?
कितनी लड़कियों की लंबाई 135 सेमी या अधिक है लेकिन 150 सेमी से कम है ?
View SolutionThe following table showing the percentage of the total population of a state in different age groups. Out of every 50,000 people, find the approximate number of persons below the age of 35?
निम्नलिखित तालिका एक राज्य में अलग-अलग आयु वर्ग की कुल आबादी के प्रतिशत को दर्शाती है |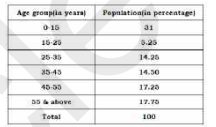
प्रत्येक 50,000 लोगों में से, 35 वर्ष से कम उम्र के लोगों की संख्या (लगभग) ज्ञात करें |
View Solution
