What is the ratio of total number of persons of ages above 50 years in the villages B and C taken together to the total number of persons having ages between 20 and 50 years in the said village
49:57
47:53
51:59
24:27
Step by step video & image solution for What is the ratio of total number of persons of ages above 50 years in the villages B and C taken together to the total number of persons having ages between 20 and 50 years in the said village by Maths experts to help you in doubts & scoring excellent marks in Class 14 exams.
Updated on:21/07/2023Topper's Solved these Questions
Similar Questions
What is the ratio of total number of persons of ages above 50 years in the villages B and C taken together to the total number of persons having ages between 20 and 50 years in the said village
View SolutionThe given Bar Graph presents the percentages of population in the age groups. X(above 50 years), Y(20 to 50 years). Z(below 20 years) in five different villages. A,B,C,D and E with total population of 5000, 6000, 8000, 4500 and 6000 respectively
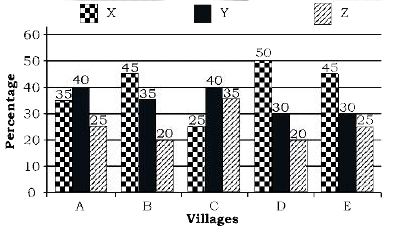 The difference between the number of persons of ages below 20 years in villages D and E,taken together, is what percentage of the number of persons of the same age group in village D?
View Solution
Knowledge Check
What is the total number of person in the age group of 20 to 50 years in the villages A and B, taken together
A4300B4200C4100D4000The difference between the number of persons of ages below 20 years in villages D and E taken together, is what percentage of the number of persons of the same age group in village D?
A1903B1853C1823D2003Study the following histogram and answer the questions.
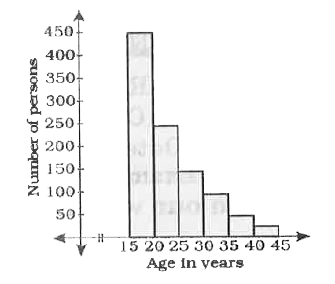
The number of persons in the age group 20 - 30 years is :A475B400C300D700
A study was made for the number of persons of different age group visited in a library in a week which is shown in the histogram. Study the histogram and answer the question given below.
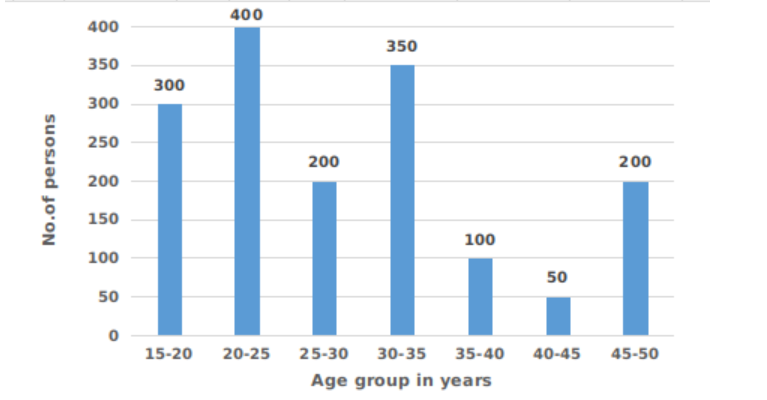
The ratio of the number of persons in the age groups 15-20 years and 20-25 years together, to the number of persons in the age groups 30-35 years and 35-40 years together, is:
View SolutionA study was made for the number of persons of different age groups visited in a library in a week which is shown in the histogram. Study the histogram and answer the questions given below.
एक सप्ताह में एक पुस्तकालय में जाने वाले विभिन्न आयु समूहों के व्यक्तियों की संख्या के लिए एक अध्ययन किया गया था जो हिस्टोग्राम में दिखाया गया है। हिस्टोग्राम का अध्ययन करें और नीचे दिए गए प्रश्नों के उत्तर दें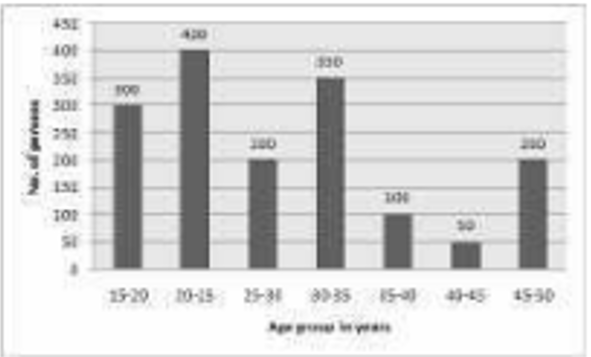 The ratio of the number of persons in the age groups 15-20 years and 20-25 years together, to
the number of persons in the age group 30-35 years and 35-40 years together, is:
View SolutionThe given bar graph presents the percentages of population in the age groups X ,Y , Z in five different villages A,B,C,D and E total population of 5000,6000,8000,4500 and 6000 respectively.

The number of persons having ages below 20 years in villages B and C taken together is what percentage of the total population of the said villages.
View SolutionStudy the following histogram and answer the questions.
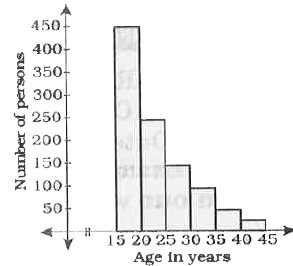
The total number of persons in the age group of 15 years to 45 years is :
View SolutionThe ratio of ages of two persons is 5:9 and the age of one of them is greater than the other by 40 years. The sum of then-ages in year is:
View Solution
