The given bar graph presents the sales of a particular brand of car by three showrooms, A,B and C during the months Jan,Feb ,Mar and Apr 2016
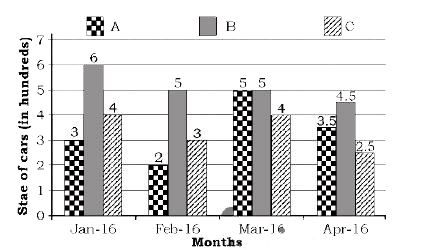
If the cars sold by A and B are all found to be in perfect order, but the cars sold by C were found to be defective to the extent of 15%,10% and 8% and 6% respectively in Jan,Mar and Apr 2016 What is the percentage of defective cars sold by all showrooms during Apr 2016?
449
137
249
723
Step by step video & image solution for The given bar graph presents the sales of a particular brand of car by three showrooms, A,B and C during the months Jan,Feb ,Mar and Apr 2016 If the cars sold by A and B are all found to be in perfect order, but the cars sold by C were found to be defective to the extent of 15%,10% and 8% and 6% respectively in Jan,Mar and Apr 2016 What is the percentage of defective cars sold by all showrooms during Apr 2016? by Maths experts to help you in doubts & scoring excellent marks in Class 14 exams.
Updated on:21/07/2023Topper's Solved these Questions
Similar Questions
The given Bar Graph presents the sale of a particular brand of car by three showrooms, A, B and C (in multiples of 100) during the months Jan, Feb, Mar and Apr, 2016.
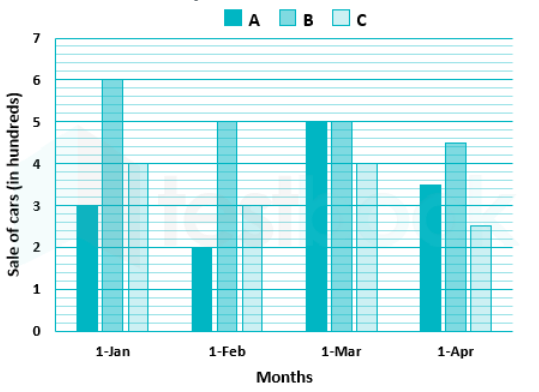
What is the ratio of number of cars sold by A in Jan-Feb, 2016 to that of cars sold by B during Mar-Apr, 2016?
View SolutionThe given bar graph present the sale of a particular brand of tea by three outlets A,B and C during the months Jan, feb , mar and Apr 2018.
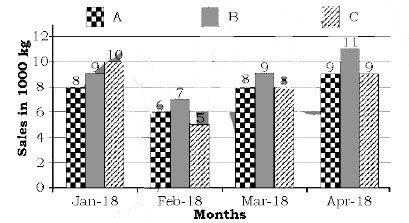
What is the ratio rate of growth in sales from B to the rate of growth in sales from C in mar 2018 with reference to its previous month ?
View Solution
Knowledge Check
IF the cars sold by A and B are all found to be in perfect order, but the cars sold by C were found to be defective to the extent of 15% ,10%,8% and 6% respectively In Jan,Feb,Mar and Apr 2016 then what is the ratio of non defective cars sold by C to that of all cars sold by A and B during Jan mar 2016?
 A177:1400B384:1385C489:1300D255:1348
The given Bar Graph presents the sale (in 1000 kg ) of a particular brand of tea by three outlets, A,B, and C during the months Jan,Feb ,Mar and Apr,2018.
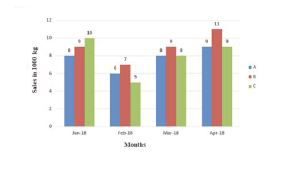
What is average sales per month by A during Jan-Mar,2018?A7505 kgB7333.33 kgC7334.67 kgD5500 kgThe given Bar Graph presents the sale (in 1000 kg) of a particular brand of ten by three outlets , A,B and C during the months Jan,Feb,Mar and Apr,2018
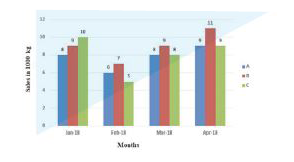
Arrange the ratio of sales from B to that from A and C, taken together,month wise in ascending order.AJan,Feb,Mar,AprBJan,Apr,Mar,FebCJan,Mar,Apr,FebDJan,Mar,Feb,Apr
The given bar graph represents the sale of cars in five different states in a month.
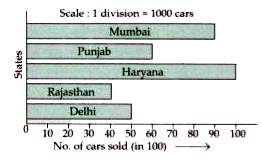
Which state sold 5000 cars ?
View SolutionThe given bar graph represents the sale of cars in five different states in a month.
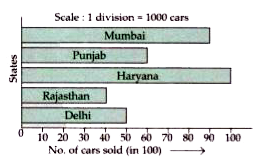
Which state sold maximum number of cars ?
View SolutionThe given bar graph presents the sale of a particular brand of car by three showrooms, A, B and C( in multiples of 100) during the months of Jan, Feb, Mar and Apr, 2016
दिया गया दंड आरेख (बार ग्राफ) तीन शो-रूम- A, B और C के द्वारा जनवरी, फरवरी, मार्च और अप्रैल, 2016 के दौरान कार के एक खास ब्रांड की (100 के गुणक में) बिक्री को दर्शाता है|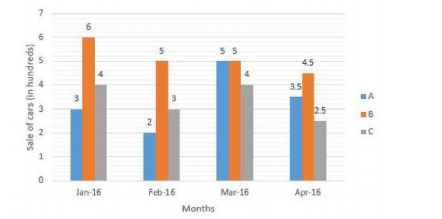 What was the average number of cars sold by A during Feb-Apr, 2016?
फरवरी-अप्रैल 2016 के दौरान, A के दवारा बेची गई कारों की औसत संख्या क्या थी?
View SolutionWhat was the average number of cars sold by A during Feb-Apr 2016

View SolutionThe table shows the number of cars sold by three showrooms over a period of six years.
यह तालिका तीन शोरूम द्वारा छः वर्षों की अवधि में बेची गयी कारों की संख्या दर्शाती है |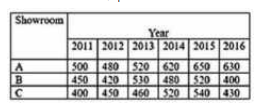 By what percent did the total number of cars sold by all three showrooms decrease during the year 2016, as compared to that in the year 2015 (nearest to one decimal place)?
वर्ष 2015 की तुलना में वर्ष 2016 में तीनों शोरूम के द्वारा बेची गयी कारों की कुल संख्या में कितने प्रतिशत की कमी आयी है ? (एक दशमलव स्थान के निकटतम )
View Solution
