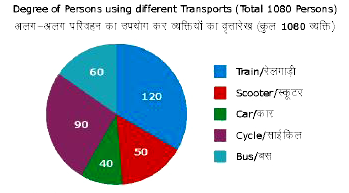
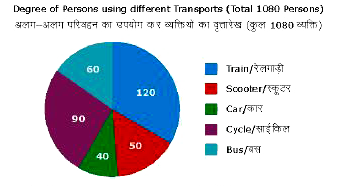
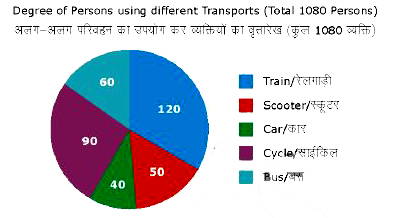
In the given pie chart the number of persons using a car is what percentage of persons using a scooter?
0.6
0.75
0.8
0.5
Step by step video & image solution for In the given pie chart the number of persons using a car is what percentage of persons using a scooter? by Maths experts to help you in doubts & scoring excellent marks in Class 14 exams.
Updated on:21/07/2023Topper's Solved these Questions
Similar Questions
Knowledge Check
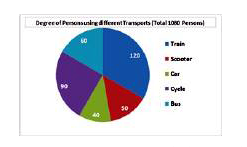
In the given pie-chart, what is the ratio of the total number of persons using train and car together to the total number of persons using other modes of transport to reach their workplace?A3:5B5:3C5:6D4:5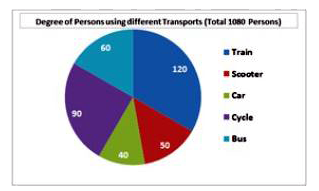
In the given pie-chart, how many persons are using train to reach their workplace?A380B400C320D360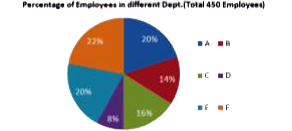
In the given pie-chart. what is the number of employees working in department A?A80B85C90D960
Study the pie chart and answer the question
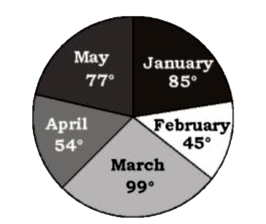
The total number of computers sold in February and April is what percentage more than the number of computers sold in May
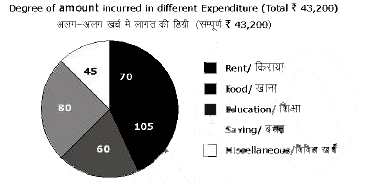
View SolutionIn the given pie chart what is the total expenditure on rent
View SolutionThe following bar chart represents the number of first year B. Com. Students of St Xavier's College using different companies smart phones. Study bar chart and answer the questions.
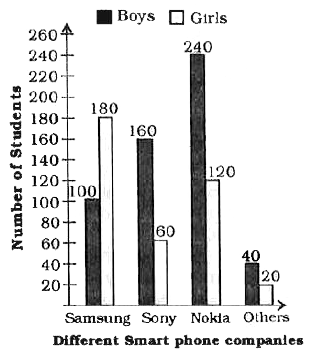
The bar chart representing the number of students using different smart phones.
What percentage of boys are using the smart phones of Samsung ?
View SolutionThe following bar chart represents the number of first year B. Com. Students of St Xavier's College using different companies smart phones. Study bar chart and answer the questions.
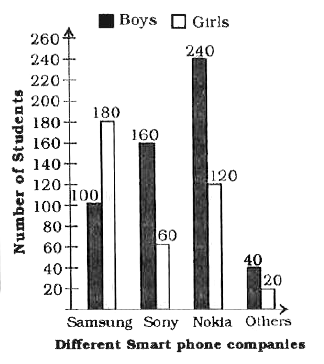
The bar chart representing the number of students using different smart phones.
What percentage of girls are using the smart phones of Nokia ?
View SolutionThe following graph represents the transport used by children. Study the graph and answer the given questions.
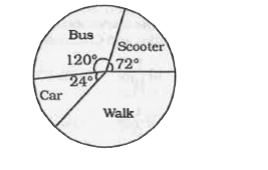
What is the percentage of children using scooter ?
View Solution

