In the given pie chart how many persons are using train to reach their workplace
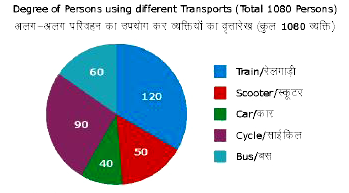
380
400
320
360
Step by step video & image solution for In the given pie chart how many persons are using train to reach their workplace by Maths experts to help you in doubts & scoring excellent marks in Class 14 exams.
Updated on:21/07/2023Topper's Solved these Questions
Similar Questions
In the given pie chart the number of persons using a car is what percentage of persons using a scooter?
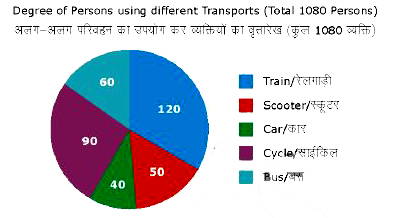
View SolutionIn the given pie chart what is the ratio of the total number of persons using train and car together to the total number of persons using other modes of transport to reach their work place?
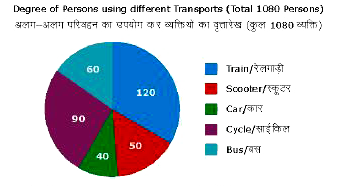
View Solution
Knowledge Check
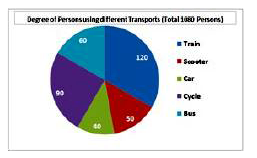
In the given pie-chart, the number of persons using a car is what percentage of persons using a scooter?A0.6B0.75C0.8D0.5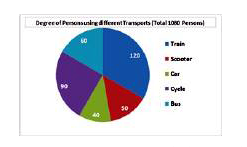
In the given pie-chart, what is the ratio of the total number of persons using train and car together to the total number of persons using other modes of transport to reach their workplace?A3:5B5:3C5:6D4:5
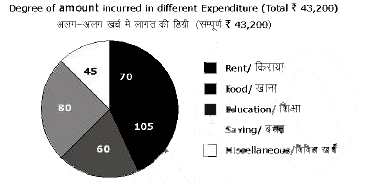
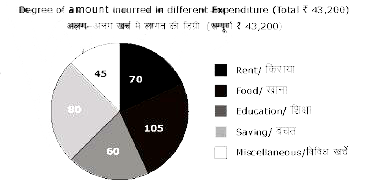
In the given pie chart what is the total expenditure on rent
View SolutionThe given pie chart shows the percentage distribution of the expenditure incurred in publishing a book study the pie chart and the answer the question based on it.
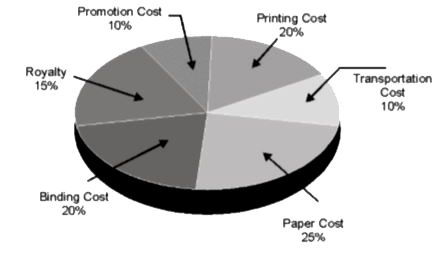
In the given pie chart by what percentage the promotion cost on the book is less than the paper cost?
View SolutionIn the given pie chart, the amount spend on education is what percent of the savings?
View SolutionThe given pie chart shows the percentage distribution of the expenditure incurred in publishing a book study the pie chart and the answer the question based on it.
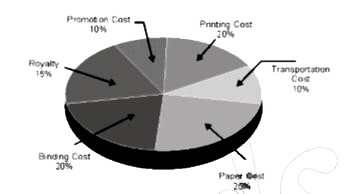
IN the given pie chart, by what percentage printing and Binding cost on the book is less than the other costs?
View SolutionThe given pie-chart, shows the percentage distribution of the expenditure incurred in publishing a book. Study the pie-chart and the answer the questions based on it
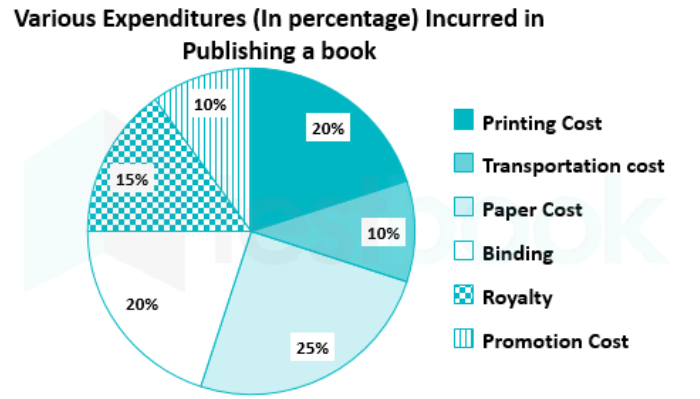
In the given pie-chart by what percentage the Promotion cost on the book is less than the Paper cost?
View SolutionThe given pie chart shows scored by A in 6 matches
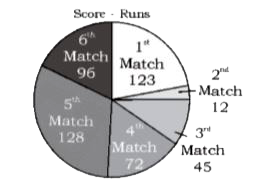
In the given pie chart, what is the increase or decrease in score in match 4 as compared to match 2
View Solution
